Natural Science
Vol.4 No.1(2012), Article ID:17026,9 pages DOI:10.4236/ns.2012.41002
Hydrological seasonality of cape Ghir filament in Morocco
![]()
1Institut National de Recherche Halieutique (INRH), Casablanca, Morocco; *Corresponding Author: Makaouireda@yahoo.fr
2Université Las Palmas Gran Canaria (ULPGC), Las Palmas, Spain
Received 18 October 2011; revised 20 November 2011; accepted 18 December 2011
Keywords: Filament; Upwelling; Hydrology; Remote Sensing
ABSTRACT
The filament of cape Ghir is characterized by a spatial and temporal variability relating to circulation of the water masses of the zone and current velocity of canaries current. The activity of resurgences of cape Ghir appears from April, intensifies during August and June and still persists in October during 2009. During the season of summer and autumn, the filamentous structure is marked by the presence of an activity of important resurgences. In August, the filament is restricted on one branch and appears in limited area of cape Ghir. In autumn, the filament structure fellow several branches toward different directions between cape Ghir and cape Sim.
1. INTRODUCTION
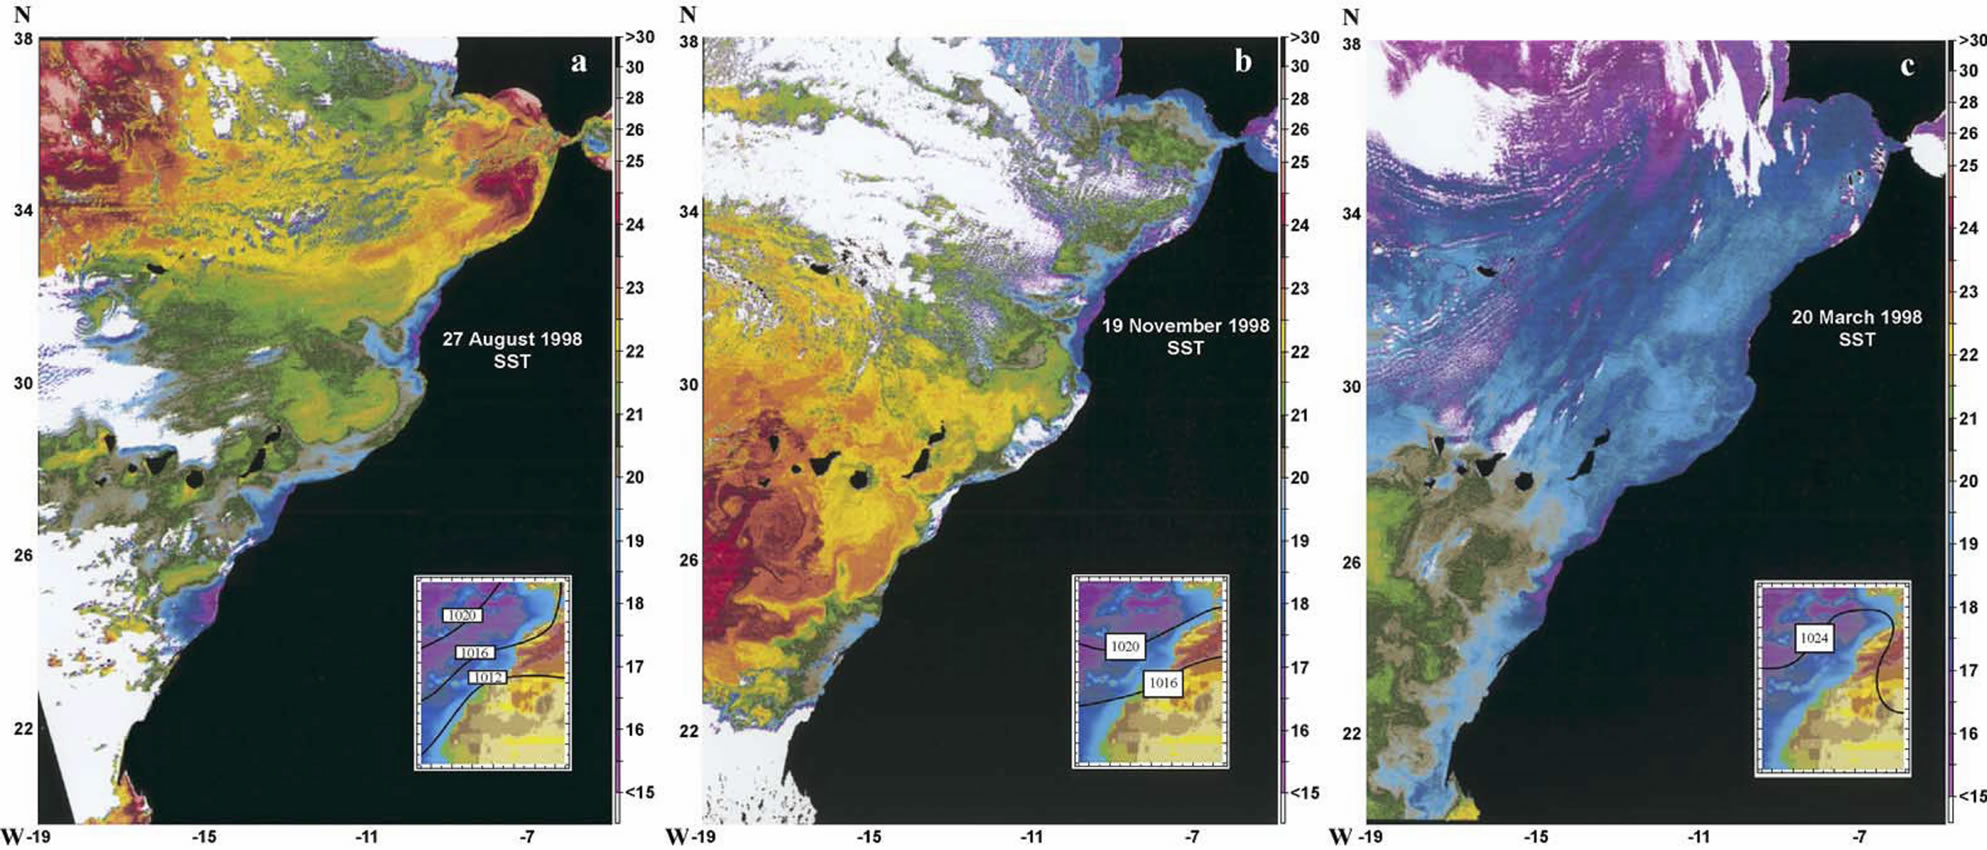
The filaments structures are mainly related to transport of up welled coastal water towards off shore [1]. Therefore they are localised generally at the coastal upwelling areas as a tangue or jets under the name of upwelling filament [2] (Flament et al., 1985). They are frequently observed on the satellite images on subtropicals regions in particular on the Moroccan Atlantic zone which is part of the canarie current system [3-6]. Although these images describe the state of the filaments on the surface, in situ studies showed that the hydrological characteristics of these phenomena can reach depths which exceed 100 m and are associated with current from 18 to 80 cm/s [7]. The Cape Ghir filament and that of the Cap Blanc are among the principal filaments of the Moroccan Atlantic coast [8]. The first one which we are focussing, takes its origin from the resurgences located on the level of the zone ranging between Cap Cantin (32˚30'NR) and Cap Ghir [9]. Its movement towards off shore can reach 200 km by the interaction of the western southern current and the slope of the continental shelf ([5,10,11]). The hydrographic studies carried out by [6,8] showed that the presence of this filament is permanent even in absence of the winds supporting resurgences. [3,12] suggest that it is the intense upwelling of this zone in summer and autumn which supports a long filament off shore for this period. That is illustrated by the satellite images of SST of Figure 1 which highlights the presence of the filament at Cap Ghir during the activity of the upwelling in summer [8].
Our study carried out since December 2008 until October 2009 will enable us to locate the filament of Cap Ghir and to follow its space and temporal variability. Also its relation with the activity of the upwelling of this zone helps as to see how its maximum spreading off shore makes it possible to transport the biological richness of coastal resurgences of this area.
2. OCEANOGRAPHICAL NETWORK SAMPLING
Within the framework of the oceanographical study of the pelagic ecosystem along the Moroccan Atlantic coast and of the co-operation between the INRH and the ULPGC (Université Las Palmas Gran Canaria), the INRH institute organized, on board the N/R “Amir Moulay Abdellah (AMA)”, four oceanographical cruises relating to the study of the filament of the Cape Ghir in the area of the 30˚30'NR - 31˚N since December 2008 until October 2009 according to the following calendar (Table 1).
Eleven stations were sampled (Figure 2). Transect of Cap Ghir (31˚N) perpendicular to the coast with 7 stations where the coastal station 01 located at 09˚50.19'W and the station 07˚ at 11˚10'W and other parallel transect to the coast between the isobaths 200 and 500 m (10˚20''W) approximately with 4 stations located between 30˚30'N (St 12) and 31˚30'N (St 09). During the program of August realized by the Spanish R/V “Gamboa”, only 09 Stations were carried out and the two stations, St 11 and St 12 could not be done because of the very strong disturbance which the zone knows during the cruise of this period.
The physical parameters (temperature, salinity, density,
 (a) (b) (c)
Figure 1. SST satellite images for (a) August 27, 1998; (b) November 19, 1998; and (c) March 20, 1998. The colour temperature code is shown in a vertical scale at the right of the images (units in ˚C). The insets show the corresponding surface pressure fields (units in mbar).
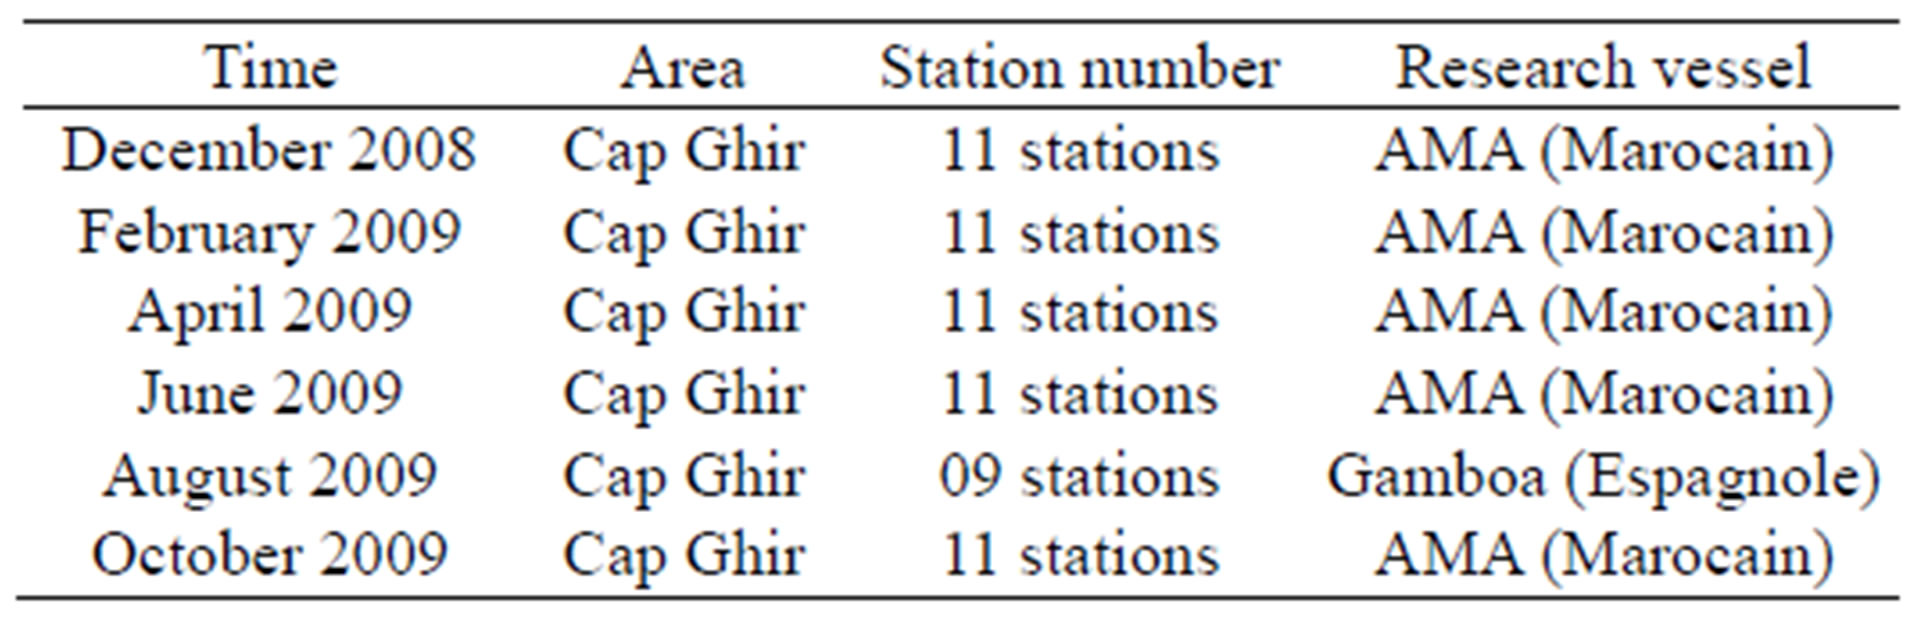
Table 1. Itinerary of the cruises.
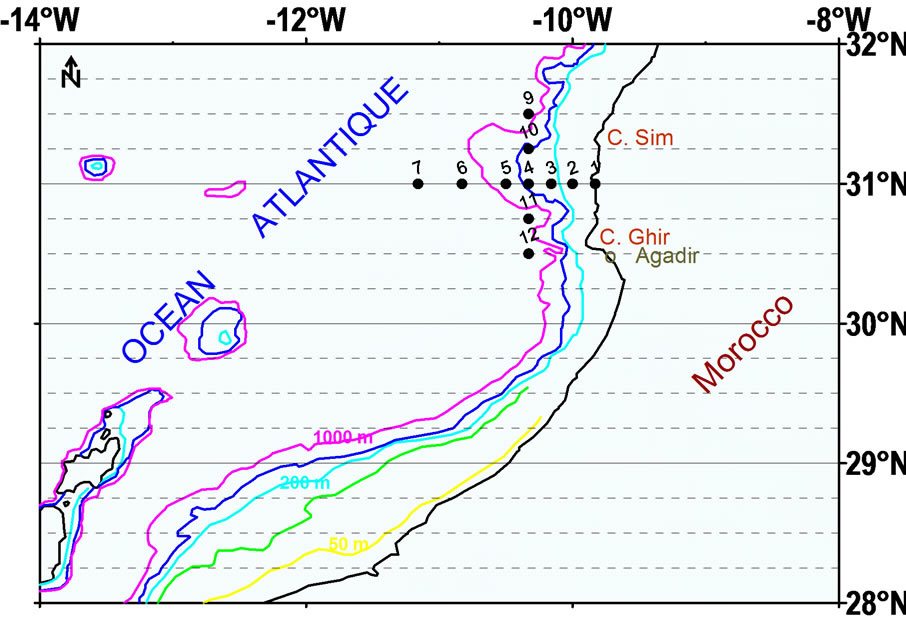
Figure 2. Oceanographical network of sampling.
fluorescence and transmission) were carried out after having to add a sensors probes of fluorometer and transmitometter adapted to the CTD 911 plus and 5 L Nishkins bottles to the caroussel by the university of Las Palmas.
The profiles of the CTD are carried out until a maximum depth of 150 with 200 m. The test sample selections of sea water were carried out on standard levels (0, 25, 50, 90, 150 m). The level of 25 m varies according to mixed layer as the situation of the maximum in fluorescence. Dissolved oxygen is analysed by the method of Winkler on board. Nutrient (PO4, NO3 and NH4) are determined by spectrophotometric method. The maximum level was limited to 150 m because of surface hydrological characteristics of the filaments can reach depths between 100 m to 150 m [7].
3. ORIGIN OF CAP GHIR FILAMENT
According to [7,13], the filaments depend on several factors which are mainly the baro clinic instability of the coastal currents, the irregularity of the coastal line and the topography of sea-bed, coastal convergence due to the wind disturbance and the interaction of the cyclonic gyre off shore with the coastal region. But the most important element is that the filament appears during the season of upwelling (case of California).
Thus, the structure of the filament of cape Ghir was present during the oceanographic cruises of the Nineties carried out on board the Russian R/V Atlantniro [9]. The surface temperature and salinity distributions show up welled water plated at the coast between Cape Cantin and Cape Ghir and also their spreading out off shore make sure the visible filament of cool water less salted during the season of activity of upwelling of summer (1994) and autumn (Nov. 2004) (Figure 3). The drift of this water towards the broad show a different seasons structures. During the summer, the jet of the filament has a western southern direction supported by a coastal drift towards north, of warm water of bight of Agadir. Whereas in autumn, the filament presents a plume perpendicular to the coast and moves towards the west to western north. This structure can be
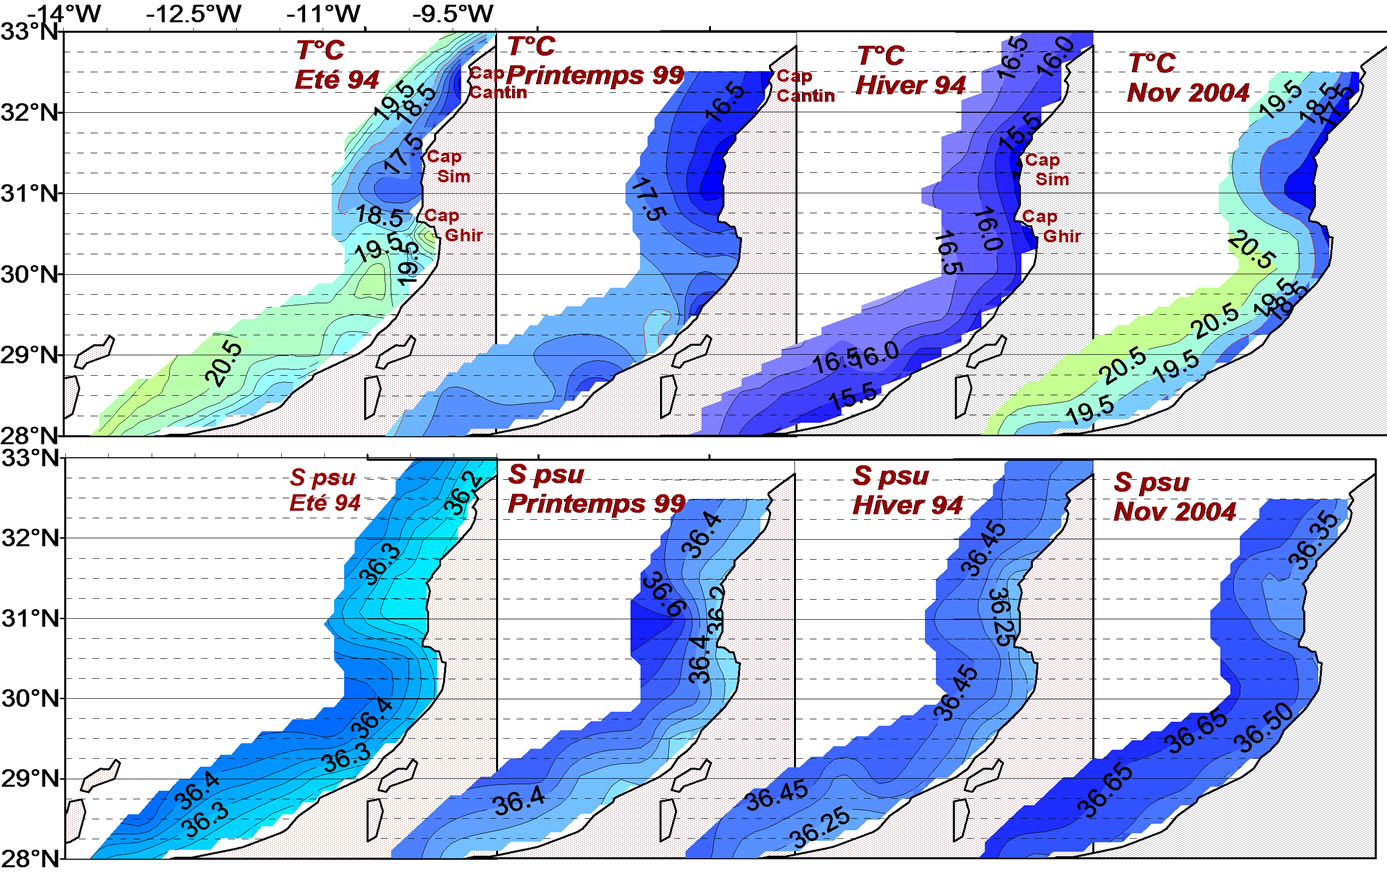
Figure 3. Temperature and salinity distribution in cape Ghir area during four seasons of the year.
explained by the existence of a current (within a level of 10 m depth) of maximum intensity of about 34 cm/s ([14,15] but with a seasonal average of 10 times weaker and of direction variables mainly between the south-western direction and south-east. Whereas the speed of the drift of water of resurgence is about 10 cm/s [16].
Thus, the structure of the filament of Cape Ghir takes a western direction when the speed of the drift of water of upwelling overrides the southern current velocity (case of fall season) weaker by bottom northern current direction at this season [8] in the bight of Agadir. And in the other hand, when the southern current velocity carries it (case of the season of summer), the filament takes a structure of south-western direction.
Our study focuses the evolution of the special and temporal variability of this filament and its impact on the hydrology of the adjacent marine ecosystem. During our oceanographics cruises since December 2008 until October 2009, we could locate and follow the origin and the spreading of the filament according to the realization of the 31˚N transversal transact and the 10˚20'W longitudenal transact.
4. RESULTS AND DISCUSSIONS
4.1. Seasonal Variability of the C. Ghir Upwelling
The vertical profile of the physical parameters along the 31˚N transact indicates an activity of resurgences from April and intensifies during August and June. It still persists in October 2009 (Figure 4). These resurgences are marked by a temperature and salinity gradients between the coast and off shore which can exceed respecttively 4˚C and 0.3 psu. The immersion of up welled water has an origin maximum of about 200 m in June.
This activity of the upwelling is followed by an important chlorophyllian richness marked by a distribution of the maximum of fluorescence in the active center of the upwelling and along the mixed layer located between 20 m at the coast and 100 m far offshore to station 06.
This structure is also marked on TS diagram of the 31˚N transact by the presence of the water masses, characterised by cold and less salted water, clearly visible on the coastal stations, from April and is reinforced from June to October 2009 (Figure 5) when the advection of the oligothrophic water from the offshore toward the coast line. In the other hand, this activity has an influence on the sub surface water colomn productivity, by the mixed layer, which presents an advection toward the offshore till station 7.
Whereas during February 2009 and December 2008, the absence of these water masses of resurgence was very marked by less stratification and predominant by only one homogeneous water mass on the entire water column. Also, this situation had a negative impact on the productivity of the water column marked by a low amount of fluorescence which was limited near the coast.
4.2. Saisonnal Variability of C. Ghir Upwelling Filament
Several authors supposed that the filament of cape Ghir is permanent [8]. Whereas during this study, we attended periods when the filamentous structure of the upwelling of cape Ghir is almost absent. Indeed, during December, February and April, the cold temperatures and low salinities are localised at the coast and do not seem to be of upwelling because of the small boundary of cold and less salty water detected near the coast (april 2009). As the thermo—haline gradient is not as marked as elsewhere.
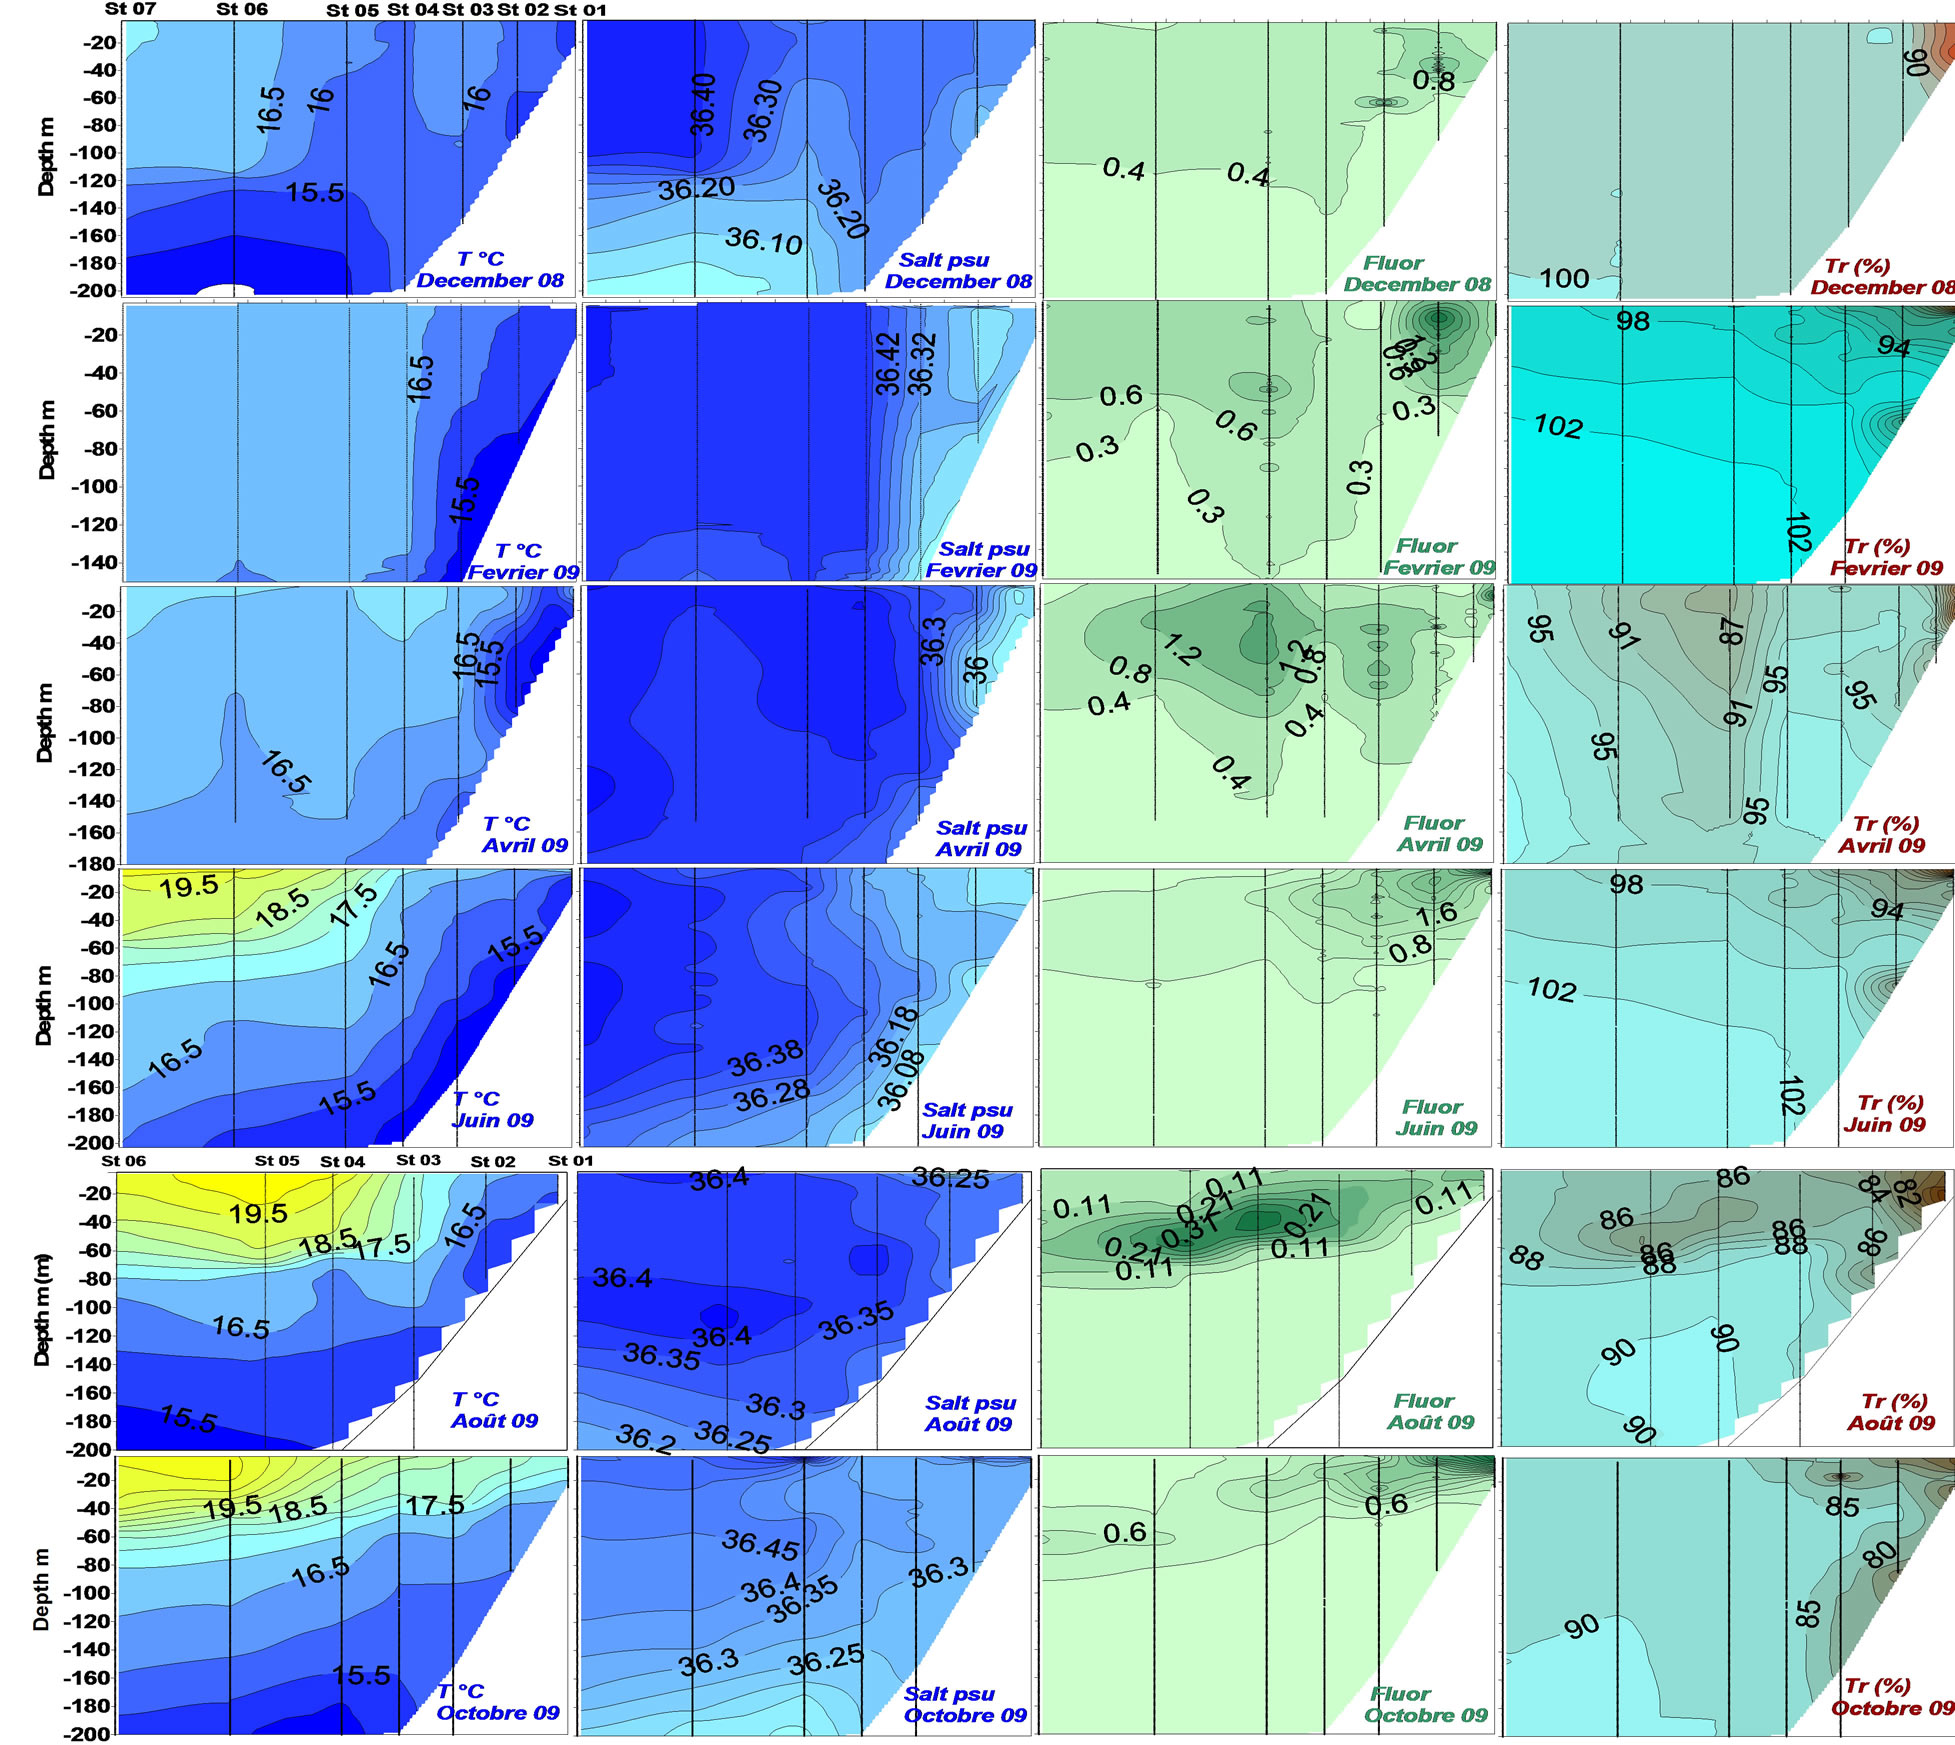
Figure 4. Physical parameters distribution along the 31˚N transact (December 2008 to October 2009).
That is reflected on the fluorescence distribution which show a low and dispersed concentration but remaining important only during April (Figure 4) Also, while following the distribution of these parameters along the longitudinal transact (Figure 6), we note that the cool and less salted water is more marked in stations 11 and 12. The cast profiling of the CTD on station 12 shows well the impact, on the surface, of cold water of resurgence, less salted and very fluorescent which derives towards this station located at the southern limit from cape Ghir (Figure 6). Also the intensity of fluorescence and turbidity are marked in the south of 31˚N in this period of the year.
Whereas during the activity season of the upwelling (June, August and October), the distribution of the hydrological parameters is very influenced by the presence of the filament. Thus, the vertical distribution of the physical parameters along longitudinal transact (10˚12''N) shows the presence of the maximum of fluorescence along the mixed layer between stations 10 and 11 on a water column ranging between 20 and 100 m (Figure 7). And in this case the filament of up welled water derives more to north and its influence appears on stations 09 and 10.
Also, during the period of weak activity of resurgences (December, February, April), the TS diagrams shows the water masses derive towards the south while following a very coastal way and appears in the south of the 31˚N transact in stations 11 and 12 by cool and less salted water. Whereas during October and June when the upwelling is very active in this zone, the impact of resurgences appears more in north by stations 09 and 10 (Figure 8). Finally, the absence of upwelling in December is reflected on the dispiriting of filament by showing a homogenous water mass along this transact.
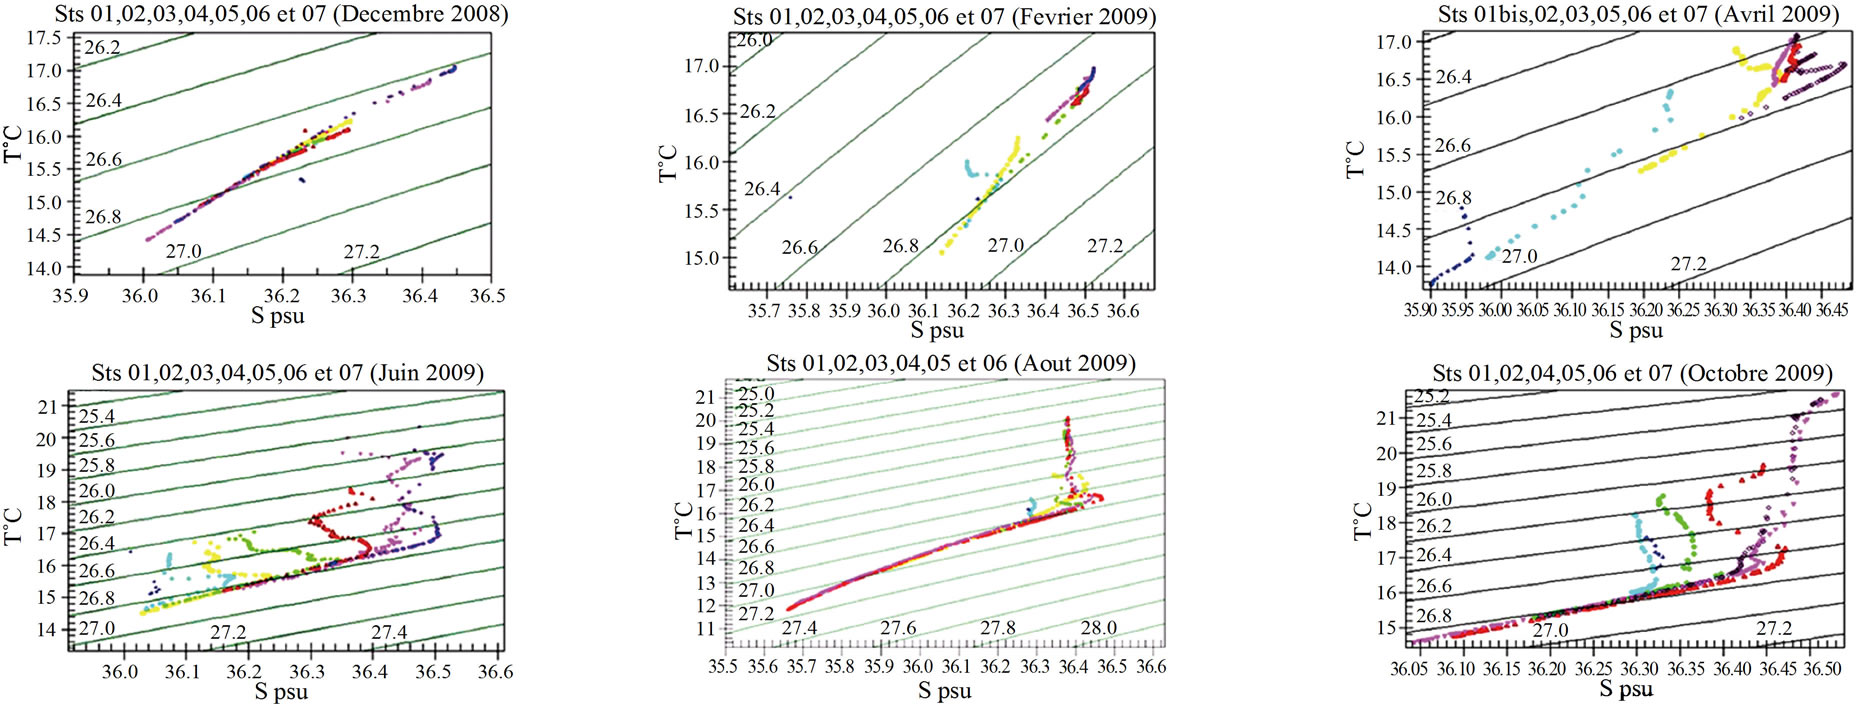
Figure 5.TS diagramm of 31˚N transact (December 2008 to October 2009).
+ st 01, ● st 02, ■ st 03, ♦ st 04, ▲st 05, ▼st 06, ○ st 07
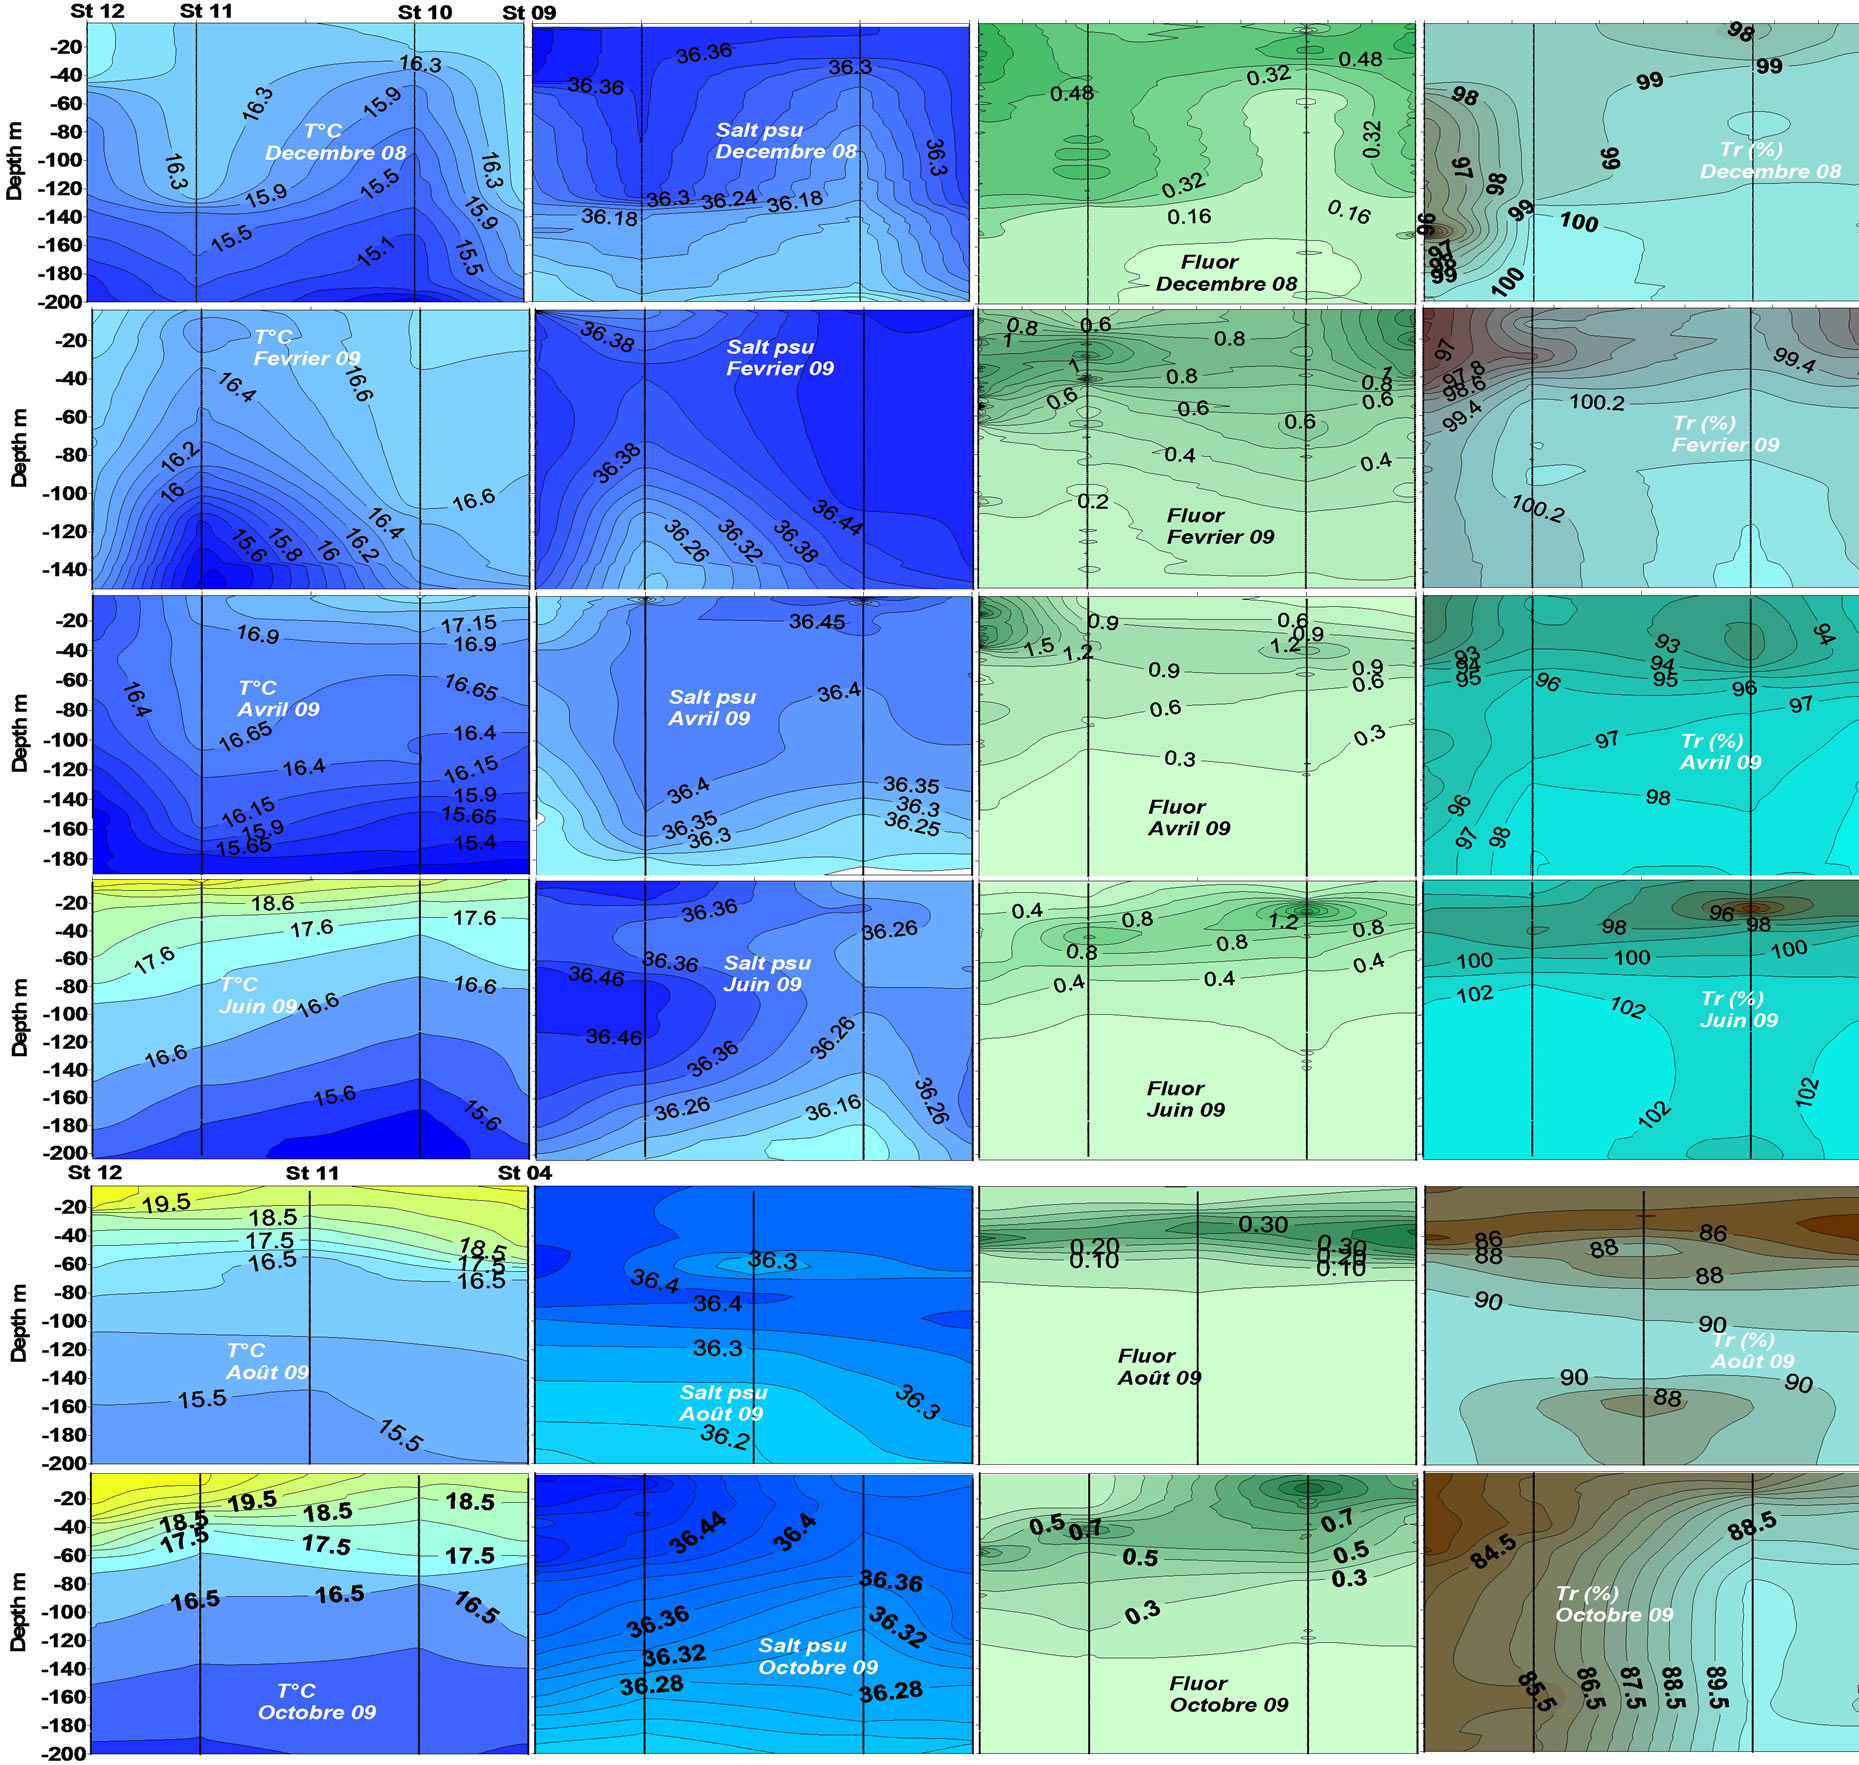
Figure 6. Physical parameters distribution along the longitudinal transact 10˚20"W (from December 2008 to October 2009).
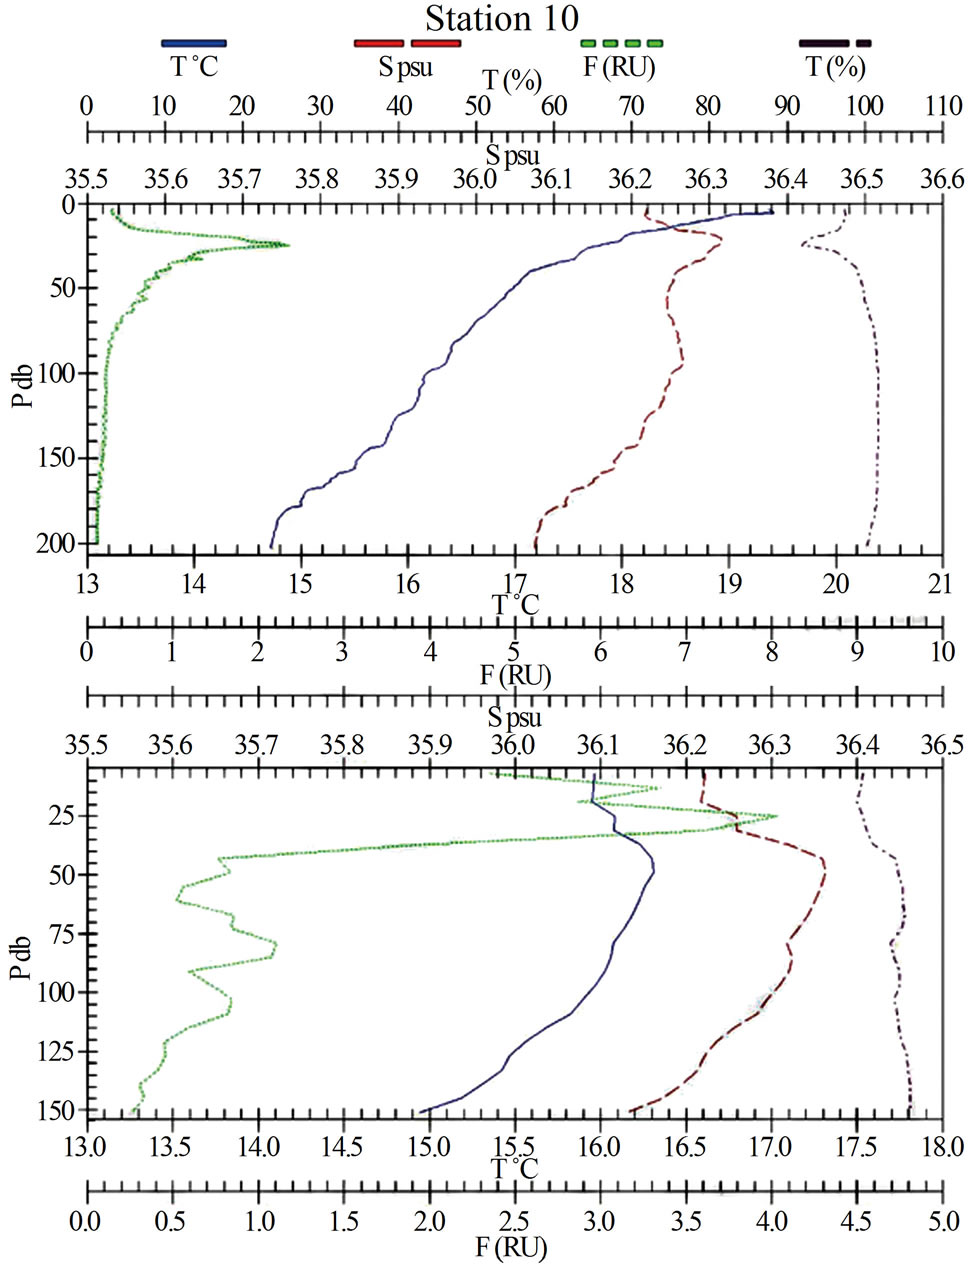
Figure 7. CTD Profile in station 10 (April 2009) and station 12 (Jun 2009).
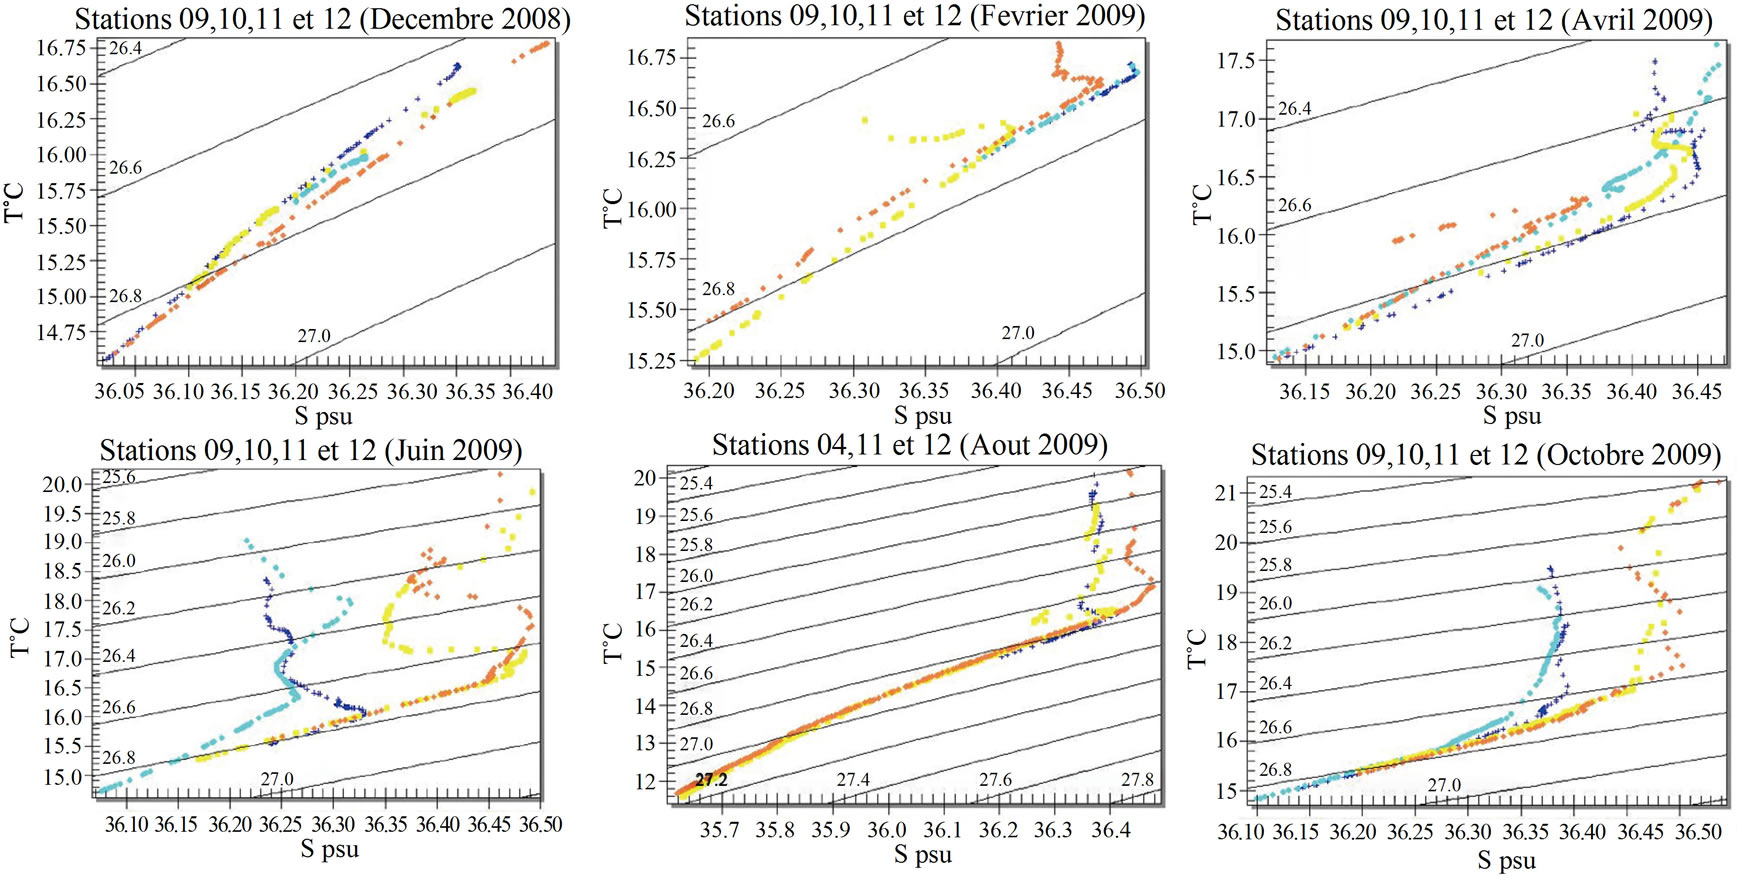
Figure 8.TS Diagram along Longitudinal transact (Dec 08 to Oct 09).
+ st 09, ● st 10, ■ st 11, ♦ st 12
4.3. Filament Impact on the Nutrients Distribution
In north of Cape Blanc, the upwelling water is typically NACW (North Atlantic Central Water) [15]. Several authors [17] reported relatively high rates of the nutrients in the area of the filament. These nutrient concentrations decrease in the direction of the filament and become exhausted at its end because of their participation in photosynthetic reaction known as the biological pump. This situation translates an opposite distribution for the chlorophyll.
However, [17] suggest that the regeneration of the exported organic matter causes an indirect export of the nutrient towards the ocean offshore. And consequently, high rates in nutrient regenerated can appear at the coast by the circulation of the organic matter towards the coast. Thus, the phosphates and the urea are mainly regenerated by the fish populations. Where as ammonia is favoured as well as by fish and zooplanctons [18].
During the period of our study, we recorded a dissolved oxygen saturation of all the water column. The distribution of nutrient along the two transact indicates a coherent variability with the activity of resurgences. In general, all the nutrients (Phosphates, Nitrates and ammonium) are supported by resurgences and follow the drift of the filament perfectly. They present rather important coastal concentrations in the active center of upwelling and in stations 9 and 10 which undergo the impact of the filament during October and June (Figures 9 and 10). While from December to April, water relatively concentrated in nutrient is derived in the south in stations 11 and 12 (Figure 9) which present cool and less salted water for this period.
This situation is also visible on the satellite images which shows an important activity of the filament during a months of the intense upwelling activity of cap Ghir in particular during October 2009 and August (Figure 11). This activity appears by the distribution of a spot of cool water and coastal between cape Cantin and cape Ghir. However, the dispersion of the filament towards off shore appears differently for the two periods. In August, the filament occurs more in the south at the limit of cape Ghir and tends to circulate according to a meander which derives towards north while following a channel far from the coast. Whereas in October, the filament takes a broader structure and disperses in several branches in different directions. That can explain only by the variability in space and time of the circulation of surface water and by the current velocity which is variable from 18 to 80 cm/s [7]. Thus, in autumn, the coastal circulation of the current towards the south is slowed down against current toward north which occurs at this time between Canary Islands and Morocco [8] and supports that structure of the filament between cape Ghir and cap Sim in autumn. Whereas in August, during the absence of this current coming from the south [8] the filament appears by a more restricted structure and limits itself at the cape Ghir.
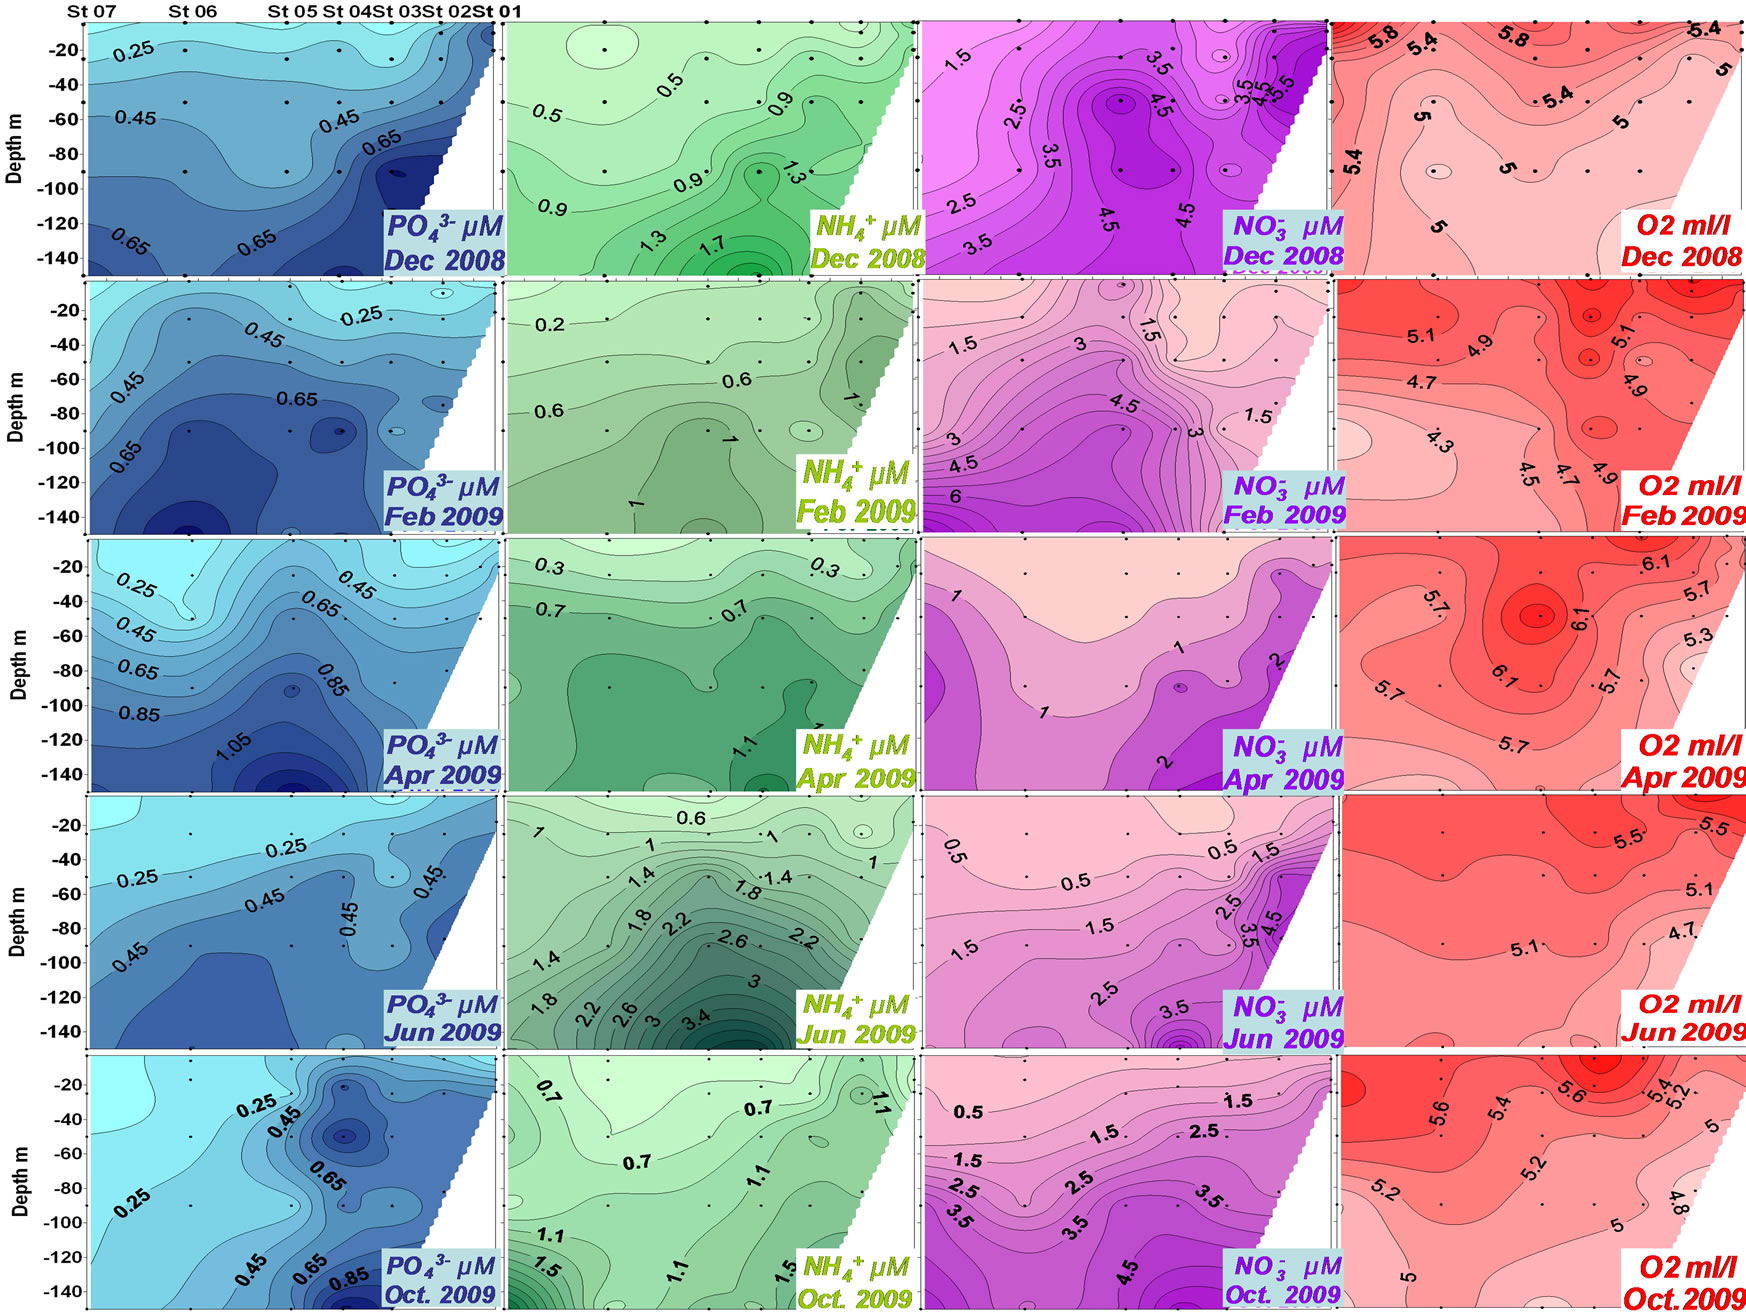
Figure 9. Nutrients and dissolved oxygen distributions along the transact 31˚N (from December 08 to October 09).
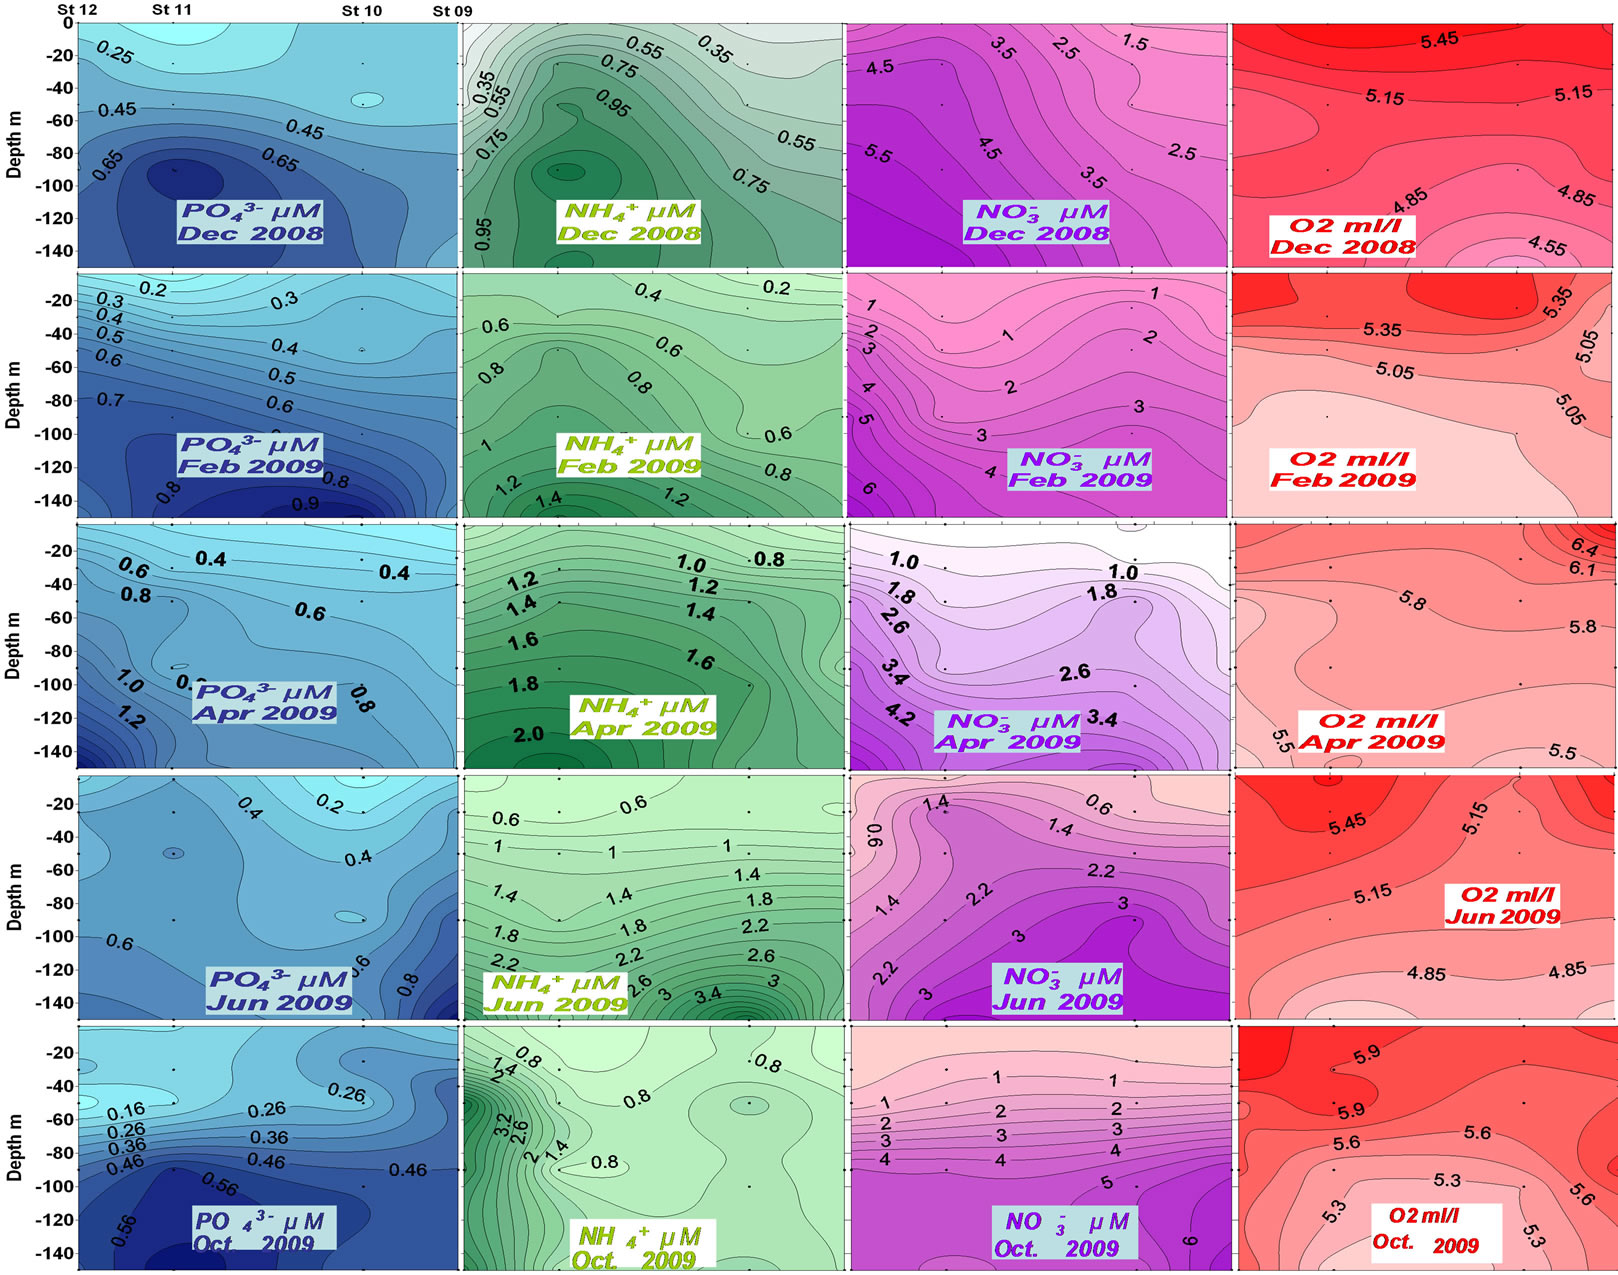
Figure 10. Nutrients and dissolved oxygen distribution along the transact 10˚20"W (from December 08 to October 09).
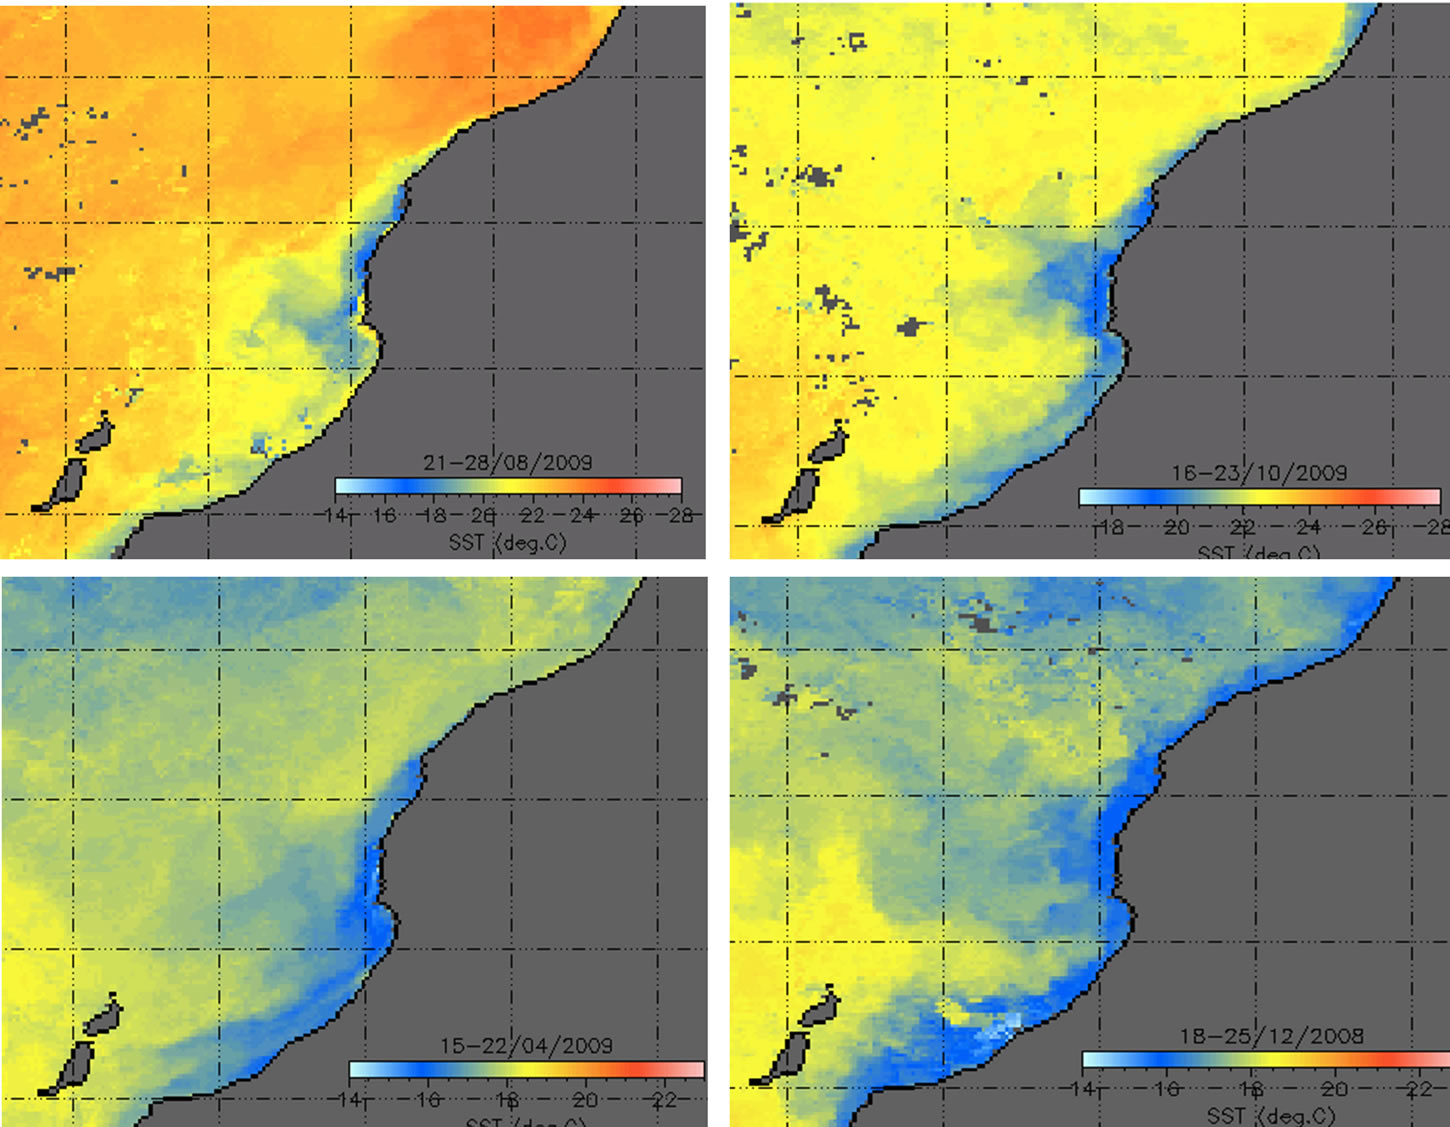
Figure 11. SST satellite images in: 21-28/08 2009 (above left), 16-23/10/2009 (above vright), 15-22/04/2009 (below left) and 18-25/12/2008 (below right). The color temperature code is shown in a horizontal scale at the bottom of the images (units in ˚C).
5. CONCLUSIONS
The activity of resurgences of cape Ghir appears from April, intensifies during August and June and still persists in October of the year 2009.
The filament of cape Ghir is characterized by a spatial and temporal variability relating to circulation of the water masses of the zone and current velocity of canaries current. During the season of summer and autumn, the filamentous structure is marked by the presence of an activity of important resurgences.
In August, the filament is restricted on one branch and appears in limited area of cape Ghir in the south of 31˚N transact. Whereas in autumn, it has a wide structure in several branches and affects all the zone ranging between cape Ghir and cape Cantin. While during April and February, the filament seems to be absent because the cold temperatures and low salinities are limited to the coast and do not seem to be the origin of upwelled water of this zone.
During June, the situation is similar to October. The upwelling is active and the filament is marked as well on the 31˚N transact as in the north of it.
REFERENCES
- Brink, K.H. (1983) The near surface dynamics of coastal upwelling. Progress in Oceanography, 12, 223-257. doi:10.1016/0079-6611(83)90009-5
- Flament, P., Armi, L. and Washburn, L. (1985) The evolving structure of an upwelling lament. Journal of Geophysical Research, 90, 11765-11778. doi:10.1029/JC090iC06p11765
- Nykjvr, L., Van Camp, L. and Schlittenhardt, P. (1988) The structure and variability of a lament in the Northwest African upwelling area as observed from AVHRR and CZCS images. Proceedings of IGARSS 88 Symposium, Edinburgh, 1097-1100.
- Nykjvr, L. and Van Camp, L. (1989) Remote sensing of the Northwest African Upwelling Area. Analysis and interpretation of simultaneous pairs of GAC derived sea surface temperature and CZCS derived chlorophyll-like pigment concentration images. Unimar Sciences ApS, 1, 74.
- Van Camp, L., Nykjvr, L., Mittelstaedt, E. and Schlittenhardt, P. (1991) Upwelling and boundary circulation o! Northwest Africa as depicted by infrared and visible satellite observations. Progress in Oceanography, 26, 357- 402. doi:10.1016/0079-6611(91)90012-B
- Hagen, E., ZuK licke, C. and Feistel, R. (1996) Nearsurface structures in the Cape Ghir lament o! Morocco. Oceanologica Acta, 19, 577-598.
- Strub, P.T., Kosro, P.M. and Huyer, A. (1991) The nature of the cold laments in the California Current System. Journal of Geophysical Research, 96, 14743-14768. doi:10.1029/91JC01024
- Pelegri J.L., Aristegui, J., Cana, L., Gonzalez-Davila, L., Hernandez-Guerra, A., Hernandez-Leon, S., Marrero-Diaz, A., Montero, M.F., Sangra, P. and Santana-Casiano, M. (2005) Coupling between the open ocean and the coastal upwelling region off Northwest Africa: Water recirculation and offshore pumping of organic matter. Journal of Marine System, 54, pp. 3-37. doi:10.1016/j.jmarsys.2004.07.003
- Makaoui, A., Orbi, A., Hilmi, K., Zizah, S., Larissi, J. and Talbi, M. (2005) L’upwelling de la côte atlantique du Maroc entre 1994 et 1998. C. R. Geoscience, 337, pp. 1518-1524. doi:10.1016/j.crte.2005.08.013
- Mittelstaedt, E. (1991) The ocean boundary along the African coast. Circulation and oceanographic properties at the sea surface. Progress in Oceanography, 26, 307- 455. doi:10.1016/0079-6611(91)90011-A
- Hernandez-Guerra, A., Aristegui, J., Canton, M. and Nykjaer, L. (1993) Phytoplankton pigments patterns in the Canary Islands as determined using Coastal Zone Colour Scanner Data. International Journal of Remote Sensing, 14, 1431-1437. doi:10.1080/01431169308953977
- Knoll, M., Hernandez-Guerra, A., Lenz, B., Lopez-Laatzen, F., Machın, F., Mqller, T.J. and Siedler, G. (2002) The eastern boundary current system between the Canary Islands and the African coast. Deep-Sea Research. Part 2, Topical Studies in Oceanography, 49, 3427-3440. doi:10.1016/S0967-0645(02)00105-4
- Ramp, S.R., Jessen, P.F., Brink, K.H., Niiler, P.P., Daggett, F.L. and Best, J.S. (1991) The physical structure of cold filaments near Point Arena, California, during June 1987. Journal of Geophysical Research, 96, 14859-14883. doi:10.1029/91JC01141
- Makaoui, A. (2008) Hydrological study of the moroccan coastal upwelling an dits contribution to the continental shelf sediment. National Thesis, Ben M’sik University, Casablanca.
- Barton, E.D., Aristegui, J., Tett, P., Canton, M., GarciaBraun, J., Hernandez-Leon, S., Nykjaer, L., Almeida, C., Almunia, J., Ballesteros, S., Basterretxea, G., Escanez, J., Garcia-Weil, L., Hernandez-Guerra, A., Lopez-Laatzen, F., Molina, R., Montero, M.F., Navarro-Pêrez, E., Rodriguez, J.M., Van Lenning, K., Vêlez, H. and Wild, K. (1998) The transition zone of the Canary Current upwelling region. Progress in Oceanography, 41, 455-504. doi:10.1016/S0079-6611(98)00023-8
- Machin F., Hernandez-Guerra, A. and Peleri, J.L. (2006) Mass fluxes in the Canary Basin. Progress in Oceanography, 70, 416-447. doi:10.1016/j.pocean.2006.03.019
- Minas, H.J., Codispoti, R.C. and Dugdale, R.C. (1982) Nutrients and primary production in the upwelling region off northwest Africa. Rapp. P-v Reun.- Cons. Int. Explor. Mer, 180, 148-183.
- Smith, S.L. and Whitledge, T.E. (1982) Regeneration of nutrients by zooplankton and fish off northwest Africa. Rapp. P-v Reun.- Cons. Int. Explor. Mer, 180, 206-208.