Health
Vol.5 No.8E(2013), Article ID:36063,6 pages DOI:10.4236/health.2013.58A5002
A neural network-based infection screening system that uses vital signs and percutaneous oxygen saturation for rapid screening of patients with influenza
![]()
1Graduate School of System Design, Tokyo Metropolitan University, Tokyo, Japan; *Corresponding Author: tmatsui@sd.tmu.ac.jp, sun-guanghao@sd.tmu.ac.jp
2Department of Internal Medicine, Japan Self-Defense Forces Central Hospital, Tokyo, Japan
3Takasaka Clinic, Fukushima, Japan
4Lifetech Co., Ltd., Saitama, Japan
Copyright © 2013 Guanghao Sun et al. This is an open access article distributed under the Creative Commons Attribution License, which permits unrestricted use, distribution, and reproduction in any medium, provided the original work is properly cited.
Received 25 May 2013; revised 25 June 2013; accepted 31 July 2013
Keywords: Screening; Infection; Influenza; Neural Network; Vital Signs; SpO2
ABSTRACT
Objective: Influenza is a highly infectious viral disease, which occurs epidemically almost every winter in Japan. Rapid screening of patients with suspected influenza in places of mass gathering is important to delay or prevent transmission of the infection. The aim of this study was to assess the effectiveness of our newly developed infection screening system that employed vital signs and percutaneous oxygen saturation (SpO2) as parameters in a clinical setting. Methods: Since SpO2 accurately reflects respiratory status during influenza virus infection, we upgraded our previous system by adding SpO2 as a new parameter to improve the screening accuracy. This system instantly measures SpO2 and vital signs (i.e., heart rate, respiration rate, and facial temperature), which automatically detects infected individuals via a neural network-based nonlinear discriminant function using these derived parameters. We tested the system on 45 patients with seasonal influenza (35.8˚C < body temperature < 40.0˚C, 18 - 35 years) and 64 normal control subjects (35.0˚C < body temperature < 37.5˚C, 18 - 30 years) at Japan Self-Defense Central Hospital in 2012. Results: The system identified 40/45 patients with influenza and 60/64 normal control subjects, and provided sensitivity, specificity, and positive and negative predictive value (PPV, NPV) of 88.8%, 93.8%, 90.9%, and 92.3%, respectively. By including SpO2 as a screening parameter, we achieved superior sensitivity and NPV compared to that reported in our previous paper (sensitivity = 88%; NPV = 82%). Conclusions: Our results suggest that SpO2 is a good screening parameter that improves the accuracy of infection screening. The proposed system has the potential to efficiently identify infected individuals, thereby delaying or preventing the spread of infection during epidemic seasons.
1. INTRODUCTION
Recently, the first human infection with the novel avian influenza A (H7N9) virus was reported in mainland China in March 2013 [1]. Influenza viruses, such as H7N9, can cause severe pneumonia or acute respiratory distress syndrome, which results in significant morbidity and mortality [2,3]. Rapid detection of influenza can prevent the transmission of the infection and reduce the risk of developing influenza-related complications. In order to conduct rapid screening of infected individuals at places of mass gathering during the time of prevalence of highly contagious infectious diseases such as an avian influenza, we have developed a neural network-based infection screening system to monitor infection-induced alterations of SpO2 and vital signs, i.e., heart rate, respiration rate, and facial temperature, using non-invasive biosensors.
After the severe acute respiratory syndrome outbreak in 2003, infrared thermography became a potential tool for detecting fever and has been widely used for screening at places of mass gathering such as airport quarantine offices and hospital outpatient units [4,5]. However, some studies indicate that fever-based screening during earlystage influenza is limited because many factors can affect thermographic measurements [6-8]. Therefore, to achieve screening that is more accurate, we have developed a system that monitors the heart and respiration rate as well as facial temperature, as described in our previous studies [9,10].
In this study, we included SpO2 as a screening parameter to improve the accuracy because SpO2 levels accurately reflect lung function during influenza virus infection [11]. Therefore, our screening system integrates multiple physiological parameters for rapid detection of influenza, which provides sensitivity that is superior to the fever-based screening system. We employed a neural network-based nonlinear discriminant function, which has been already reported in our previous paper [12]. This discriminant function allows for distinguishing of patients with influenza from normal control individuals using 4 physiological parameters: SpO2, heart rate, respiration rate, and facial temperature. In order to assess the performance of the system, we conducted the screening at the Japan Self-Defense Force Central Hospital during the winter season from 2011-2012.
2. MATERIALS AND METHODS
2.1. An Infection Screening System That Non-Invasively Measures Vital Signs and SpO2
We have upgraded our previous portable infection screening system by including a pulse oximeter module. The technical details have been reported in previous papers from the viewpoint of medical system engineering [13,14]. The biosensors consist of a thermography to monitor facial temperature (NIPPON AVIONICS, Thermo shot F30, Japan), a 10-GHz respiration radar to determine respiration rate (new JRC, NJR4175, Japan), and a pulse oximeter module to calculate the SpO2 and heart rate (NONIN Medical, OEM III, USA). A diagrammatic illustration of the system is shown in Figure 1.
The analog signal outputs from the biosensors are sent to a personal laptop computer for analysis and the observations are displayed in real time. The cardiac and respiratory curves and facial thermo image are shown on the laptop screen. Within several tens of seconds, the infection screening system displays the result calculated by a neural network-based discriminant function from the multiple physiological parameters. The light-emitting diode lights indicate the screening result: red indicates “POTENTIAL INFECTION” and green indicates
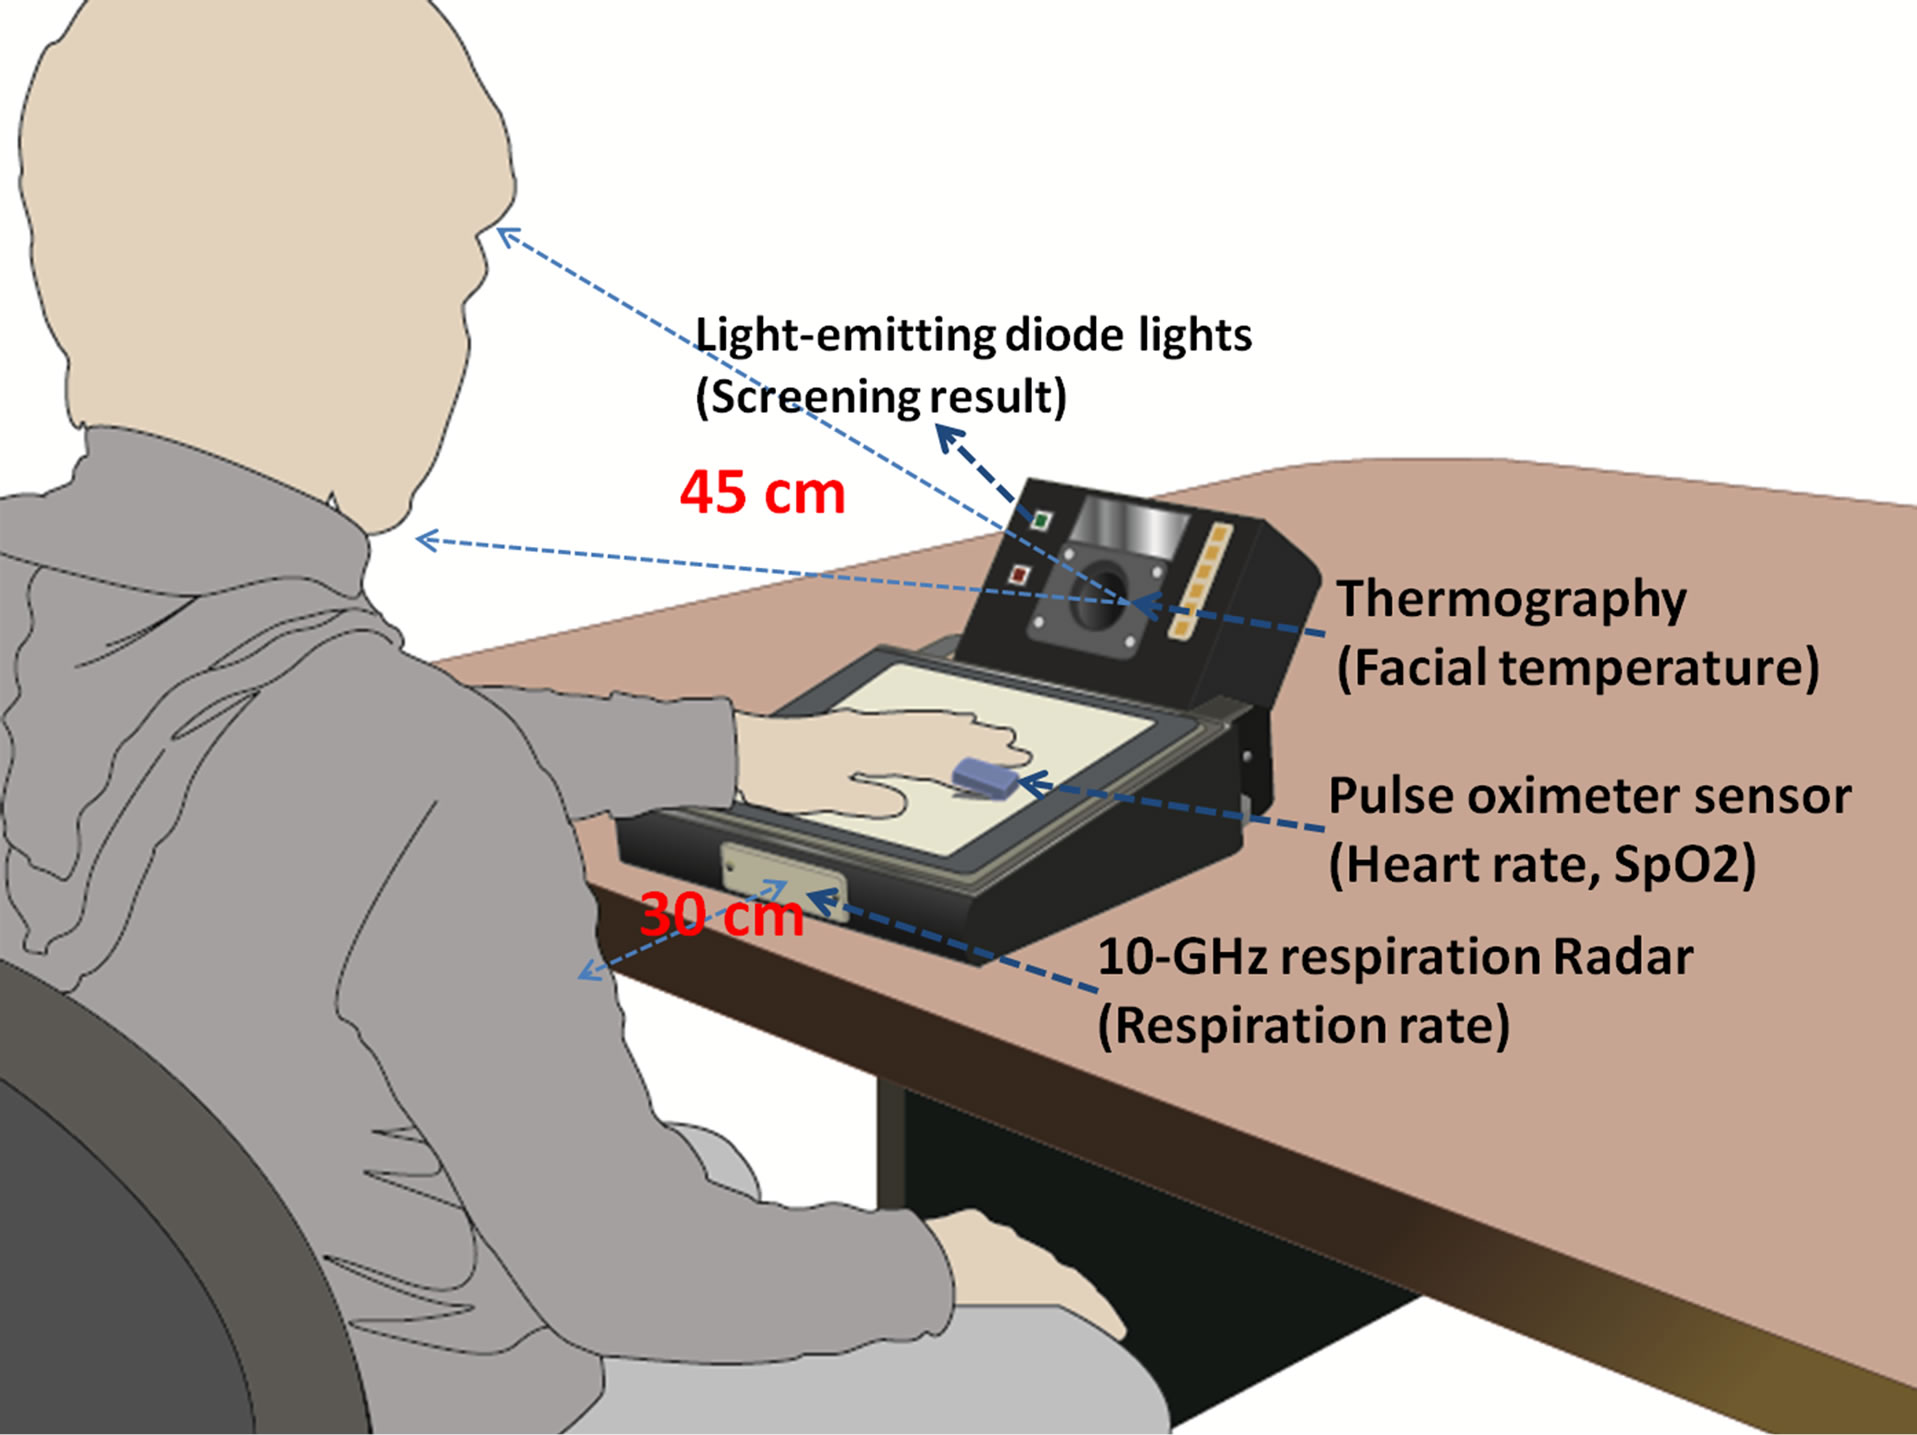
Figure 1. A diagrammatic illustration of the infection screening system. The thermography is placed 45 cm from the subject’s face, and the respiration radar is placed 30 cm from the subject’s chest.
“PASS” (Figure 1). The software environment was developed on LabVIEW (National Instruments, Austin, Texas, USA) and MATLAB (Mathworks, Natick, MA, USA).
2.2. Patients and Normal Control Subjects
The present study was carried out at Japan Self-Defense Force Central Hospital from January to February 2012. In total, 45 patients admitted for influenza-like illnesses were diagnosed with seasonal type A influenza using the QuickVue Rapid SP Influ test (Quidel Corp., USA) [15]. All patients were men and members of the self-defense forces (18 - 35 years). These patients were treated with oseltamivir or zanamivir, and their axillary temperatures averaged 36.7˚C ± 0.7˚C (35.8˚C < axillary temperature < 40.0˚C).
All the normal control subjects (n = 64) were male students from the baseball club at Tokyo Metropolitan University. These normal control subjects had no symptoms of fever, headache, or a sore throat. The average age of the subjects was 21 years (18 - 30 years), and their axillary temperatures averaged 36.5˚C ± 0.4˚C (35.0˚C < axillary temperature < 37.5˚C).
This study was approved by the Ethics Committee of Japan Self-Defense Forces Central Hospital and the Committee on Human Research of the Faculty of System Design, Tokyo Metropolitan University. Informed written consent was obtained from all the subjects.
2.3. A Neural Network-Based Non-Linear Discriminant Function to Distinguish Patients with Influenza from Normal Control Subjects
In our previous paper [12], we proposed a neural network-based discriminant method, i.e., Kohonen’s selforganizing map (SOM) [16] combined with a k-means clustering algorithm [17]. SOM has been widely used for classification of high-dimensional data on the basis of unsupervised learning. This feature makes SOM a suitable classifier to cluster the influenza group and normal group by using multiple vital signs and SpO2 data. The SOM clustering result is visualized on a 2-dimensional map by using the unified distance matrix (U-matrix). However, SOM classification is composed of various clusters, and it is therefore difficult to establish the optimal number of clusters. Hence, k-means clustering is used to obtain the final 2 clusters (“influenza group” and “normal control group”) over the SOM output.
The SOM combined with the k-means clustering method consists of 2 layers (input and output). First, the data for the 4 parameters (i.e., heart rate, respiration rate, facial temperature, and SpO2) from 109 subjects (45 patients with influenza and 64 normal control subjects) were used to create various SOM clusters on the input layer. In the second step, the k-means clustering algorithm was employed to reduce the SOM clusters to 2 clusters (“influenza group” and “normal control group”) on the output layer.
3. RESULTS
The results of screening by SOM with k-means discriminant analysis are shown in Figure 2. The SOM clus-
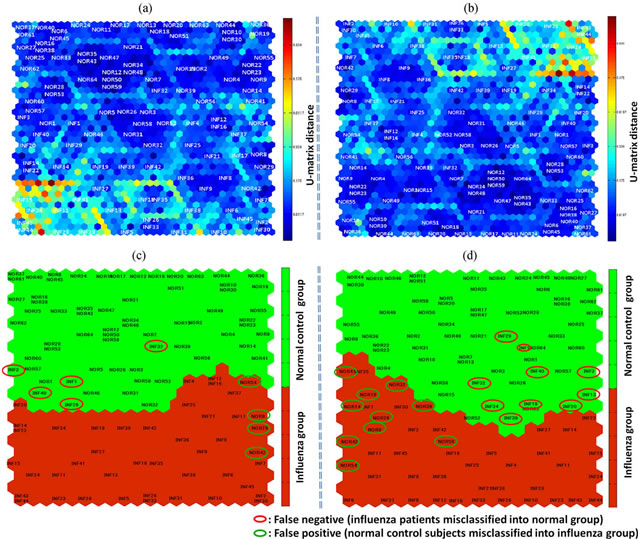
Figure 2. (a) and (b) The SOM clustering result is visualized on a 2-dimensional map using U-matrix. (c) The SOM map created from the data obtained from a total of 109 subjects on the basis of 4 parameters including SpO2. Influenza (INF1, INF2, …) and normal control subjects (NOR1, NOR2, …) tend to be classified under the red and the green clusters, respectively. Herein, 40/45 patients with influenza were included in the influenza group (red cluster), and 60/64 normal control subjects were included in the normal group (green cluster). Five patients with influenza (circled in red) were misdiagnosed as normal and 4 normal control subjects (circled in green) were misdiagnosed as infected. (d) The SOM map developed on the basis of the data from the same subjects, but by using only 3 parameters, excluding SpO2. Herein, 35/45 patients with influenza were included in the influenza group (red cluster), and 54/64 normal control subjects were included in the normal group (green cluster). Ten patients with influenza (circled in red) were misdiagnosed as normal and 10 normal control subjects (circled in green) were misdiagnosed as infected.
tering result is visualized on a 2-dimensional map using U-matrix, as shown in Figures 2(a) and (b). Various clusters can be found on the map according to color variation.
Figure 2(c) shows the screening results of SOM mapping of the data obtained from 109 subjects on the basis of the 4 parameters, i.e., facial temperature, respiration rate, heart rate, and SpO2. Influenza (INF1, INF2, …) and normal control subjects (NOR1, NOR2, …) were classified under the red and the green clusters, respectively. A total of 40 out of 45 patients with influenza were included in the influenza group (red cluster), and 60 out of 64 normal control subjects were included in the normal group (green cluster). Five patients with influenza (circled in red) were misdiagnosed as normal (false negative) and 4 normal control subjects (circled in green) were misdiagnosed as infected (false positive). Figure 2(d) shows the SOM mapping obtained from the data of the same subjects, but using only 3 parameters mentioned above, without SpO2. The figure shows that a total of 35 out of 45 patients with influenza were included in the influenza group (red cluster), and 54 out of 64 normal control subjects were included in the normal group (green cluster). Ten patients with influenza (circled in red) were misdiagnosed as normal (false negative) and 10 normal control subjects (circled in green) were misdiagnosed as infected (false positive).
We calculated the following diagnostic values: sensitivity, specificity, positive predictive value, and negative predictive value (NPV), to evaluate the screening accuracy of “with SpO2” and “without SpO2” cases (Table 1). The sensitivity and NPV are the most important indexes of mass screening. We found that by including SpO2 as a screening parameter, the sensitivity and NPV were improved to 88.8% and 92.3%, respectively.
Moreover, the classified data were compared within the influenza group and normal control group by the Student’s t-test. Statistical results are shown in Figure 3, the facial temperature, respiration and heart rates, and SpO2 were significantly different between the influenza group and normal control group (P < 0.05).
4. DISCUSSION AND CONCLUSION
Early detection of influenza in places of mass gathering becomes essential to prevent disease transmission
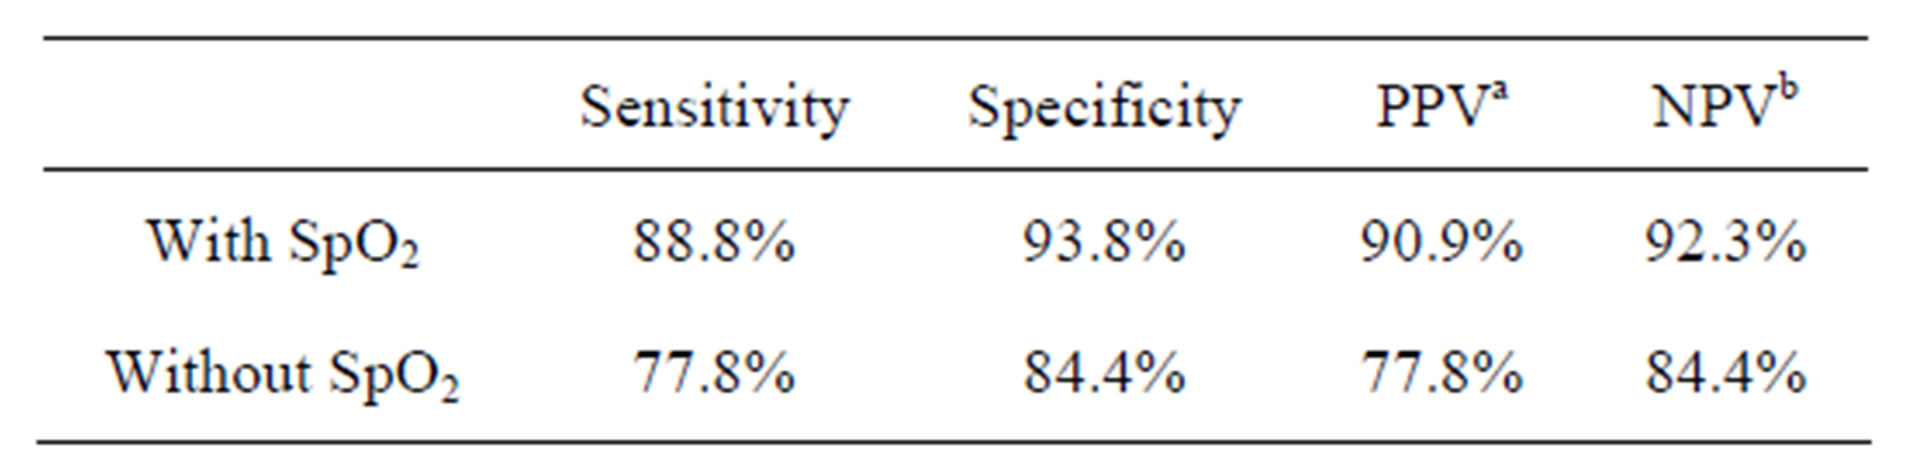
Table 1. Diagnostic values for the screening accuracy of “with SpO2” and “without SpO2” cases.
a. PPV: positive predictive value; b. NPV: negative predictive value.
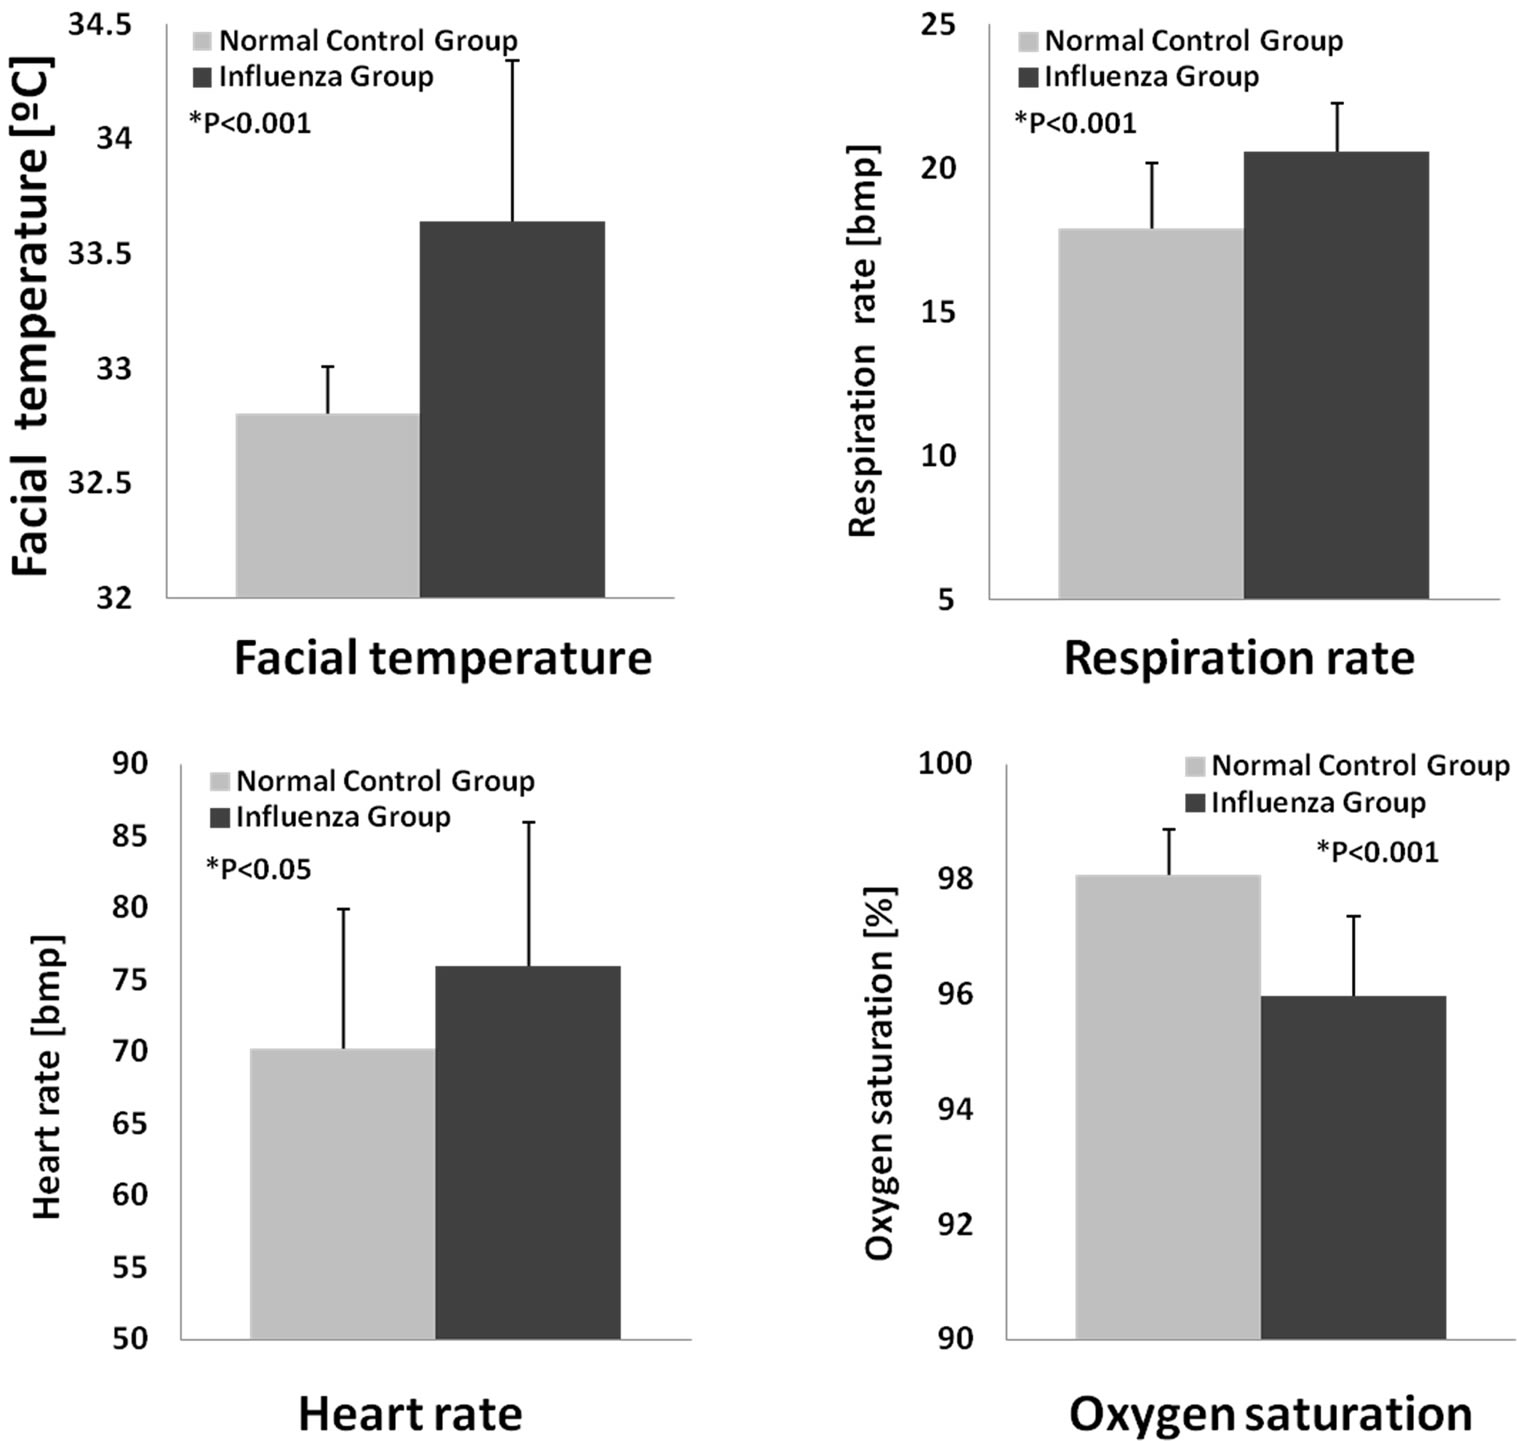
Figure 3. The classified data were compared within the influenza and normal control group.
during epidemic seasons [18]. Our infection screeningsystem integrates multiple physiological parameters for rapid and reliable detection of influenza. By adding these parameters, our system can detect infected individuals even if they were under antifebrile medications and with normal body temperature.
There are 2 important points to be mentioned in this study. (1) We have applied SpO2 as a screening parameter because it provides a rapid, non-invasive, and effective assessment of lung function at all stages of influenza infection. Moreover, during the H1N1 outbreak in 2009, the World Health Organization recommended that, if possible, the respiratory rate should be recorded for over a minute with simultaneous analysis of oxygen saturation [19]. As expected, by including SpO2 to the test, the sensitivity and NPV were significantly improved compared to cases analyzed without SpO2 monitoring. Our results suggest that SpO2 is a good screening parameter that improves the accuracy of infection screening. (2) The study sample was restricted to individuals of a small age group, male gender, and a certain degree of physical fitness. In order to conduct a large-scale data collection, we hope to test this system in South-East Asian countries with a high risk of infectious diseases, such as Vietnam.
In summary, this rapid and sensitive screening system could potentially allow for delay or prevention of infectious disease transmission and enable safeguarding of public health. Furthermore, this system automatically detects infected individuals and is able to reduce the risk of secondary exposure of health care workers to infectious agents.
5. ACKNOWLEDGEMENTS
This research was supported by the Tokyo Metropolitan Government Asian Human Resources Fund and the Japan Society for the Promotion of Science (JSPS) Research Fellowships for Young Scientists. We are grateful to the nurses at Japan Self-Defense Force Central Hospital for their assistance with this study. We would also like to thank Ms. Saeko Nozawa for her immense help with drafting this manuscript.
REFERENCES
- Chou, Gao, R., Cao, B., Hu, Y., Feng, Z., Wang, D., Hu, W. and Shu, Y. (2013) Human infection with a novel avianorigin influenza A (H7N9) virus. The New England Journal of Medicine, 368, 1888-1897. doi:10.1056/NEJMoa1304459
- Rello, J. and Pop-Vicas, A. (2009) Clinical review: Primary influenza viral pneumonia. Critical Care, 13, 235. doi:10.1186/cc8183
- Wentworth, D.E., Thompson, B.L., Xu, X., Regnery, H. L., Cooley, A.J., McGregor, M.W. and Hinshaw, V.S. (1994) An influenza A (H1N1) virus, closely related to swine influenza virus, responsible for a fatal case of human influenza. Journal of Virology, 68, 2051-2058.
- Chiang, M.F., Lin, P.W., Lin, L.F., Chiou, H.Y., Chien, C. W., Chu, S.F. and Chiu, W.T. (2008) Mass screening of suspected febrile patients with remote-sensing infrared thermography: Alarm temperature and optimal distance. Journal of the Formosan Medical Association, 107, 937- 944. doi:10.1016/S0929-6646(09)60017-6
- Hay, A.D., Peters, T.J., Wilson, A. and Fahey, T. (2004) The use of infrared thermometry for the detection of fever. The British Journal of General Practice, 54, 448-450.
- Nishiura, H. and Kamiya, K. (2011) Fever screening during the influenza (H1N1-2009) pandemic at Narita International Airport, Japan. BMC Infectious Diseases, 11, 111. doi:10.1186/1471-2334-11-111
- Liu, C.C., Chang, R.E. and Chang, W.C. (2004) Limitations of forehead infrared body temperature detection for fever screening for severe acute respiratory syndrome. Infection Control and Hospital Epidemiology, 25, 1109- 1111. doi:10.1086/502351
- Chan, L. S., Cheung, G. T., Lauder, I. J., and Kumana, C. R. (2004) Screening for fever by remote-sensing infrared thermographic camera. J Travel Med, 11(5), 273-279. doi:10.2310/7060.2004.19102
- Matsui, T., Hakozaki, Y., Suzuki, S., Usui, T., Kato, T., Hasegawa, K. and Abe, S. (2010) A novel screening method for influenza patients using a newly developed noncontact screening system. Journal of Infection, 60, 271- 277. doi:10.1016/j.jinf.2010.01.005
- Matsui, T., Suzuki, S., Ujikawa, K., Usui, T., Gotoh, S., Sugamata, M. and Abe, S. (2009) The development of a non-contact screening system for rapid medical inspection at a quarantine depot using a laser Doppler bloodflow meter, microwave radar and infrared thermography. Journal of Medical Engineering & Technology, 33, 481- 487. doi:10.1080/03091900902952675
- Bewick, Thomas, B., Greenwood, S. and Lim, W.S. (2010) What is the role of pulse oximetry in the assessment of patients with community-acquired pneumonia in primary care? Primary Care Respiratory Journal, 19, 378-382. doi:10.4104/pcrj.2010.00049
- Sun, G., Hakozaki, Y., Abe, S., Vinh, N. Q. and Matsui, T. (2012) A novel infection screening method using a neural network and k-means clustering algorithm which can be applied for screening of unknown or unexpected infectious diseases. Journal of Infection, 65, 591-592. doi:10.1016/j.jinf.2012.10.010
- Sun, G., Abe, S., Takei, O. and Matsui, T. (2011) A portable screening system for onboard entry screening at international airports using a microwave radar, reflective photo sensor and thermography. Proceedings of the 2nd International Conference of ICICI-BME, Bandung, 8-9 November 2011, 107-110. doi:10.1109/ICICI-BME.2011.6108604
- Sun, G., Vinh, N.Q., Abe, S., Takei, O., Sugamata, M. and Matsui, T. (2013) A portable infection screening system designed for onboard entry screening based on multi-parameter vital signs. International Journal of E-Health and Medical Communications, in press.
- Hurt, A.C., Baas, C., Deng, Y.M., Roberts, S., Kelso, A. and Barr, I.G. (2009) Performance of influenza rapid pointof-care tests in the detection of swine lineage A(H1N1) influenza viruses. Influenza Other Respi Viruses, 3, 171- 176. doi:10.1111/j.1750-2659.2009.00086.x
- Kohonen, T. (1990) The self-organizing map. Proceedings of the IEEE, 78, 1464-1480. doi:10.1109/5.58325
- Macqueen, J. (1967) Some methods for classification and analysis of multivariate observations. Proceedings of the 5th Berkeley symposium on mathematical statistics and probability, Berkeley, 1, 281-297.
- Patricia, C., Priest, P.C., Jennings, L.C. Duncan, A.R., Brunton, C.R. and Baker, M.G. (2012) Effectiveness of Border Screening for Detecting Influenza in Arriving Airline Travelers. American Journal of Public Health, 103, 1412-1418. doi:10.2105/AJPH.2008.158071
- WHO Influenza A(H1N1) patient care checklist. http://www.who.int/csr/resources/publications/swineflu/ah1n1_checklist.pdf