Health
Vol.5 No.6A2(2013), Article ID:33155,3 pages DOI:10.4236/health.2013.56A2002
The effect of a wearable visual cue on patient satisfaction survey scores in the acute inpatient rehabilitation setting
![]()
Rehabilitation Institute of Michigan at the Detroit Medical Center, Wayne State University, Detroit, USA; apellicane@hotmail.com
Copyright © 2013 Anthony J. Pellicane. This is an open access article distributed under the Creative Commons Attribution License, which permits unrestricted use, distribution, and reproduction in any medium, provided the original work is properly cited.
Received 7 April 2013; revised 5 May 2013; accepted 30 May 2013
Keywords: Press Ganey; Patient Satisfaction; Satisfaction Scores
ABSTRACT
With a portion of healthcare reimbursement now dependent on the patient’s report of the hospital experience, healthcare systems are looking for ways to improve patient satisfaction scores. In this study, one inpatient physiatrist at an acute inpatient rehabilitation facility wore a button on the right lapel of his white coat at all times which read, “Ask ME about your TREATMENT and PROGRESS!!!” in order to determine if a wearable visual cue prompting the patient to discuss his or her treatment and progress alters Press Ganey Patient Satisfaction Survey (PGPSS) scores. Mean score on the physician-specific PGPSS question “How well the rehabilitation doctor kept you informed about your treatment and progress” was calculated retrospectively for five months before and after the physiatrist donned the button. Comparisons were made to two other inpatient physiatrists. For the button-wearing physiatrist, mean score for the physician-specific patient satisfaction survey question for the five months before donning the button was 88.1 ± 11.5; and, for the five months after donning the button, the mean score was 95.8 ± 5.9. These scores were marginally statistically different (p = 0.07). Conversely, the difference in mean scores over the same time periods for two other inpatient physiatrists who did not wear the button did not approach statistical significance. In conclusion, a wearable visual cue improved the PGPSS score specific to the question the visual cue addressed.
1. INTRODUCTION
The Center for Medicare and Medicaid Services has created an incentive fund for health care reimbursement based partly on patients’ report of the hospital experience [1]. With private payers likely to follow this model in the future [2], practitioners, hospitals, and hospital systems must adapt. As a result, improving the patient experience (as measured by patient satisfaction surveys) has become a focus of healthcare executives and has led to the development of creative ways to please patients in the hope of improving scores and revenue [3]. This study describes an attempt at developing a simple, inexpensive way to foster patient-physician interaction that would, in turn, better the patient’s subjective realization of the hospital experience and result in improved Press Ganey Patient Satisfaction Survey (PGPSS) scores.
2. PARTICIPANTS AND METHODS
2.1. Participants
Institutional Review Board approval was not needed given that this project was focused on quality improvement and used no private identifiable patient information. All patients who completed a PGPSS after acute inpatient rehabilitation at one freestanding rehabilitation hospital from December 2011 to October 2012 were studied retrospectively.
2.2. Measurement
Mean score for the physician-specific PGPSS question “How well the rehabilitation doctor kept you informed about your treatment and progress” was calculated from January 2012-May 2012 and from July 2012-November 2012 for three different inpatient physiatrists who work within the same group in the same hospital. Note, there is a delay in the reporting of the PGPSS scores. Thus, for example, survey results from a patient discharged in October 2012 would be included on the report for November 2012.
One of the physiatrists began wearing a square (two inches per side), blue button with white lettering that read, “Ask ME about your TREATMENT and PROGRESS!!!” on the right lapel of his white coat at all times on May 1, 2012 (Figure 1). Data from May 2012 (reported in June 2012) was excluded from analysis in order to minimize effect on the outcome measure. Data collection did not continue beyond those patients discharged in October 2012 because the study site opened a new patient care floor November 1, 2012 which was superior in many ways to existing floors. As survey scores for patients who received their care on this new floor may have been elevated, data collection stopped prior to its opening [3]. Phone surveys were used for all patients throughout the study period. This is important given that Elliott et al. found differences in patients’ assessments of hospital care based on mode of survey data collection [4] .
2.3. Statistical Analysis
Paired t-tests were used to compare PGPSS mean scores from January 2012-May 2012 to mean scores from July 2012-November 2012 for each of the three inpatient physiatrists.
3. RESULTS
A total of 81 surveys were completed during the specified time period (30 for the button-wearing physiatrist; 26 and 25 for the other two physiatrists). For the buttonwearing physiatrist, mean score for the physician-specific PGPSS question for the five months before donning the button was 88.1 ± 11.5 (20 surveys); and, for the five months after donning the button was 95.8 ± 5.9 (10 surveys). These scores were marginally statistically different (p = 0.07). Over the same time periods, the first nonbutton-wearing physiatrist’s scores were 79.9 ± 13.1 (19 surveys) and 80.0 ± 11.2 (7 surveys) (p = 0.99); and, the second’s scores were 95.0 ± 8.1 (14 surveys) and 82.8 ± 21.0 (11 surveys) (p = 0.27). All three physiatrists care for distinct patient populations; however, the buttonwearing physiatrist and the first non-button-wearing physiatrist work in the same areas of the rehabilitation hospital.
4. DISCUSSION
From happy hours on maternity wards where family members are offered chips and cookies to strict mandates regarding patient/visitor entry-to-greeting time to practitioner script development for patient interactions, hospitals are trying to win the patient satisfaction game in
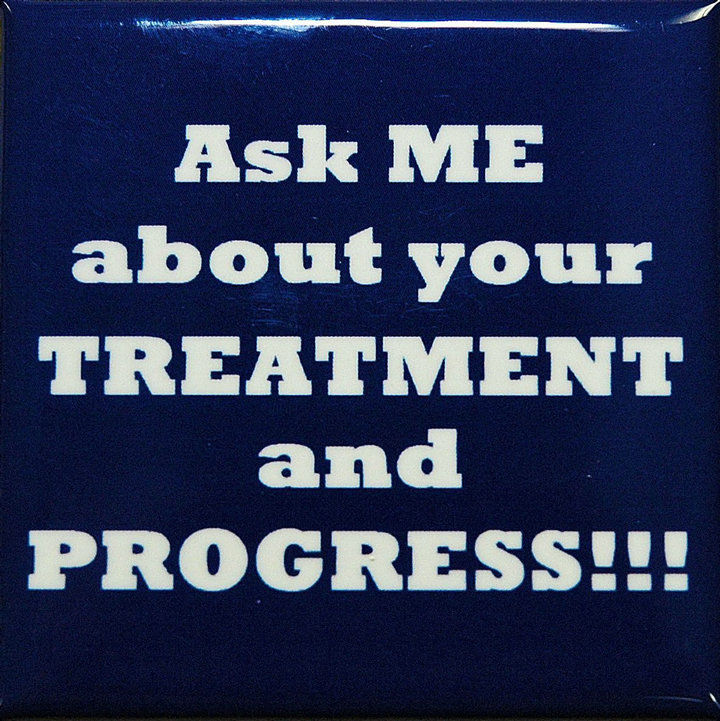
Figure 1. Photograph of button.
creative ways [3]. Even though some have postulated that efforts to cater to patient satisfaction may lead to health care overutilization [5,6] while others have reported that patient satisfaction surveys have undergone little peer-reviewed validation and do not account for patient biases [7], and still others debate if a patient even has the ability to objectively report on the patient experience [1], healthcare providers find themselves operating under the Hospital Value-Based Purchasing Program’s rules. The ethics and implications of attempting to manipulate patient satisfaction scores are obvious [1]; and, a wearable visual cue focused specifically on a patient satisfaction survey question is certainly open to criticism. However, with reimbursement contingent upon the report of the patient experience, it will be interesting to see how far healthcare executives and hospital systems are willing to go to make the grade. The study described here suggests that a visual cue prompting the patient (and perhaps the practitioner) to discuss patient treatment and progress improved the PGPSS score specific to the question the button addressed. Alternatively, one might argue that the visual reinforcement of the survey question alone may have led to the improvement in the score. Regardless of the cause, the improvement in the score is noteworthy and such a practice may be interesting to hospitals struggling to achieve acceptable marks on patient satisfaction.
5. LIMITATIONS
A small number of survey responses for each physiatrist were available for investigation during the study period, so the results should be interpreted cautiously and larger studies should be considered in an attempt to replicate these data. Additionally, this study did not account for demographic or other differences within the three physiatrists’ patient populations which may have impacted survey responses [8] .
6. CONCLUSION
A wearable visual cue improved the Press Ganey Patient Satisfaction Survey mean score specific to the question the visual cue addressed. While not quite reaching statistical significance, the improvement in the buttonwearing physiatrist’s score by 7.7 is impressive, particularly given that the other non-button-wearing physiatrists’ scores increased by only 0.1 and decreased by 12.2, respectively. As such, strategies similar to the one described here may be of interest to practitioners, hospitals, hospital systems, and healthcare executives.
REFERENCES
- Zamora, D. (2012) Using patient satisfaction as a basis for reimbursement: Political, financial, and philosophical implications. Creative Nursing, 18, 118-123. doi:10.1891/1078-4535.18.3.118
- Zusman, E.E. (2012) HCAHPS replaces Press Ganey survey as quality measure for patient hospital experience. Neurosurgery, 71, N21-N24. doi:10.1227/01.neu.0000417536.07871.ed
- Rau, J. (2011) Test for hospital budgets: Are the patients pleased? The New York Times. http://www.nytimes.com/2011/11/08/health/patients-grades-to-affect-hospitals-medicare-reimbursements.html?_r=0&pagewanted=print
- Elliott, M.N., et al. (2009) Effects of survey mode, patient mix, and nonresponse on CAHPS hospital survey scores. Health Services Research, 44, 501-518. doi:10.1111/j.1475-6773.2008.00914.x
- Fenton, J.J., et al. (2012) The cost of satisfaction: A national study of patient satisfaction, health care utilization, expenditures, and mortality. Archives of Internal Medicine, 172, 405-411. doi:10.1001/archinternmed.2011.1662
- Sirovich, B.E. (2012) How to feed and grow your health care system: comment on “The cost of satisfaction”. Archives of Internal Medicine, 172, 411-413. doi:10.1001/archinternmed.2012.62
- Daly, R. (2011) Unsatisfactory marks. Hospitals question use of HCAHPS in scoring for value-based purchasing. Modern Healthcare, 41, 30.
- Elliott, M.N., et al. (2010) Do hospitals rank differently on HCAHPS for different patient subgroups? Medical Care Research and Review, 67, 56-73. doi:10.1177/1077558709339066