Engineering
Vol.07 No.06(2015), Article ID:57297,14 pages
10.4236/eng.2015.76027
Mathematical Model for the Injector of a Common Rail Fuel-Injection System
Simon Marčič1, Milan Marčič2*, Zdravko Praunseis1
1Faculty of Energy Technology, University of Maribor, Maribor, Slovenia
2Faculty of Mechanical Engineering, University of Maribor, Maribor, Slovenia
Email: *milan.marcic@uni-mb.si
Copyright © 2015 by authors and Scientific Research Publishing Inc.
This work is licensed under the Creative Commons Attribution International License (CC BY).
http://creativecommons.org/licenses/by/4.0/


Received 11 May 2015; accepted 20 June 2015; published 23 June 2015
ABSTRACT
The paper describes a Diesel fuel injection process. Computer simulation was carried out together with measurement of the Common Rail accumulator fuel-injection system. The computer simulation enables the observation of the phenomena from rail pressure, being the input data for injection parameters calculations, to the injection rate. By means of computer simulation, the pressure values in specific sections of the injection nozzle may be computed, the needle lift, injection rate, total injected fuel, time lag from injector current to first evidence of injection process and other time-lags between various phases of the injection process. The injection rate provides input data for spray computer simulation. Measurements of injection and combustion were carried out within a transparent research engine. This engine is a single-cylinder transparent engine based on the AUDI V6 engine, equipped with a Bosch Common Rail Injection System. The comparison between the computed and measured injection parameters showed good matching.
Keywords:
Diesel Engine, Fuel Injection System

1. Introduction
Diesel engines are primarily used in heavy- and medium-duty transport due to their high thermal efficiency whilst in over recent decades they have also been increasingly used in passenger cars. This trend is particularly strong in Europe. Designers are faced with more and more challenging tasks due to increasing requirements for lower fuel consumption and reduced pollution of the environment. Combustion is one of the most important processes, influencing lower consumption and reduced pollution of the environment by diesel engines. In contrast to Otto engines, where the ignition of the petrol vapour-air mixture is effected by a spark, in diesel engines, the mixture is self ignited. In order to obtain efficient combustion, which is a pre-condition for low consumption and reduced pollution of the environment, it is very important to understand the fuel injection process.
One of the key elements affecting the combustion process is the fuel injection system where the injection nozzle plays a decisive role in dispersing the fuel in the droplet-fuel vapour-air mixture within the combustion chamber. Therefore we have developed a computer simulation of the common rail accumulator fuel-injection system. This computer program enables computation of the injection parameters from the electric current at the triggering element (solenoid valve) to the injection rate.
The fuel injection of a transparent engine is carried out by a common rail injection system (Figure 1). The input data for the injection parameter computation is the pressure in a high-pressure accumulator (rail) (Figure 6), electric current at the triggering element (solenoid valve) and combustion pressure (Figure 5). By means of computer simulation, the pressure values in specific sections of the injection nozzle may be computed, the needle lift, injection rate, total injected fuel, time-lag from injector current to initial evidence of injection process and other time-lags between various phases of injection process. The injection rate provides input data for spray computer simulation which is not shown in the paper.
The injection and combustion parameter measurements were made within an optically accessible transparent engine. This engine is a single-cylinder transparent engine based on the AUDI V6 engine, equipped with a Bosch Common Rail Injection system. The injection system can deliver pressures of up to 1400 bars. The comparison between the computed and the measured fuel injection parameters, showed good agreement.
2. Mathematical Model of the Common Rail Injector Fuel-Injection System
Nowadays the highly efficient Diesel engines for passenger cars are usually equipped with the Common Rail accumulator fuel-injection system (Figure 1), which enables high pressure injection up to 2000 bars. High pressure injection means better spray formation and lower mean droplet diameter. The Common Rail system is a modular system, and the following components are essentially responsible for the injection characteristic:
1) Solenoid-valve-controlled injectors that are screwed into the cylinder head.
2) Pressure accumulator (rail).
3) High-pressure pump.
1 Air-mass meter, 2 ECU, 3 High-pressure pump, 4 High-pressure accumulator (rail), 5 Injectors,
6 Crankshaft-speed sensor, 7 Coolant-temperature sensor, 8 Fuel filter, 9 Accelerator-pedal sensor.

Figure 1. Common rail accumulator fuel-injection.
The following components are also required in order to operate the system:
1) Electronic control unit.
2) Crankshaft-speed sensor.
3) Camshaft-speed sensor.
This paper presents a mathematical model of the nozzle of a solenoid-valve-controlled injector. Figure 2 shows the solenoid-valve-controlled injector and nozzle schema. The input data for the injection parameter computation includes pressure at the inlet of the injector (Figure 6), the solenoid-valve pick-up current, and combustion pressure (Figure 5). They were all measured. The assumption made during computation was that the rail pressure at the inlet of the injector (point 4, Figure 2) and pressure pII at the inlet of the nozzle are identical (cross section II-II, Figure 2). The injection starts when the solenoid valve 3 is energised with the pick-up current which serves to ensure that the injector opens quickly. The force Fcr (Equation (6)) exerted by the triggered solenoid 3 now exceeds that of the valve spring and the armature opens the bleed orifice. When the bleed orifice 6 opens, fuel can flow from the valve-control chamber 8 into the cavity situated above it, and from there

Figure 2. Solenoid valve controlled injector and nozzle schema.
via the fuel return 1 to the fuel tank. This leads to the pressure in the valve-control chamber 8 being lower than that in the nozzle’s chamber volume V2, which is still at the same pressure level as the rail. The reduced pressure in the valve-control chamber 8 causes a reduction in the force exerted on the control plunger 9, the nozzle needle opens as a result, and the injection starts. The force of the pressure on the needle of nozzle 11 in the nozzle’s chamber volume V2 has to overcome also the spring force F0 of the nozzle.
It is possible from pressure pII to calculate the velocity wII of the fuel by equations [1] -[3]
 . (1)
. (1)
The continuity equation for space V2 is
 . (2)
. (2)
When calculating pressure p and velocity w of the fuel, we apply the Allevi theory [1] . It can be assumed that the fluid only flows one way―in the direction of the pipe―because of the small diameter of the nozzle channel compared to its length. All frictional losses of fluid in the nozzle channel are neglected, because the nozzle channel is relatively short. The equations depicting the velocity and pressure at any point between cross sections III and IV are
 (3)
(3)
The two equations are solved by this particular solution:
 (4)
(4)
Using these general solutions we can calculate the pressure and the velocity at any point between cross-sec- tion III and IV within the nozzle channel. The continuity equation of the volume V3 is
 (5)
(5)
The equation showing the dynamics of the needle (Figure 3) is
 (6)
(6)

Figure 3. Dynamics model of needle movement.
where Ftr stands for the friction between the needle and the nozzle body, F0 for the initial spring tension and Fcr for the solenoid force.
The boundary conditions for calculating the needle lift hi are:

Damping coefficients d, spring rates k and areas A are explained in Figure 3.
The continuity equation of volume V4 is
 (7)
(7)
During the injection procedure the pressure reaches 150 MPa, therefore the density, bulk elastic modulus Edin and kinematic viscosity of the fuel depend on pressure (Figure 4). Having good fluid property models over a wide range of pressures is therefore essential for accurate modelling. Figure 4 gives an overview of the important fluid properties [4] .

Figure 4. Density, bulk elastic module and viscosity of fluid depending on pressure and temperature.
Assumptions within a physical model:
1) Equations dealing with fluid ignore the fluid inertia.
2) Effective flow areas  and
and  (Figure 2) were measured at steady flow as well as steady pressure i.e. in rather more ideal conditions compared to those prevailing during fuel injection.
3. Computer Simulation
All data concerning nozzles, as obtained partly from technical documentation and partly by measuring, are stored in the data base so as to ensure an easily accessible source of information available at anytime. The programs required for simulating common rail and diesel spray can be put together by combining different programs for simulation of fuel injection system. We have developed computer simulation for various classical and common rail injection systems [5] [6] , therefore various combinations of programs can be used concerning injection system-spray. Combination of programs depends on the engine equipment.
The mathematical model of the nozzle is solved numerically according to the Runge-Kutta method of the fourth order, by means of the changeable integration step. The integration step changes during the operation depending on the initial step of the integration, as well as on permissible errors and factual errors of integration. As soon as the factual error exceeds the permissible error the step is halved. The program allows tenfold halving of the integration step. In those cases processed during our investigation the error did not exceed a pressure of 0.1 bar when the timing prescribed for the initial step of integration ranged between 10 and 20 μsec. (0.06 - 0.12 of crank angle degree at 1000 r.p.m.).
The input data for the injection parameter and spray computation is the pressure within a high-pressure accumulator (rail) (Figure 6), electric current at triggering element (solenoid valve) and combustion pressure (Fig- ure 5). These data were measured and stored in the computer memory via an analogous digital converter. The programs ran on a PC or on ALPHA DS 20 computer.
4. Comparison between Measured and Calculated Values
This chapter contains the results of the fuel injection system measurements within an optically accessible engine and the comparison between the computed and measured parameters. All measurements were carried out within an single-cylinder transparent engine based on the AUDI V6 engine, equipped with a Bosch Common Rail Injection System [7] [8] . We used a BOSCH DLLA 6 HD 360 6-holes mini-sac-hole nozzle with a flow value μ = 0.77.
A Micro-Epsilon eddy current needle lift sensor type U05 measured the needle lift. The rail pressure was measured by a Kistler 7061 quartz pressure transducer. All the measured parameters shown in Figures from 5 to 15 represent the average value of the 100 measurements.
The injection process was simulated at 1500 rpm of the engine, prail = 800 bar and 1400 bar and various engine loads. We also varied the cylinder pressure pz during compression stroke, into which a fuel was injected. Input data for computer simulation of the injection process were injector current, rail and cylinder pressures. Figure 5 shows the cylinder pressure and electric current at the solenoid valve. We simulated and measured a two-stage injection process at compression stroke pressure 55 bars and 1 bar. In the last case connection rod, piston, and valves were removed. The test stand pressure into which the fuel was injected is 1 bar. The purpose of testing was to establish the influence of cylinder pressure on injection parameters. Figure 6 shows the rail pressure and pressure pIV that was higher 22 bars for cylinder pressure pz = 55 bars, than for pressure pz = 1 bar. The consequence of cylinder pressure during the injection process was 0.01 mm greater for upper-needle seat deformation (Figure 7). This greater cylinder pressure had no effect on the pre-injection and only a slight effect on the shape of the main injection rate (Figure 8). The calculated injected amounts for the fuel were 0.994 mm3 for pre-injection and 13.8 mm3 for main injection. The measured pre-injection was 1 mm3 and the main injection 13 mm3 (Figure 9). The calculations and measurements were carried out at a cylinder pressure 55 bars. In regard to cylinder pressure 1 bar pre-injected calculated and measured amounts of fuel (Figure 9) was practically the same as for 55 bar. The compression pressure had a negligible effect on the pre-injection. The calculated main injected amount of fuel was 13.9 mm3 and measured 13.7 mm3.
The next measurements and calculations were carried out at a rail pressure of 1400 bar (Figures 10-13). Figure 10 shows the rail and pIV pressures that were 10 bars higher for cylinder pressure 55 bars than for 1 bar. The upper needle seat deformation was 0.01 mm higher for cylinder pressure 50 bars than for 1 bar (Figure 11). The cylinder pressure had no influence on the lower needle seat deformation. The lower needle seat deformation was 0.02 mm for rail pressure at 1400 bars being 0.015 mm more than for rail pressure of 800 bars. The same as for rail pressure 800 bars, the cylinder pressure had no influence on pre-injection and only a little influence on the shape of main injection for rail pressure 1400 bars (Figure 12). The measured and calculated pre-injected amount of fuel was 1.4 mm3 for cylinder pressure 50 and 1 bar. The calculated main injected amount of fuel was 16.8 mm3 and measured 17 mm3 for cylinder pressure 55 bars. For cylinder pressure of 1bar, the calculated main injected amount of fuel was 17 mm3 and measured 17.3 mm3.
Figures 14-17 show the calculated and measured injected parameters at part load, full load, and overload of the engine. The rail pressure was 1400 bar. The calculated and measured injection times were the same at part, full and overload of the engine (Figure 15). The measured needle lift was higher 0.007 mm than the calculated one at part load, 0.006 mm at full load and 0.01 mm at overload. The calculated and measured amount of pre-injected fuel was 1.4 mm3 for all loads (Figure 17). The calculated main-injected amount of the fuel was 11 mm3 and the measured amount 11.5 mm3 at part load, calculated at 16.7 mm3 and measured at 17 mm3 at full load. At overload the calculated amount of fuel was 23.6 mm3 and measured 24.5 mm3.
Figure 6, Figure 10 and Figure 14 show that pressure pIV is much lower for pre-injection than for main-in- jection because the injection rate for pre-injection was approximately twelve times smaller than for the main- injection. Low pressure pIV meant a greater Sauter diameter of fuel droplets and worse fuel distribution. The

Figure 5. Cylinder pressure and injector current at 1500 rpm and rail pressure 800 bar.
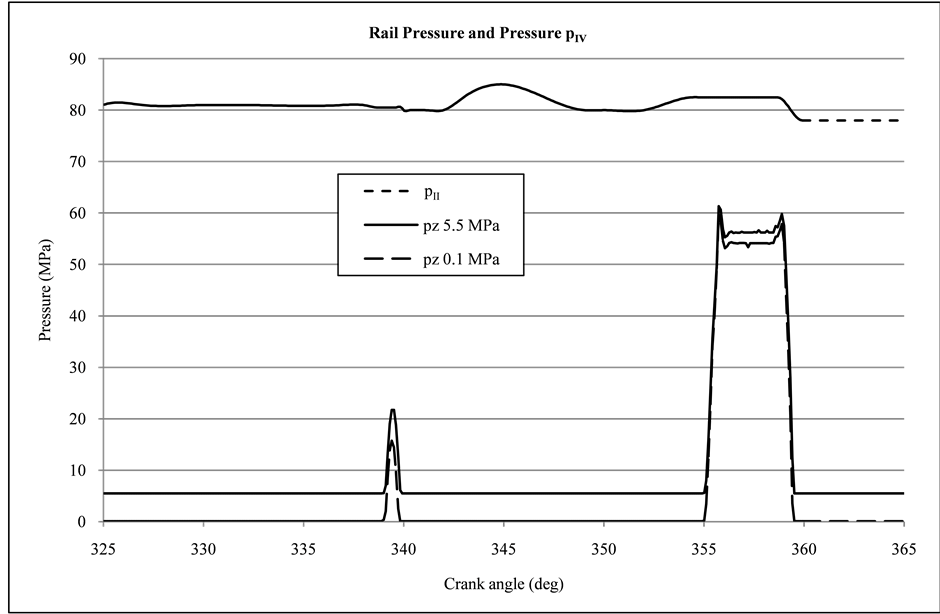
Figure 6. Measured rail pressure and calculated pressure pIV at rail pressure 800 bars.

Figure 7. Needle lift at rail pressure 800 bars.

Figure 8. Injection rate at rail pressure 800 bars.

Figure 9. Total injected fuel at rail pressure 800 bars.

Figure 10. Measured rail pressure and calculated pressure pIV at rail pressure 1400 bars.

Figure 11. Needle lift at rail pressure 1400 bars.

Figure 12. Injection rate at rail pressure 1400 bars.

Figure 13. Total injected fuel at rail pressure 1400 bars.

Figure 14. Measured rail pressure and calculated pressure pIV at rail pressure 1400 bars, part, full, and overload.

Figure 15. Needle lift at rail pressure 1400 bars, part, full, and overload.

Figure 16. Injection rate at rail pressure 1400 bars, part, full, and overload.

Figure 17. Total injected fuel at rail pressure 1400 bars, part, full, and overload.
pressure pIV was from 250 to 400 bars lower than the rail pressure due to friction losses within the nozzle channels. Measurement of pressure pIV in the sac volume was very demanding. Computer simulation, in that case, enabled in-depth view of the injection process. The congruity between the calculated and measured injection parameters was excellent.
The injection rate (Figure 8) time-lag behind the injector current (Figure 5) was 4.58˚ for pre-injection and 4.52˚ for the main injection.
The ignition laged behind theinjection rate (Figure 8) is 7.85˚ of crank shaft. The ignition beginning is shown as a rapid rise of cylinder pressure (Figure 5). The ignition (Figure 5) delay behind injection rate indicates if the fuel cetan number is correctly selected.
5. Summary
This paper described computer simulation of the Common Rail accumulator fuel-injection system. The injection system simulation results constituted the input data for the spray calculation [9] , which was absent from this paper. Both programs were structurally separated thus allowing their utilisations for various injection systems and the spray program.
The input data for the injection system simulation was comprised of the injector current, and the combustion and rail pressures. The computer simulation allowed calculations of the following injection parameters:
1) Pressure pIV in the sac volume.
2) Acceleration, velocity and lift of the needle.
3) Injection rate.
4) Total amount of injected fuel.
5) Time-lags between various fuel injection phases.
The experiments were carried out within a single-cylinder transparent engine, based on the AUDI V6 TDI engine. The engine is equipped with a BOSCH Common Rail injection system and a 6-hole mini-sac-hole nozzle.
The highest discrepancy between the calculated (23.6 mm3) and measured (24.5 mm3) main-injected amounts of the fuel was 0.9 mm3 at overload of the injection system (Figure 17). The comparison between the calculated and measured injection parameters showed excellent agreement.
The impacts of various structural elements of the injection system during injection process can be very quickly assessed through computer simulation, thus resulting in much extensive experiments.
References
- Allevi, L. (1909) Algemeine Theorie über der veränderliche Bewegung das Wasser in Leitungen. Springer Verlag, Berlin. http://dx.doi.org/10.1007/978-3-642-52015-0
- Rothrock, A.M. (1936) Hydraulics of Fuel Injection Pump for Compression-Ignition Engines. NACA Report No. 396.
- Schley, W. (1967) Theoretische und experimentelle Untersuchungen zur analytischen Darstellung der Wellendämp- fungen von hydraulischen Einspritzsystemen. Diss. München.
- Rodrigues-Anton, et al. (2008) Volumetric Properties at High Pressure of Waste Oil Methylester Compared with Diesel Oil. Fuel, 87, 1934-1940.
- Marčič, M. and Kovačič, Z. (1985) Computer Simulation of the Diesel Fuel Injection System. SAE 851583.
- Marcic, M. (1995) Calculation of the Diesel Fuel Injection Parameters, SAE 952071.
- Fettes, C., Schraml, S., Heimgärtner, C. and Leipertz, A. (2000) Analysis of the Combustion Process in a Transparent Passenger Car DI-Diesel Engine by Means of Multi-Dimensional Optical Measurements Techniques, SAE 2000-01- 2860.
- Fettes, C. and Leipertz, A. (2001) Potentials of a Piezo-Driven Passenger Car Common Rail System to Meet Future Emission Legislations―An Evaluation by Means of In-Cylinder Analysis of Injection and Combustion, SAE 2001-01- 3499.
- Marčič, M., Avsec, J., Wensing, M., Schmidt, M., Leipertz, A. and Fettes, C. (2010) Calculation and Measurements of Self-Ignition Nuclei in Diesel Combustion. Energy & Fuels, 24, 811-820.
Nomenclature
a velocity of sound
Aa area of the lower nozzle passage
Ac area of the feed passage to the nozzle
Ai area of the upper nozzle passage
As area of the needle seat
Dl area of the nozzle hole
Da lower needle diameter
Dc diameter of the feed passage to the nozzle
Di upper needle diameter
Dl nozzle hole diameter
Ds needle seat diameter
d needle motion viscous damping coefficient
d1 upper needle seat damping coefficient
d2 lower needle seat damping coefficient
Edin bulk modulus of fuel elasticity
Fcr solenoid force
Ftr friction force between needle and nozzle body
F0 initial spring tension for needle
hi needle lift
k spring rate for nozzle valve spring
k1 spring rate for upper nozzle valve seat
k2 spring rate for lower nozzle valve seat
L length of the lower nozzle passage
mi needle mass
n number of nozzle hole
pII, pIII, pIV pressures at various cross-sections of the nozzle
pz cylinder pressure
t time
V2, V3 volumes at various sections of the nozzle
V4 sac volume
X length
WII, WIII, WIV velocities of fuel at various cross-section of the nozzle
µlAl effective flow area of the nozzle hole
µsAs effective flow area of the nozzle seat
ρ fuel density
NOTES

*Corresponding author.