Engineering
Vol.6 No.5(2014), Article ID:44275,13 pages DOI:10.4236/eng.2014.65026
Rheological Properties of Cement-Based Grouts Determined by Different Techniques
Mohammed Hatem Mohammed1,2*, Roland Pusch1, Sven Knutsson1, Gunnar Hellström3
1Department of Civil, Environmental and Natural Resources Engineering, Luleå University of Technology, Luleå Sweden
2Department of Civil Engineering, University of Mosul, Mosul, Iraq
3Department of Engineering Science and Mathematics, Luleå University of Technology, Luleå, Sweden
Email: *mohammed.hatem@ltu.se
Copyright © 2014 by authors and Scientific Research Publishing Inc.
This work is licensed under the Creative Commons Attribution International License (CC BY).
http://creativecommons.org/licenses/by/4.0/


Received 7 February 2014; revised 7 March 2014; accepted 14 March 2014
ABSTRACT
The rheological properties of cement-based grouts containing talc or palygorskite were investigated for optimizing fluidity and quick strengthening at injection. The fluidity controls the ability of grout to penetrate fractures and can be determined by pipe flow tests, Marsh funnel tests, mini-slump cone tests and rheometer tests. The grouts were 1) Talc for fluidity and strength by reacting with cement, 2) Palygorskite (attapulgite) for early gelation by being thixotropic, and 3) Powdered quartz for chemical integrity. The freshly prepared grouts behaved as Bingham fluids with viscosities from 0.151 to 0.464 Pas and yield stresses 5.2 Pa to 36.7 Pa. Statistical analysis of the flow test data converted Marsh flow time into viscosity. The pipe flow tests gave 26.5% higher values than the viscometer for grout with Portland cement and talc, and about 13.7% lower than the viscometer data for the grout with low-pH cement and talc. The big Marsh funnel gave values differing by 5.2% - 5.3% from those of the viscometer for grout with talc and Portland, and Merit 5000 cements. For grout with palygorskite the viscosity was at least twice that of the other grouts. Grout fluidity was positively affected by talc and negatively by palygorskite and early cement hydration.
Keywords:Cement-Grout; Marsh Funnel; Quartz Powder; Rheological Properties; Thixotropic

1. Introduction
1.1. Background
The rheology of cement-based grout is characterized by viscoplastic behaviour and a yield stress [1] (Figure 1). Injectability, stability (homogeneity and coherence) of the suspension, and rate of maturation are the main properties of freshly prepared grouts [2] -[4] . The stress/strain/time properties of dense cement pastes have been thoroughly investigated by cement and concrete manufacturers and various research institutes and universities through the years while only little work on the rheology of cement-based grouts for fracture sealing in rock has been reported in the literature. The reason is that the properties are transient and dependent on physical interaction of the various constituents and mutual chemical reactions, starting already in the course of the preparation and injection of grouts in rock fractures and continuing in the injected grout [5] . For achieving effective injectability and acceptable performance of the just injected grout it must be low-viscous and erosion-resistant, because that the fine materials in suspension coagulate very easily due to inter-particle interactions.
A number of attempts for finding simple but accurate ways of determining the viscosity of Newtonian and non-Newtonian (Bingham) fluids have been made by Pitt [6] , Nguyen [1] and Roy and Roussel investigation of the possibility of using the Marsh funnel—a standard tool for investigating grouts [7] [8] . The technique is to fill a cone of defined dimensions with freshly prepared grout to a certain height and measure the time for discharge (Figure 2).
These investigators showed that the time for outflow that is proportional to the (Newtonian) viscosity can be
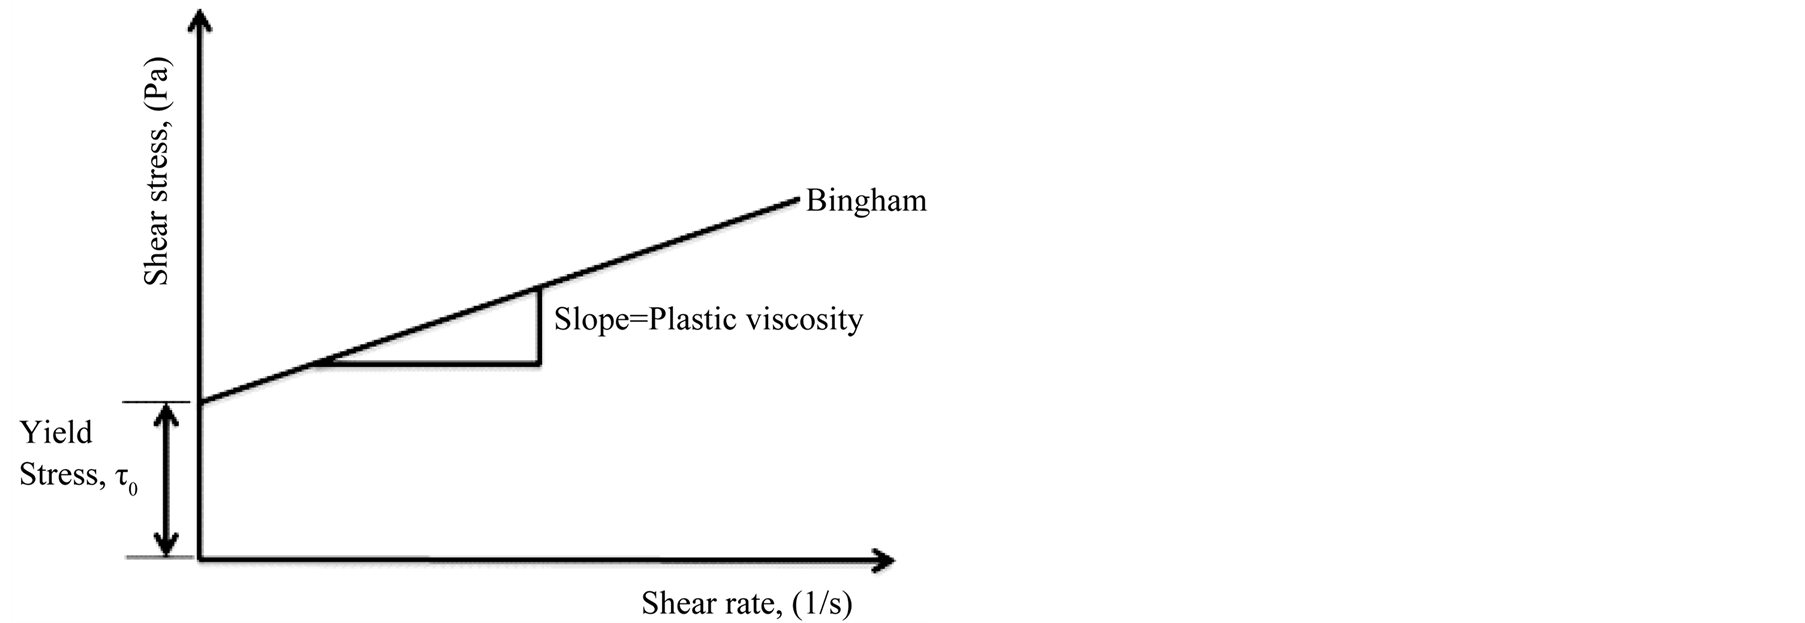
Figure 1. Yield stress and plastic viscosity.
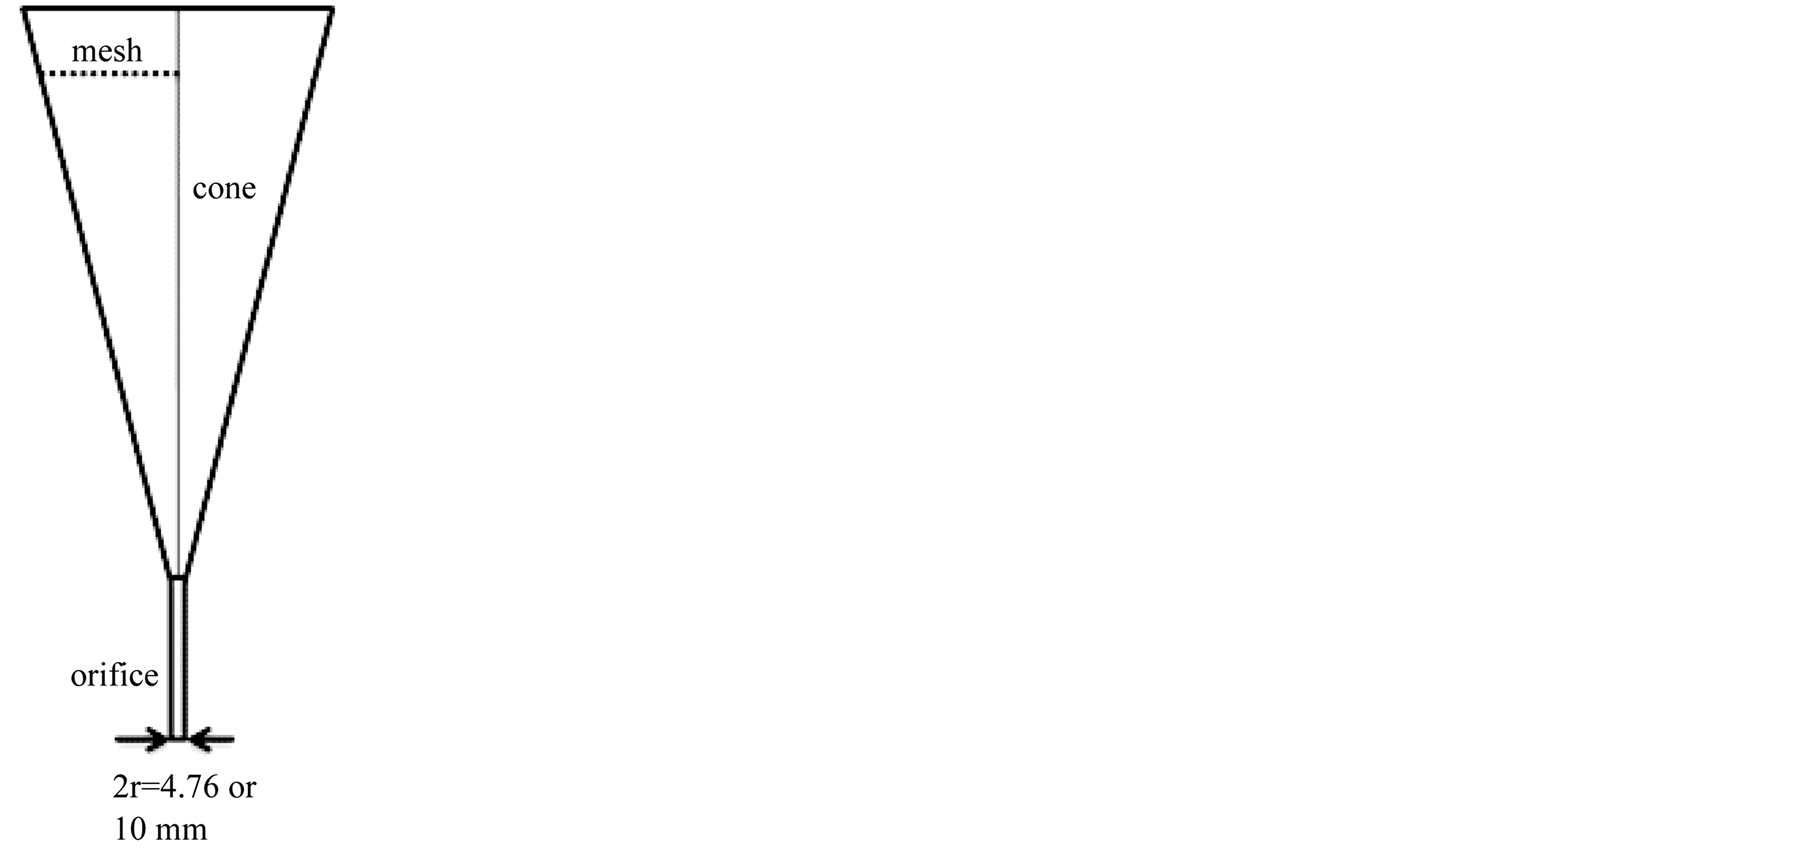
Figure 2. Marsh funnel technique.
directly linked to the Newtonian viscosity and flow time for cement pastes with no yield stress cement pastes and flow time longer than about 15 sec. They also showed that for certain funnel geometries and test conditions the flow time is the measure of “fluidity” that can be related to the plastic viscosity and yield stress of grouts behaving as Bingham fluids (Figure 3) [8] .
Further work on the use of cones and funnels by Tregger et al. [9] demonstrated a simple relationship between the time to final spread in the mini-slump flow test and the yield stress/viscosity for cement pastes, and by Bouvet et al. [10] who used both mini-slump and Marsh funnel tests. In the present study use of a new technique, capillary flow, is described and assessed parallel to other techniques like “mini-slump cone”, Marsh funnels and rheometric measurements. The grouts tested represent materials that are known to give practically important strength after maturation for different periods of time. Theoretical models are worked out for linking flow time measurements of Bingham grout mixes with material behaviour parameters such as yield stress and plastic viscosity. A method using two cones differing only by their nozzles as well as a pipette is presented. These methods can allow determination of these parameters.
1.2. Practical Methods of Evaluating Rheological Parameters
The fluidity of cement-based grout or paste can be described in terms of viscosity and yield stress. They are commonly determined by use of viscometers. The purpose of the present study was to develop an alternative method for use on site in conjunction with full-scale grouting projects. For this purpose capillary flow test, Marsh funnel tests, mini-slump cone test and viscometer tests were used, with focus being on describing and defining the flow properties of the tested grouts with correlation of the flow time and the rheological behaviour [6] -[9] [11] -[17] . It deserves to be mentioned that geometrical constraints and fracture coatings in real fractures to be grouted play a major role and require introduction of empirical correction factors, but this is left out here. The ability of grout to pass obstructions in the flow path without the grains clogging and preventing further penetration, which is called “filtration tendency”, is affected significantly by the size and distribution of grains [18] . A generally accepted rule is that the maximum grain size shall be 50% of the fracture aperture.
1.3. Scope
Three recipes of candidate grouts have been used in the present study. They represent materials advanced from systematic studies for defining materials that are sufficient fluid for different fracture aperture categories and sufficiently strong after maturation to withstand common water pressures. Talc replaces organic superplasticizers, which are not long-lasting, and it gives considerable strength by reacting with low-pH cement. The clay mineral palygorskite (attapulgite) as accessory component can provide quick strengthening by thixotropy [19] -[21] . Such grouts are candidates for further testing on laboratory and bench-scales and in real rock sealing projects.
1.4. Basic
A fundamental requirement for bringing grout deep into rock fractures or leaks in earthen dams is that it must be very finegrained and be effectively forced into them. Two types of cement were used in this study, Portland

Figure 3. Newtonian and Bingham behaviour of grouts.
cement and Merit 5000 low-pH cement, the latter for sealing rock containing boreholes with interacting seals of concrete and clay [11] . Long-lasting grouts require chemical integrity, which is provided by selecting quartzite as aggregate. Crushed quartzite has a very high internal friction angle and gives the grouts a high shear strength. The grain size distribution of the quarzite has to be selected such that minimum porosity is achieved, following the basic principles of packing theory and adapted to the geometrical properties of the rock fractures.
2. Experiments
2.1. Materials
2.1.1. Cement
Portland cement delivered by Cementa AB, Heidelberg cement group, Sweden, and Merit 5000 cement, manufactured by SSAB Merox AB, Oxelösund were used in the study. Table 1 shows the physical and chemical characteristics of the cements.
2.1.2. Constitution
1) Aggregate
The need for chemical integrity led to the choice of quartz powder for the major aggregate component. This powder, termed Norquartz 45, was delivered by the Sibelco Nordic, Lillesand, Norway. The granulometry and chemical compositions are shown in Table 2.

Table 1. Chemical and physical characteristics of portland and merit 5000 cement.
Table 2. Norquartz 45 properties.
2) Talc
Finely milled talc manufactured by VWR International Company UK, which used as superplasticizer and conditioner. It has the chemical composition 3MgO∙4SiO2∙H2O and is hydrophobic and serves as lubricator. In contrast to clay minerals it does not form gels. The grain size distribution is shown in Figure 4.
3) Clay Additive
Palygorskite (attapulgite) delivered by the Greek enterprise Geohellas Co, Athens, was used in order to increase early gelation of cementitious material because of its thixotropic properties. Once forced into rock fractures or channels in soil it stiffens and serves as a filter that prevents fine particles to migrate through it and further out. Due to its high hydrophilic potential it binds much water, which reduces its strength at achievable densities. The chemical formula is (Mg,Al) 2Si4O10(OH)4(H2O).
2.2. Composition
Three candidate grouts termed Grt1, Grt2 and Grt3 were prepared with Portland and Merit 5000 cement and the compositions shown in Table 3. The mix proportions of solid contents were equal for all of them except for the water content, which was selected to give approximately the same fluidity.
2.3. Preparation of Grouts
The procedure was to mix and agitate the air-dry components (cement, mineral additives and fine aggregate) for one minute using a Hobart-type mixer with rotation rate (60 rpm). Distilled water was added and the grout mixed for another 4 minutes to reach a fluid state and produce a homogenous component Figure 5. Minor differences in temperature (i.e. 0.2˚C - 0.6˚C) were found between the grouts.
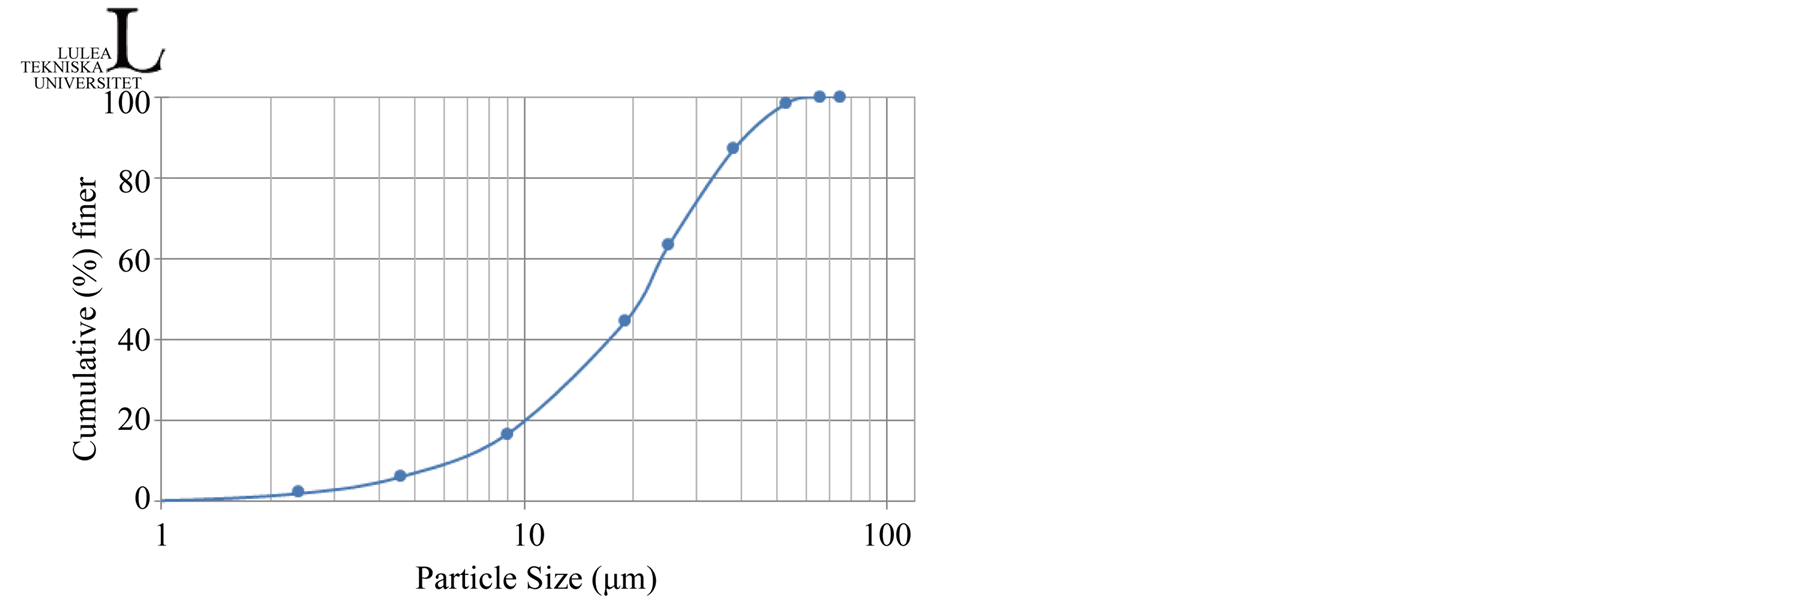
Figure 4. Talc grain size distribution.
Table 3. Grouts candidate proportions and status description.


Figure 5. Grout mixture preparations with the degree of fluidity being illustrated by the right figure.
2.4. Experimental
2.4.1. Techniques
Viscos-meter testing was taken as a reference in the study and Marsh funnel tests, slump tests and pipe-flow tests conducted for comparison.
1) Viscometer
Figure 6 shows the device used; a Visco Star-L rheometer with a coaxial immersion cylinder manufactured by JP Selecta S.A., Spain. The rotation speed can be varied from (0.3 - 200 rpm). The resistance of the fluid to the movement as measured in the test gives the viscosity.
2) Marsh Funnel
Two plastic Marsh funnels were used in this study, with brass orifices, provided by Form+Test GmbH, Germany (Figure 7), [22] . This test is a method to determine the time required for a fixed volume of grout to pass through the funnel. For the tests performed in this study, nozzle openings (“orifice”) of 4.76 and 10 mm were used. Calibration by use of distilled water at 20.6˚C has given through-flow in 26 seconds for small funnel [6] and 5.6 sec for the one with 10 mm opening. Documents EN 445 [23] and ASTM 939 94a [24] [25] describe the test procedure.
The technique involves poring of the freshly prepared grout into a cone attached to a stand (cf. Figure 7) with the nozzle closed, the recommended amount of grout being in the interval (0.8 to 1.7 L). The time needed for the sample to flow out of the funnel was measured, which defines the Marsh funnel flow time in seconds. The material volume flowing through the nozzle as a function of time is recorded [7] .
Two test procedures followed in this study:
• The first one was, filling of the marsh funnels with a 4.76 and 10 mm nozzle diameter with grout respectively. The time for outflow of a volume of 0.95 liter was measured.
• While the second procedure was to fill each funnel with 0.8 liter volume of grout, then the time for passing 0.4 liter grout volume was measured.
3) Slumping
This method makes use of cone that is filled with grout and momentarily lifted for letting the grout flow out on a horizontally oriented glass plate (Figure 8). The diameter of the grout pile is measured for characterizing the fluidity. The technique is not very accurate but gives information on the relative fluidity for quick calibration in the field of the dosage of superplasticizer.
4) Pipette
This technique is novel and used in pilot tests of talc-based grout [11] [26] . A glass tube with an inside diameter of 3.3 mm is filled with grout to one meter height with the valve being closed at the bottom (Figure 9). For the measurement, the valve is opened and the grout allowed to flow down by 10 cm while measuring the time. The viscosity is evaluated by use of Poiseuille’s law [11] [26] , the flow rate being the cross section area of the tube multiplied by the flow length 10 cm, divided by the flow time.
3. Results
3.1. Grout Fluidity
The penetrability of grout in fractures is determined by the fracture aperture and effective injection of grouts into

Figure 6. Rotary viscometer device.
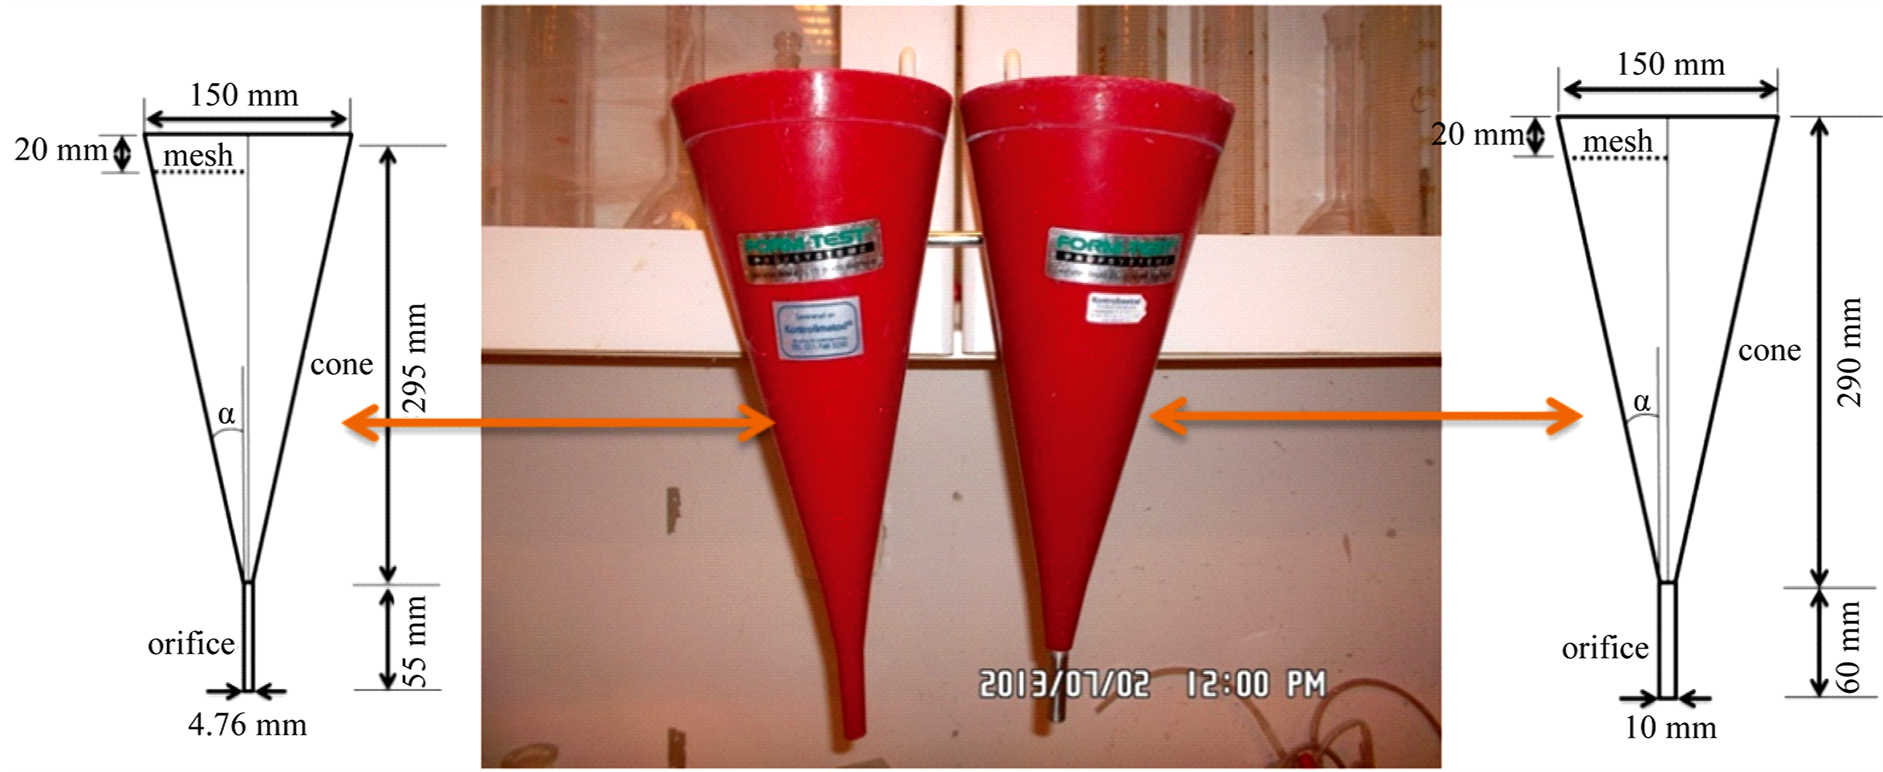
Figure 7. Marsh funnel, left: small one (4.76 mm orifice), right: the big one (10 mm orifice).

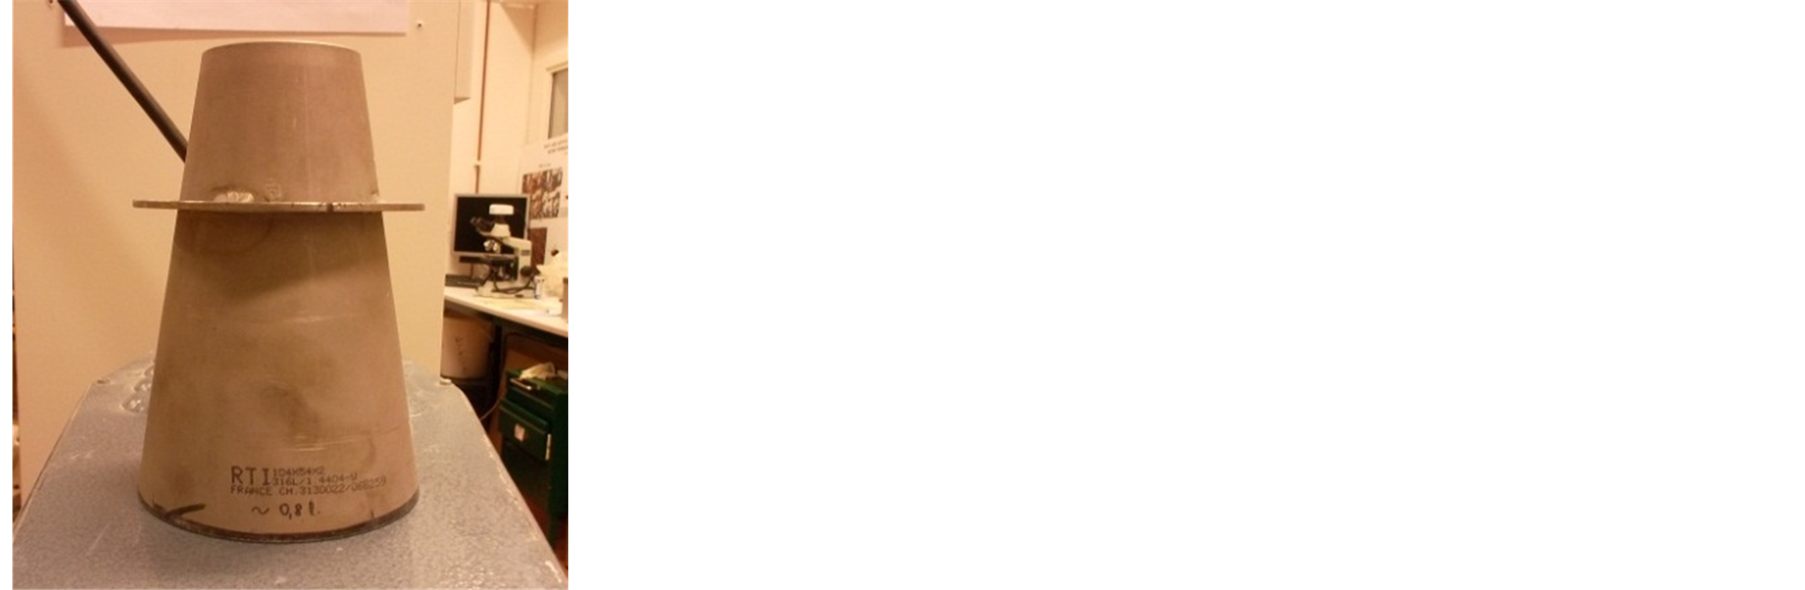
Figure 8. Left figure shows the mini slump cone and right figure shows the final spread of a grout in the mini slump test.
fractures more narrow than 100 µm requires that the (kinematic) viscosity is as low as 0.05 Pas and that high injection pressures are used [27] . The geometry and rawness of the fracture surfaces are further restraints to deep grout penetration.
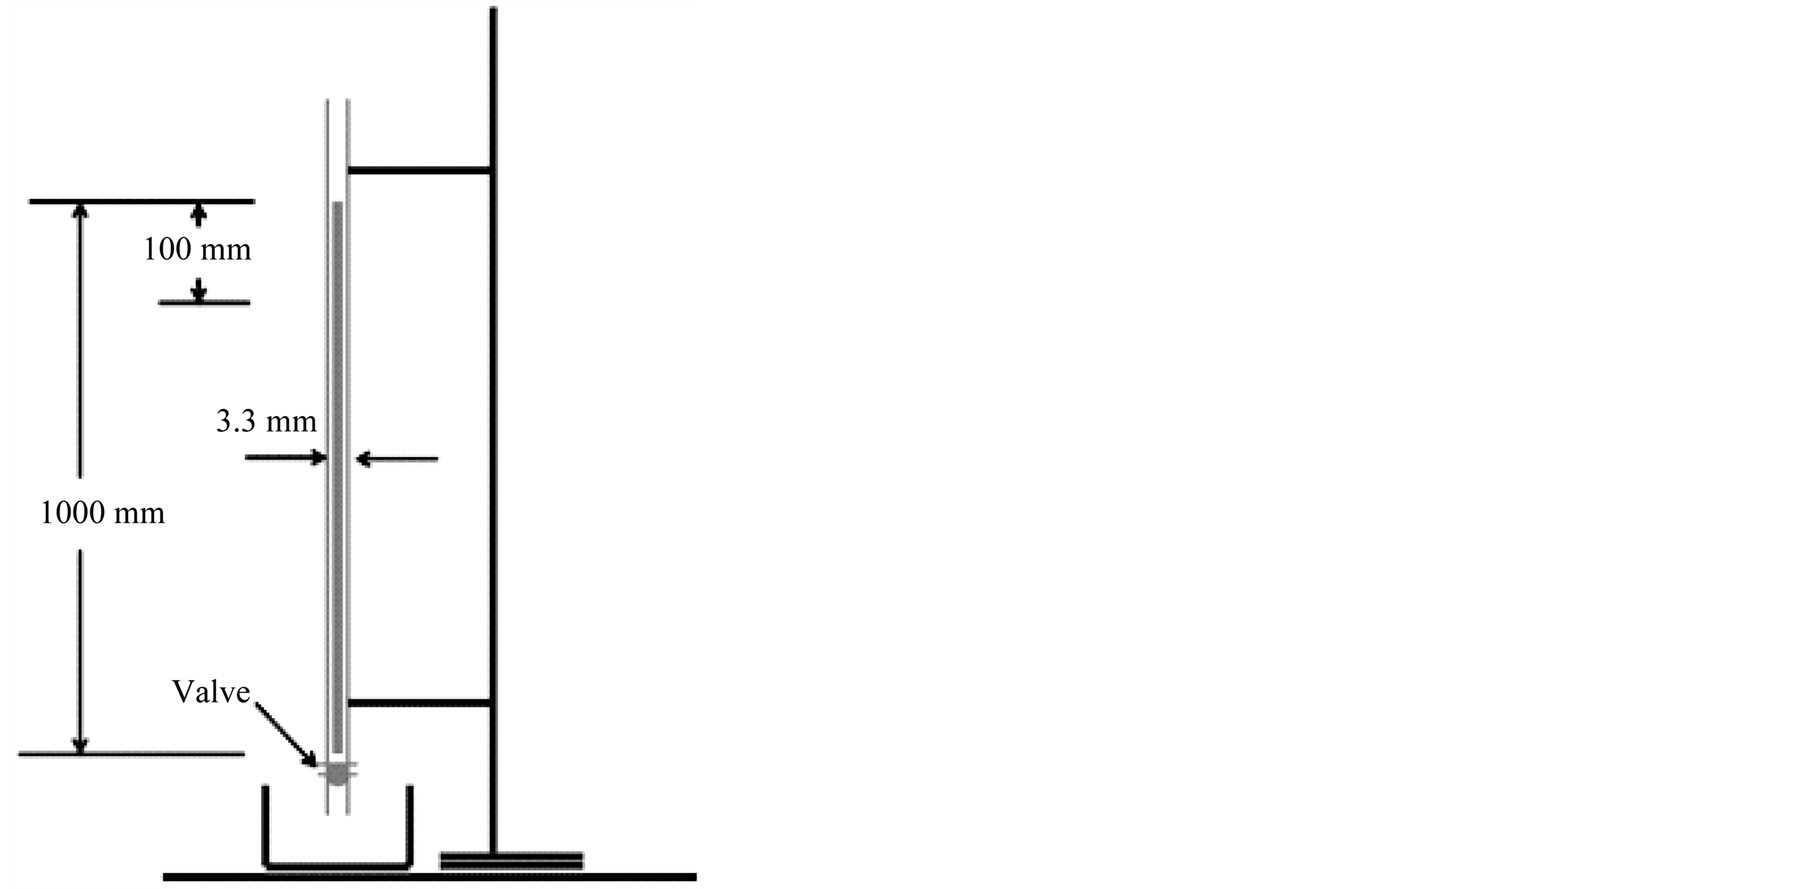
Figure 9. Grout capillary testing.
For wider fractures the viscosity can be significantly higher and relatively thick grouts, i.e. with viscosities ranging between 1 and 50 Pas, can be used for fractures with apertures larger than a few millimeters.
3.2. Viscometer Testing
Figure 10 demonstrates that all the grout candidates are Bingham fluids.
The yield stress is obtained by extrapolation of the descending branch of the curves to intersect the stress axis. The (plastic) viscosity is given by slope of the curve as summarized in Table 4.
It shows that the two grouts Grt1 and Grt2 with talc and similar densities have low yield stresses and appear more Newton-like than Grt3 with palygorskite despite the lower density of the latter. Grt2, having the highest density of all the grouts, is most fluid for low shear rates and tends to be so also for high shear rates, which can make it suitable for “dynamic” injection [27] . The higher viscosity of Grt2 with low w/c (7.23) had lower yield stress than Grt1 with higher w/c (7.84), which can be explained by the slower hydration rate of the low-pH cement in Grt2 than of Portland cement in Grt1. The strongly thixotropic behaviour of the palygorskite component of Grt3 gave the grout a high viscosity and yield stress by quick hardening, which can make it suitable for grouting wide fractures. The filtering potential of palygorskite can make it less sensitive to internal erosion than the talc component of the other grouts.
3.3. Marsh Funnel Tests
The Marsh funnel time provides a single data point that cannot be used alone to specify rheology [6] . A funnel with 10 mm orifice diameter filled to the mark has an initial height of grout of 270 mm, which drops to 197 mm after outflow of the specified volume. Using these data, one obtains the (equivalent) viscosity as in Equation (1):
 (1)
(1)
where t, is the time (sec.) of outflow of the volume 0.95 L, ρ, the grout density in (g/cm3), μe, the effective viscosity in cp. For the smaller Marsh cone with 4.76 mm orifice diameter the corresponding equation is (Equation (2), [6] ):
 (2)
(2)
The evaluated (effective) viscosities of the investigated grouts are summarized in Table 5.
In the first followed procedure, a Marsh funnel test cannot provide enough data to give the yield stress as the
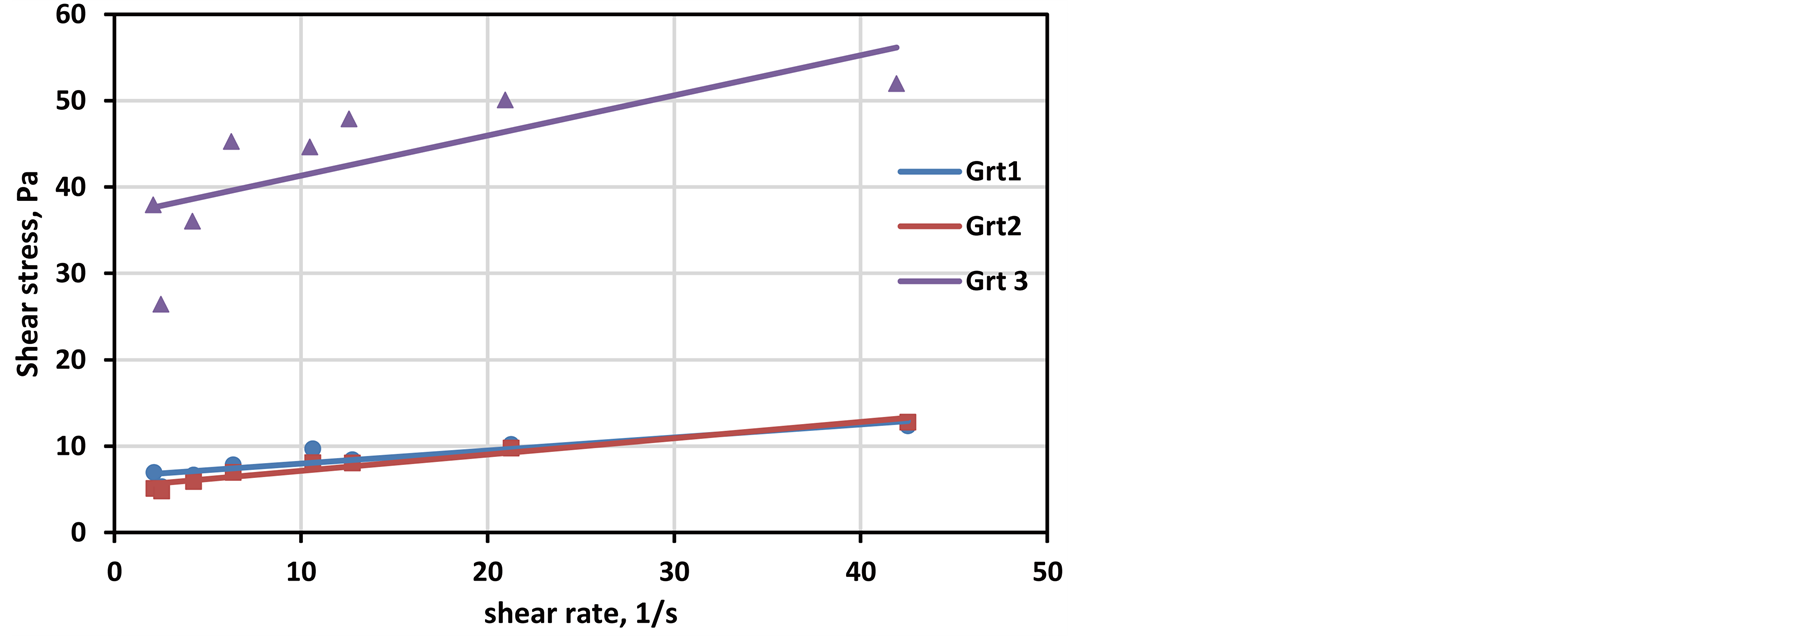
Figure 10. Shear stress in terms of strain rate during a viscometer test for all candidate grouts.
Table 4. Evaluated viscosities and the yield stresses according to the Bingham model of candidate grouts.
Table 5. Effective viscosities of grouts obtained according to the marsh funnel results from the first procedure and (Equations (1) and (2)).
viscosity. The idea here is to use the same two different funnels respectively but in different way as will be clarified in the next section. This second procedure will allow the user to calculate the two behaviour parameters (yield stress and viscosity) depending on the geometric properties of the two funnels which are given in Table 6.
The parameters shown in Table 6, used to calculate the constants an and bn which they are depending on the funnel geometry and on the observed flowing volume [8] . They can either be calculated using the analytical expressions by Roussel & Roy [8] as did in this study or calibrated using known materials. Both methods should give similar results, but the estimation has one advantage; the coefficients are very sensitive to h and r, which are sometimes difficult to measure. It can be demonstrated from these equations that, constants an and bn are respectively listed (cf. Table 6).
The latter procedure was to fill in 0.8 L grout and let 0.4 L flow out, corresponding to an initial grout fill height H0 and a final height H, as given by Table 6. The nozzle diameters were 4.76 and 10 mm, respectively. The times T1 and T2 for the outflow were recorded. Using Equations (3) and (4) [8] , the tested material behaviour parameters are plastic yield value (Ki) and plastic viscosity (μp) may be calculated. The measured flow times and rheological behaviour for each grout mix are shown in Table 7.
 (3)
(3)
 (4)
(4)
where Tn, is the time (sec.) of outflow of the volume 0.4L, ρ, the grout density in (g/cm3), μp, the plastic viscosity in (mPas), Ki, the plastic yield value (Pa),an, bn, are constants,
Table 6. Parameters of test for the tested grouts.
Table 7. Rheological parameters of candidate grouts identified using a marsh funnel results followed the second procedure and (Equations (3) and (4)).
3.3.1. Statistical Analysis
Regression analysis was applied by the use of statistic software (Minitab 16), [28] and the actual recorded data (Table 8), giving the expression in Equation (5), with the correlation coefficient (R2 = 95.3%). The results are listed in Table 9.
 (5)
(5)
where t is the Marsh funnel time for passed volume (V dm3), ρ is the grout density in (kg/m3), μ the grout viscosity in (mPas) and O, is the orifice diameter (mm).
3.4. Slumping Tests
The results from the slumping tests are summarized in Table 10.
Grouts Grt1 and Grt2 with talc and different cement types were almost identical while (Grt3) with palygorskite, gave less wide spread despite the high w/c ratio (16.7). This is assumed to be related to the high thixotropic potential and that twice as much water was sorbed as for the talc-grouts, giving less free water for easy flow. The final spread diameter was accordingly lower (20 cm) because of the higher yield stress (36.7 Pa). It can be claimed that the yield stress is the main phenomenon controlling the final spread diameter.
3.5. Pipette Test
The viscosities evaluated according to the Poiseuille’s law are listed in the Table 11. It could not be accurately determined for Grt3 it was deemed higher than that of the Grt1 and Grt2 grouts, in agreement with the other viscosity tests.
The overall conclusion is that the viscosity of the investigated grouts is less than 10 Pas and that they are all injectable in fractures with hydraulic apertures of more than 100 µm. The tube technique is recommended to be as a quick way of checking the fluidity of grouts in field testing.
4. Discussion and Conclusions
Description of the flow properties of grouts in terms of yield stress and viscosity is well established. The most accurate method for determining the viscosity is represented by viscometry while all the other techniques suffer
Table 8. Actual data.
Table 9. Viscosity evaluated according to the statistical analysis.
Table 10.Results from the slumping tests.
Table 11.Evaluated viscosities of grouts obtained according to the pipette test.
from time-dependent physic/chemical processes that take place in the grout samples being tested. Thus, extreme thixotropy and very early cement hydration tend to give too high viscosity data in Marsh funnel testing, especially for small funnel. However, averaging the two Marsh data the agreement with the rheometer and pipette data is relatively good. The pipette method gives values that are about 26.5% higher than the viscometer for the grout with Portland cement and talc, and about 13.7% lesser than the viscometer data for the grout with low-pH cement and talc. For the grout with palygorskite the viscosity is estimated to be at least twice that of the other grouts. It is obvious that the diameter of the “slump cone” drops with increasing viscosity of the grout. Table 12 summarizes the results obtained with an estimated uncertainty derived from the deviation from the rheometer data. One concludes that grout fluidity is positively affected by effect superplasticizers and negatively by thixotropic action and early cement hydration.
Table 12.Comparison of obtained viscosities (mPas), with error.
Acknowledgements
The authors will send their acknowledgment to the Sibelco Nordic, Lillesand, Norway, for providing Norquartz 45 which have used in the present study. The laboratory tests have been performed at Luleå University of Technology (Complab) therefore, authors would like to give their appreciation to them.
References
- Nguyen, V.H., Rémond, S., Gallias, J.L., Bigas, J.P. and Muller P. (2006) Flow of Herschel-Bulkley Fluids through the Marsh Cone. Journal of Non-Newtonian Fluid Mechanics, 139, 128-134. http://dx.doi.org/10.1016/j.jnnfm.2006.07.009
- Toumbakari, E.-E., Van Gemert, D., Tassios, T.P. and Tenoutasse, N. (1999) Effect of Mixing Procedure on Injectability of Cementitious Grouts. Cement and Concrete Research, 29, 867-872. http://dx.doi.org/10.1016/S0008-8846(99)00054-X
- Banfill, P.F.G. (2003) The Rheology of Fresh Cement and Concrete—A Review. Proceedings of 11th International Cement Chemistry Congress, Durban, May 2003, 13p.
- Westerholm, M. (2006) Rheology of the Mortar Phase of Concrete with Crushed Aggregate. Licentiate Thesis, Lulea University of Technology, Lulea.
- Hakansson, U. (1993) Rheology of Fresh Cement-Based Grouts. PhD Thesis, Royal Institute of Technology, Stockholm.
- Pitt, M.J. (2000) The Marsh Funnel and Drilling Fluid Viscosity: A New Equation for Field Use. SPE Drilling & Completion, 15, 3-6. http://dx.doi.org/10.2118/62020-PA
- Le Roy, R. and Roussel, N. (2005) The Marsh Cone as a Viscometer: Theoretical Analysis and Practical Limits. Materials and Structures, 38, 25-30. http://dx.doi.org/10.1007/BF02480571
- Roussel, N. and Le Roy, R. (2005). The Marsh Cone: ATest or a Rheological Apparatus? Cement and Concrete Research, 35, 823-830. http://dx.doi.org/10.1016/j.cemconres.2004.08.019
- Tregger, N., Ferrara, L. and Shah, S.P. (2008) Identifying Viscosity of Cement Paste from Mini-Slump-Flow Test. ACI Materials Journal, 105, 558-566.
- Bouvet, A., Ghorbel, E. and Bennacer, R. (2010) The Mini-Conical Slump Flow Test: Analysis and Numerical Study. Cement and Concrete Research, 40, 1517-1523. http://dx.doi.org/10.1016/j.cemconres.2010.06.005
- Mohammed, M.H., Pusch, R., Al-Ansari, N., Knutsson, S., Jonasson, J.E., Emborg, M. and Pourbakhtiar, A. (2013) Proportioning of Cement-Based Grout for Sealing Fractured Rock-Use of Packing Models. Engineering, 5, 765-774. http://dx.doi.org/10.4236/eng.2013.510092
- Utsi, S. (2008) Performance Based Concrete Mix-Design Aggregate and Micro Mortar Optimization Applied on Self-Compacting Concrete Containing Fly Ash. PhD Thesis, Luleå University of Technology, Luleå.
- Agulló, L, Toralles-Carbonari, B, Gettu, R. and Aguado, A. (1999) Fluidity of Cement Pastes with Mineral Admixtures and Superplastisizer—A Study Based on the Marsh Cone Test. Materials and Structures, 32, 479-485. http://dx.doi.org/10.1007/BF02481631
- Gettu, R., Izquierdo, J., Gomes, P.C.C. and Josa, A. (2002) Development of High-Strength Self-Compacting Concrete with Fly Ash: a Four step Experimental Methodology. Proceedings of the 27th Conference on Our World in Concrete & Structures, Singapore, 29-30 August 2002, 217-224.
- Domone P. (2006) Mortar Tests for Self-Consolidating Concrete. Concrete International, 28, 39-45.
- Svermova, L., Sonebi, M. and Bartos, Peter, J.M. (2003) Influence of Mix Proportions on Rheology of Cement Grouts Containing Limestone Powder. Cement & Concrete Composites, 25, 737-749. http://dx.doi.org/10.1016/S0958-9465(02)00115-4
- Park, C.K., Noh, M.H. and Park, T.H. (2005) Rheological Properties of Cementitious Materials Containing Mineral Admixtures. Cement and Concrete Research, 35, 842-849. http://dx.doi.org/10.1016/j.cemconres.2004.11.002
- Eklund, D. and Stille, H. (2008) Penetrability Due to Filtration Tendency of Cement-based Grouts. Tunnelling and Underground Space Technology, 23, 389-398. http://dx.doi.org/10.1016/j.tust.2007.06.011
- Pusch, R. and Yong, R.N. (2006) Micostructure of Smectite Clays and Engineering Performance. Taylor & Francis, London & New York.
- Pusch, R. (2008) Geological Storage of Radioactive Waste. Springer Verlag, Berlin-Heidelberg. http://dx.doi.org/10.1007/978-3-540-77333-7
- Pourbakhtiar, A. (2012) Pilot Study of Method for Constructing Concrete Seals and Fracture Grouts in Deep Boreholes and CementitiousBackfills in Tunnels, Drifts and Shafts in Crystalline Rock. M.Sc. Thesis, Lulea University of Technology, Lulea.
- Aitcin, P.-C., Jolicoeur, C. and Macgregor, J.G. (1994) Superplastizisers: How They Work and Why They Occasionally Don’t. Concrete International, 16, 45-52.
- EN 445 (1996) Grout for Prestressing Tendons Tests Methods.
- ASTM C939-94a (1994) Standard Test Method of Flow of Grout for Preplaced-Aggregate Concrete (Flow Cone Method). 470-471.
- EN 12 715 (2000) Execution of Special Geotechnical Work—Grouting.
- Mohammed, M.H., Pusch, R. and Knutsson, S. (2014) Study of Cement-Grout Penetration into Fractures under Static and Oscillatory Conditions. Tunnelling and Underground Space Technology, under reviewing.
- Pusch, R. (1994) Waste Disposal in Rock. Elsevier, Amsterdam, London, New York and Tokyo.
NOTES

*Corresponding author.