Engineering
Vol.6 No.8(2014), Article ID:47753,7 pages
DOI:10.4236/eng.2014.68042
A New Model to Predict Average Pressure Difference of Liquid Droplet and Its Application in Gas Well
Haiquan Zhong1*, Jiao Tan2, Chi Zhang2
1The State Key Lab of Oil/Gas Reservoir Geology and Exploitation, Southwest Petroleum University, Chengdu, China
2School of Petroleum Engineering, Southwest Petroleum University, Chengdu, China
Email: *swpuzhhq@126.com
Copyright © 2014 by authors and Scientific Research Publishing Inc.
This work is licensed under the Creative Commons Attribution International License (CC BY).
http://creativecommons.org/licenses/by/4.0/


Received 19 April 2014; revised 25 May 2014; accepted 5 June 2014
ABSTRACT
The distribution of droplet surface pressure is uneven under the action of high velocity gas streams in gas wells, and there exists a pressure difference which leads to droplet deformation before and after the droplet. Moreover, it affects the critical liquid carrying rate. The pressure difference prediction model must be determined, because of the existing one lacking theoretical basis. Based on the droplet surface pressure distribution in high velocity gas streams, a new model is established to predict the average differential pressure of droplets. Compared with the new differential pressure prediction results, the existing pressure difference prediction results were overvalued by 46.0%. This article also improves four gas-well critical liquid carrying models using the proposed pressure difference prediction model, and compares with the original one. The result indicates that the critical velocity of the original models is undervalued by 10% or so, due to the overestimate to the pressure difference. In addition, comparisons of the improved model with original models show that it is necessary to consider the adaptability, because the models have significant differences in results, and different suitability for different well conditions.
Keywords: Gas Well, Continuous Removal of Liquids, Liquid Droplet, Average Pressure Difference, Deformation, Model Comparison

1. Introduction
As natural gas is produced from underground reservoirs, there is more or less liquid output in most gas wells. At initial stage of production, formation energy is enough, usually gas can carry liquids to the surface. However, with the production of gas well, formation energy declines, so that gas cannot provide sufficient energy to lift liquids to the surface. The liquids will accumulate in the bottom of well over time, and cause an additional back pressure on the formation, which results in continued reduction of the available energy to lift liquids, and dramatically inhibits or stops gas production. This phenomenon is known as gas-well load-up. Numerous authors have offered methods for predicting gas-well load-up and proposed the critical gas flow rate to keep gas well unloaded. Turner et al. (1969) [1] pointed out the existence of liquid film and droplets for the removal of gas well liquids, based on the force analysis of liquid film and droplets, and assumed that the liquid droplets were spherical. They presented the liquid film model and droplet model for continuous liquid removal in gas wells. Comparisons of predictions with field data confirmed that liquid droplet model is more adequate, but that a 20% upward adjustment of the droplet model was necessary. Li Min et al. (2001, 2002) [2] [3] thought that in high velocity gas streams, the droplets would become ellipsoid body from sphere because of the action of the pressure difference between before and after the droplet. In order to simplify, Li Min et al. view ellipsoid body as a flat disk, and then deduced formulas (hereinafter referred to as Li-Min model) for predicting the critical flow rate considering the deformation of liquid drop entrained. On basis of Grace’s Chart, Wang Yi-zhong et al. (2007) [4] thought that the shape of droplets will transform into the spherical cap because of the existence of pressure difference between before and after the droplet. For the same consideration with Li-Min model, they regard the spherical cap as a cone, and then derived a new equation (hereinafter referred to as Wang Yi-zhong model) to calculate the critical velocity or flow rate. Based on Wei Na et al.’s (2007) [5] experimental observations, Peng Chao-yang (2010) [6] thought that the droplet in high velocity gas streams is close to ellipsoid body with height-width ratio of 0.9, and in the airflow under the action of existence, the droplets are considered as ellipsoid body (high:width = 0.9) of the critical velocity model (hereinafter referred to as Peng Chao-yang model). Wang et al. (2010) [7] analysed the influence factors to determine the drag coefficient of deformation droplet and got the gas-well critical liquid carrying model (hereinafter referred to as Wang model).
All the above-mentioned carrying liquid models except for that of Turner et al. take account of the deformation of the droplet under pressure difference. It is shown that: because the relative motion between the droplet and the gas flow, the fluid dynamic pressure on the droplet is not homogeneous, which produces a pressure difference between the front and the back of the droplet, and this mechanism [8] [9] can force the droplet deformed. According to Bernoulli equation, notice that all the above-mentioned four models set the pressure difference as ρgu2/2. However, the practical pressure difference is just as the same order of ρgu2/2, not equal to or approximately equal to ρgu2/2. So we can conclude that the prediction of the pressure difference between the front and back of droplet based on the above model lacks theoretical fundamental. Considering that this pressure difference can influence the deformation of droplet, and thus influence the critical carrying liquid flow rate, the average pressure difference must be calculated reasonably.
2. Average Pressure Differential Model
At a particular depth, gas flows up at the rate ug when the liquid droplet is suspending (critical state, ud = 0). The center of a droplet is defined as the origin, establishing X-Y-Z coordinate system. We assume that the positive direction of Z axes is aligned with flow direction and the drop is divided into front part and back part by X-Y plane.
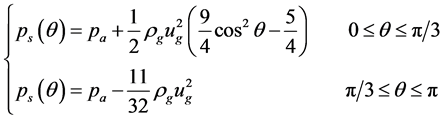
Defined the gas flow pressure as pa, from the research result of Flachsbart (Flachsbart, 1965; Loth, 2010) [10] -[12] , the pressure distribution on the surface of spherical droplet in parallel gas flow could satisfy the formula below:
 (1)
(1)
where θ is included angle between OA and flow opposite direction, A is a random point on surface of the droplet included by X-Y plane. For Re > 2 × 10⁵, this formula above is still workable with the same distribution characteristic (Lin, 2010) [13] .
In Figure 1, the included angle between OD and OA is dθ. According to symmetry, the pressure of each point
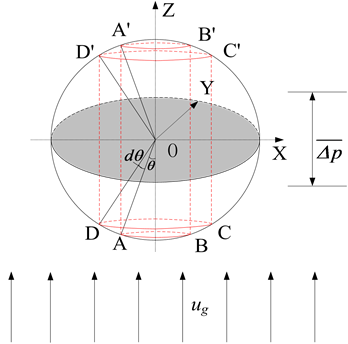
Figure 1. Pressure distribution on the surface of droplet.
on circle A-B is equal. The A'-B' circle and D'-C' circle are defined similarly, Where A', B', C' and D' are respectively the projection point of A, B, C and D on the surface of front drop part. If dθ is small enough, the pressures of points on spherical zone ABCD are equal (integral principle). Because of symmetry, the same thing is done for the points on spherical zone A', B', C', D'. Thus, the differential pressure between front part and back part (for X-Y plane, the surface pressure of under part ≥ that of upper part) is determined by the formula below:
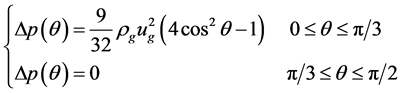 (2)
(2)
From Equation (2), the droplet surface average pressure difference can be calculated as the following:
 (3)
(3)
where
 is the droplet surface average pressure difference. From Equation (3),
 is obviously less than
 (critical state, ud = 0), the ratio of Equation (3)
and
(critical state, ud = 0), the ratio of Equation (3)
and
 is 0.685. Which shows that Li Min model, Wang Yi-zhong model Peng Chao-yang model
and Wang model all overestimate the droplet surface average pressure difference
about 46.0%.
is 0.685. Which shows that Li Min model, Wang Yi-zhong model Peng Chao-yang model
and Wang model all overestimate the droplet surface average pressure difference
about 46.0%.
3. Improvement and Comparison of Models
We show the critical flow rate expressions derived by Li Min model, Wang Yi-zhong model, Peng Chao-yang model and Wang model, respectively, by using the derived pressure difference of the front and back of droplet. The formulas and original formulas all satisfy the following form:
 (4)
(4)
C is a constant, and the C values of different models are shown in Table 1 as follows.
Table 1 lists out 4 critical flow velocity models which concerned droplet deformation under the effect of pressure difference and the assumption of the droplet shape, and the formula coefficient before and after improvement. From the formula coefficient before and after improvement we can get because of the original model overrate the average pressure difference of droplet, it makes the needed critical velocity be underestimated for around 10%.
4. Application and Discussion
Based on the data provided by Li Min, Wang Yi-zhong, Peng Chao-yang, and Wang model, critical gas rates of the improved models list in Tables 2-5 separately. Considering the difficulty of judging the near loaded-up and the subjectivity of original data, the near loaded-up should be regarded as the loaded. According to Li Min model calculation method, the results of Li Min and the improved model are shown in Table 2, critical rate of the improved model is higher than that of Li Min model. It is worth mentioning that the gas production rate of well NO.12, whose real production status is loaded, is significantly higher than the calculation result of Li Min model signifying unloaded status, and less than that of improved Li Min model signifying loaded status.
According to calculation methods of Wang Yi-zhong model, The computation results before and after improvement are shown in Table 3, critical rate of the improved model is higher, however, it is unable to determine which model is more suitable. Because of lacking gas well production data. At the same time, the well may be inappropriate as an example because the pressure is ultrahigh, probably it is more appropriate from the perspective of energy analysis.
According to calculation methods of Peng Chao-yang model, The results before and after improvement are shown in Table 4, critical rate of the improved model is higher than that of experiment or Peng Chao-yang model. However, it is probably reasonable because the droplets are generated by other energy consumption

Table 1 . Comparison of critical velocity.
Table 2. Data and prediction of critical rate for the improved Li Min model.
Table 3. Prediction of critical rate for the improved Wang Yi-zhong model.
Table 4. Experiment and prediction of critical rate for the improved Peng Chao-yang model.
rather than the result of gas liquid two phase flow. That is why critical rate should be higher than that of experiment.
According to Wang model, the computation results before and after improvement are shown in Table5 Based on the production gas rate, water rate and pressure, perhaps it is difficult to form a large number of droplets, so the rationality of this case still need further discussion. For well NO.2, production gas rate of well NO.2 is significantly higher than the calculation result of Wang model, but it is less than that of improved model, which shows well NO.2 is in loaded-up status, in fact, but it is in unloaded status. Due to the high pressure, probably it is more appropriate from the perspective of energy analysis. In addition, gas production rate of well 10 is higher than the calculation result of Wang model, but it is less than that of improved model, this shows well 10 is in loaded-up status, but it is in unloaded status if using Wang model.
5. Conclusions
1) The study provides the basis of droplet deformation and liquid carrying in gas well for the droplet surface
Table 5 . Data and prediction of critical rate for the improved Wang model.
average pressure difference. A droplet surface average pressure difference prediction model is established, based on the surface pressure distribution of droplet in high velocity gas flow. It also improves the theory of droplet deformation and liquid carrying.
2) According to the improvement of the average differential pressure of droplet, four critical velocity models are separately improved, and it makes theoretical fundamental improved and more actual.
3) From the average differential pressure model before and after improvement we can get: the existing differential pressure prediction results of Li Min model, Wang Yi-zhong model, Peng Chao-yang model and Wang model were overvalued by 46.0%, and it makes the critical velocity of the original models undervalued by 10% or so.
4) The improved model is more reasonable for those cases, meanwhile rationality of the cases still needs further discussion.
Acknowledgements
The authors would like to thank NSFC (National Natural Science Foundation of China) for the financial support given (Process 51104125/2012-2014/Project/Title: Study on Mechanism of liquid carrying for downhole throttling in water production gas wells), and the special fund of China’s central government for the development of local colleges and universities-the project of national first-level discipline in Oil and Gas Engineering.
References
- Turner, R.G., Hubbard, M.G. and Dukler, A.E. (1969) Analysis and Prediction of Minimum Flow Rate for the Continuous Removeal of Liquids from Gas Wells. JPT, 11, 75-82.
- Li, M., Guo, P. and Tan, G.T. (2001) New Look on Removing Liquids from Gas Wells. Petroleum Exploration and Development, 5, 105-106.
- Li, M., Li, S.L. and Sun, L.T. (2002) New View on Continuous-Removal Liquids from Gas Wells. SPE Production & Facilities, 1, 42-46.
- Wang, Y.Z. and Liu, Q.W. (2007) A New Method to Calculate the Minimum Critical Liquids Carrying Flow Rate for Gas Wells. Petroleum Geology & Oilfield Development in Daqing, 6, 82-85.
- Wei, N., Li, Y.C., Li, Y.Q., et al. (2007) Visual Experimental Research on Gas Well Liquid Loading. Drilling & Production Technology, 3, 43-45.
- Peng, C.Y. (2010) Study on Critical Liquid-Carrying Flow Rate for Gas Well. Xinjiang Petroleum Geology, 1, 72-74.
- Wang, Y.W., Zhang, S.C., Yan, J., et al. (2010) A New Calculation Method for Gas-Well Liquid Loading Capacity. Journal of Hydrodynamics, 6, 823-828. http://dx.doi.org/10.1016/S1001-6058(09)60122-0
- Dai, G.C. and Chen, M.H. (1988) Chemical Fluid Mechanics. Chemical Industry Press, Beijing, 68-90.
- Guo, L.J. (2002) Two Phase and Multiphase Flow Mechanics. Xi’an Jiaotong University Press, Xi’an, 502-510.
- Flachsbart, B. (1965) Liquid-Gas Interfaces Studied on the Basis of the Classical Surface Tension Theory and Intermolecular Force Models. Stanford University, California, 102-108.
- Loth, E. (2010) Particles, Drops and Bubbles: Fluid Dynamics and Numerical Methods. Cambridge University Press, London, 149-150.
- Hinze, J.O. (1948) Critical Speeds and Sizes of Liquid Globules. Applied Scientific Research, A1, 273-287.
- Lin, Z.H. (2000) A Science of Irregular Change Flow—Multiphase Fluid Mechanics. Tsinghua University Press, Beijing, 44-47.
Nomenclature
u: Relative velocity between gas stream and liquid droplet, m/s ug: Gas stream velocity, m/s ud: Liquid droplet velocity, m/s pa: Gas stream pressure, pa ps: Droplet surface pressure, pa
Greek Letters
ρg: Gas density, kg/m3
ρL: Liquid density, kg/m3
 : Average pressure difference before and after droplets,
pa
: Average pressure difference before and after droplets,
pa
θ: the angles between OA line and the opposite direction of gas stream, deg Re: Reynolds number
π: circumference ratio, 3.14
NOTES

*Corresponding author.