Engineering
Vol. 4 No. 1 (2012) , Article ID: 17093 , 5 pages DOI:10.4236/eng.2012.41002
Carbonic Gas Randomness Effect on Reinforced Concrete Carbonation
1Ecole Nationale Supérieure des Travaux Publics, Cité Sidi Garidi Kouba, Algiers, Algeria
2FEHR Technologies Les Teppes, Chateauneuf-Sur-Isere, France
3Université des Sciences et de la Technologie Houari Boumedienne, Laboratoire Bâti dans l’Environnement, Algiers, Algeria
Email: *azharbadaoui@yahoo.fr
Received October 4, 2011; revised November 4, 2011; accepted November 15, 2011
Keywords: Carbonation Depth; Carbonation Time; Lognormal Random Variable; Carbonic Gas CO2; Relative Humidity; Water/Cement Ratio
ABSTRACT
This paper deals the randomness effect of the pressure of carbonic gas on the carbonation phenomenon of the reinforced concrete. This analysis concentrates on the evaluation of carbonation depth (Xc) and the carbonation time (T1) which is the time necessary so that the face of carbonation arrives until the reinforcement from a probabilistic analysis. Monte Carlo simulations are realized under the assumption that the carbonic gas on the surface of the concrete is random variable with a log-normal probability distribution.
1. Introduction
Physiochemical aggressions of reinforced concrete structures, which are mainly of diffusion nature, are caused by external exposure. The aggressive agents propagate in the concrete by porosity, in the presence of carbonic gas and chlorine ions [1].
The degradations induced by the external conditions are ordered by defining several classes of exposure for the corrosion risk, depending on the environmental actions and concrete work conditions.
Studies of corrosion in reinforced concrete structures require very large specimens due to the heterogeneous structure of the concrete [2].
Several authors have proposed deterministic mathematical models of carbonation: Van Balen and Van Gemert model, based on the mathematical formulation of carbonation and taking into account the effects of water content [3].
Papadakis and al consider the diffusion of CO2 into the porous network and its dissolution in the interstitial liquid phase. The dissolution of Portland by reaction with CO2 and water condensation on the pore walls after the carbonation as a function of relative humidity and temperature has also been formulated [1].
The Duracrat model results from the resolution of the diffusion equation of CO2 in porosity of the concrete at constant temperature, the transfer of moisture is not considered but its influence is explicit [4].
All these deterministic models consider the action of carbon dioxide on the concrete compounds comprise some limits related to the random variation of the input model parameters and the precise knowledge of these parameters requires a probabilistic approach enable to modeling the uncertainties and analyzing their dispersion effect [5].
In this paper, a probabilistic formulation is applied to carbonation phenomenon, and statistics regarding carbonation depth and time are investigated by performing a parametric analysis which integrates the influence of variation coefficient carbonic gas pressure Cs.
2. Probabilistic Analysis of Reinforced Concrete Carbonation
Carbonation phenomenon is due to the calcium carbonate formation by reaction between cements and atmospheric carbon dioxide CO2.
From a chemical point of view this reaction arises as follows [1]:
CO2 + (OH)2  H2O + alkaline bases
  CaCO3 + H2O (1)
This reaction involves the consumption of alkaline bases present in the interstitial solution of the concretes leading to a reduction in the pH from 13 to lower than 9, the corrosion of the reinforcements can be initiated by the carbonation reaching the reinforcement faces, and a steel depassivation occurs by the reduction in the pH around 9 [5].
Duracrat’s model gives an expression of the carbonation depth (Xc) for a given exposure time T by [6]:
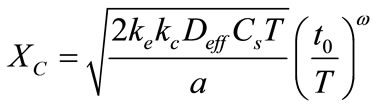 (2)
(2)
The time carbonation, which is the time necessary so that the carbonation reaches the reinforcement according to the following relations
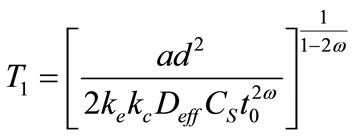 (3)
(3)
T1 is the expiry considers (year)
where  is the factor of environment, depending on the climatic conditions, and given by
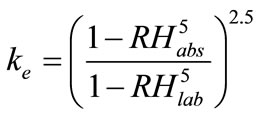 (4)
(4)
 is a parameter taking account of the conditions of curing compound concrete, given by:
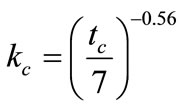 (5)
(5)
 is the effective coefficient of diffusion of CO2
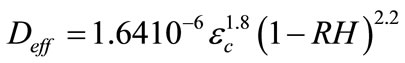 (6)
(6)
 is the porosity of the paste of the carbonated concrete depends on the composition of the concrete, given by the formulation
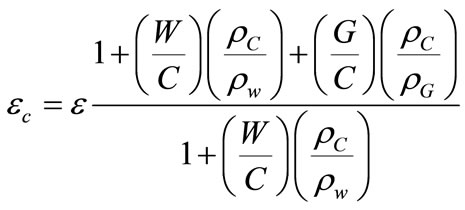 (7)
(7)
where  is the water density,
  cement density,
  aggregates density,
  is the Water to cement ratio,
  aggregates to cement ratio.
For the composition of concrete proposed, the effective coefficient of diffusion can be estimated at  = 0.46 × 10⁻⁸ m2/s, with a value of porosity ec = 0.5.
Cs is the CO2 pressure on the surface of the concrete, Cs = 6.1 kg/m3;
t0 is the reference period (28 days);
w is the meso-climatic factor w = 0.1;
d is the coating;
a is the quantity of material carbonated given by:
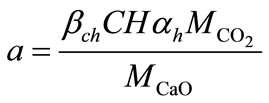 (8)
(8)
where  and
and  are the molar masses of carbonic gas and calcite,
  is the degree of hydration of cement,
  is the quantity of the Portland and
  translates the relation of the Portland likely to react, for the composition of the concrete proposed,
  = 80%,
  = 85% and
  = 164 kg/m3.
The pressure of CO2 (Cs) is assumed as uncertain with a lognormal probability distribution. The parameters of the lognormal distribution of Cs are expressed as follows:
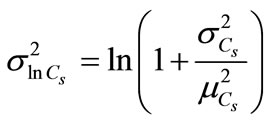 (9)
(9)
 (10)
(10)
where ( ,
, ) are statistics (mean and variance) of pressure of carbonic gas (Cs).
In this study, the Water/Cement ratio and the relative humidity are supposed to be determinist parameters, their coefficients of variation  and
and  are taken as zero.
The pressure of CO2 (Cs) is assumed as uncertain with a lognormal probability, which is suitable for strictly non-negative random variables with large values of coefficient of variation because in this case, simulations with normal distribution can give negative values.
3. Numerical Results and Discussion
The characteristics of the considered medium are:  = 3,
= 3,  = 0.5, rw = 103 Kg/m3, rc = 3150 Kg/m3, rG = 2400 Kg/m3, coating: d = 3 m, temperature: T = 20˚C and value of carbonic gas pressure is Cs = 6.1 Kg/m3. The mean value pressure of carbonic gas (Cs) is
  = 6.1 Kg/m3 and the coefficient of variation
  varies between 0 and 0.5 [7].
 ,
, .
.
Log-normal distributions are generated, and the deterministic numerical procedure is applied to each individual simulation, providing 10,000 values of the depth and time carbonation parameters [8,9]. Finally, statistics of the depth and time factors (mean, standard deviation and confidence interval) are calculated.
The behavior of the coefficient of variation of carbonation depth and time versus the number of realizations is also investigated, Figures 1 and 2. As, the convergence of the final settlement coefficient of variation is observed for a number of realizations Nsamp around 300, this number is chosen equal to 10,000.
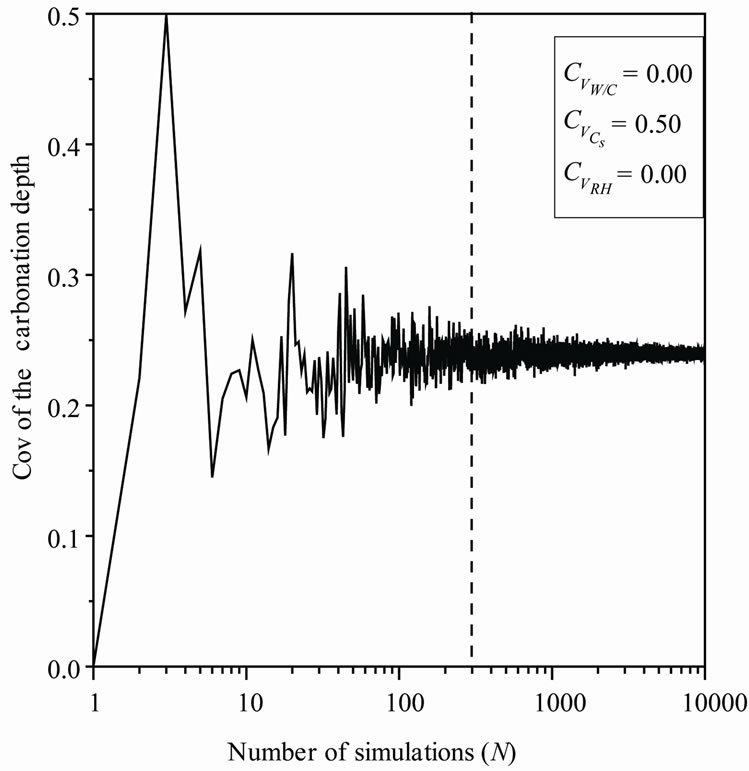
Figure 1. Carbonation depth coefficient of variation versus Cs.
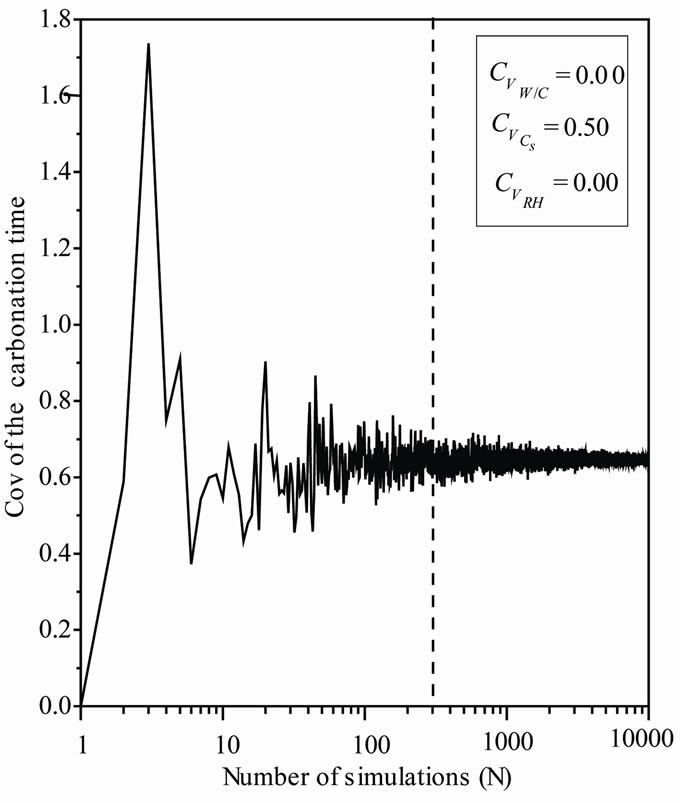
Figure 2. Carbonation time coefficient of variation versus Cs.
3.1. Carbonation Depth
The carbonation of the concrete starts at its surface and penetrates to a certain thickness known as carbonation depth, when the face of carbonation reaches the reinforcements, corrosion can begin.
For an assumed log-normal distribution of Cs, and Varying  from 0.0 to 0.5, leads to a reduction in the mean carbonation depth from 65 to 63 cm (3.08%), Figure 3. A slight increase is observed for the standard deviation and the confidence interval remains constant for mean and standard deviation indicating that the variability of CO2 concentration does not affect the standard deviation precision Figure 4.
The quantity of calcium carbonate is composed of two parts: the Calcium of (CH), (C3A.3Cs.H32) and (C3A.Cs. H12). The calcium is totally carbonated whatever the pressure of CO2. Carbonate quantity in the calcium silicate hydrates (CSH) depends on the degree of hydration of cement and the effective coefficient of diffusion of CO2 in carbonate zone.

Figure 3. Mean carbonation depth versus Cs coefficient of variation.
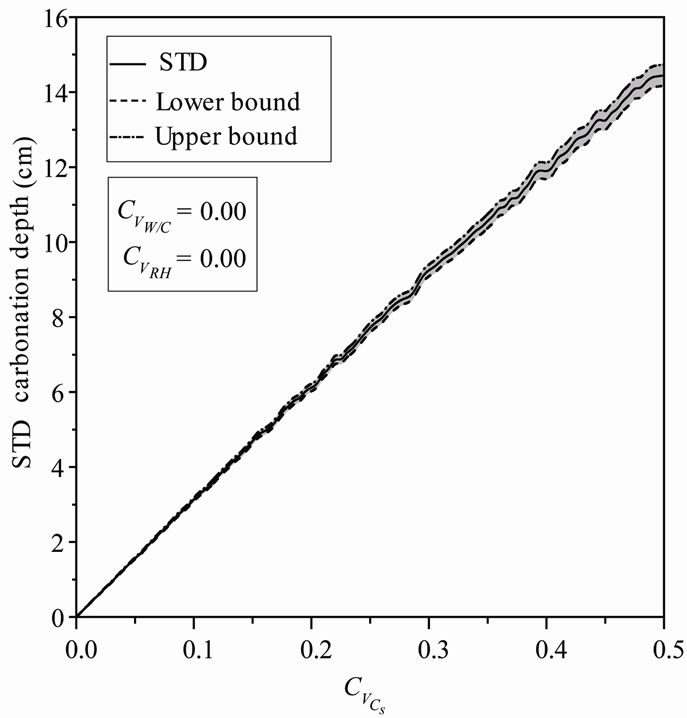
Figure 4. STD carbonation depth versus Cs coefficient of variation.
These parameters are independent of the study material and are estimated carbonation test.
The diffusion of atmospheric carbon dioxide through the porous structure of concrete is dependent on the state of hygroscopic pores of material. According to Chaussadent [3], two types of penetration of carbon dioxide can exist: through the liquid phase with a transfer of water charged with carbon dioxide dissolved, or when the water is already present in the diffusion aqueous phase through the gas phase, i.e. the network contains more porous aqueous phase. The speed of carbonation at 20˚C for traditional concrete is obtained for a relative humidity between 50% and 70% [1].
3.2. Carbonation Time
The carbonation rate can be determined from historical data and laboratory testing and the progression of depassivation with time can be calculated [2].
The carbonation time (T1) is the time required for the face of carbonation to reach the steel, i.e. the time of the beginning of corrosion. This corresponds to the case where the carbonation depth is equal to the concrete cover (d).
The speed of concrete carbonation depends mainly on the dioxide carbon penetration inside the cement matrix. Indeed, the diffusion of carbon dioxide through the porous structure of concrete is determined by the water to cement ratio and porosity. More  ratio is greater, more the amount of free water that can evaporate is important. By evaporation, the water leaves voids and promotes the diffusion of carbon dioxide through the pore network, for a significant porosity and the quantity of carbon dioxide released into the pores is important and time necessary of carbonation
  is short [10].
The carbonation of concrete has an impact on the effective coefficient of diffusion, this coefficient is decreased after the carbonation, and the interaction between the carbon dioxide ions and the surface of calcium silicate hydrates (CSH) negatively charged forms a double layer electric on the surface pores and slows the CO2 diffusion [11].
The variation of  can be observed in Figure 5, mean value of the carbonation time increases from 4.51 to 6.17 hours (37%), which indicates that the uncertainty in the CO2 concentration causes a delay in the carbonation process. The reaction of hydrated composed of concrete with carbon dioxide induces production of water, more the amount of carbon dioxide released into the pores is greater, more the quantity of water formed during carbonation is important, this training will also disrupt the process in the direction of slower reactions and increase the carbonation time. One notices an important increase of the standard deviation with parabolic curve Figure 6.
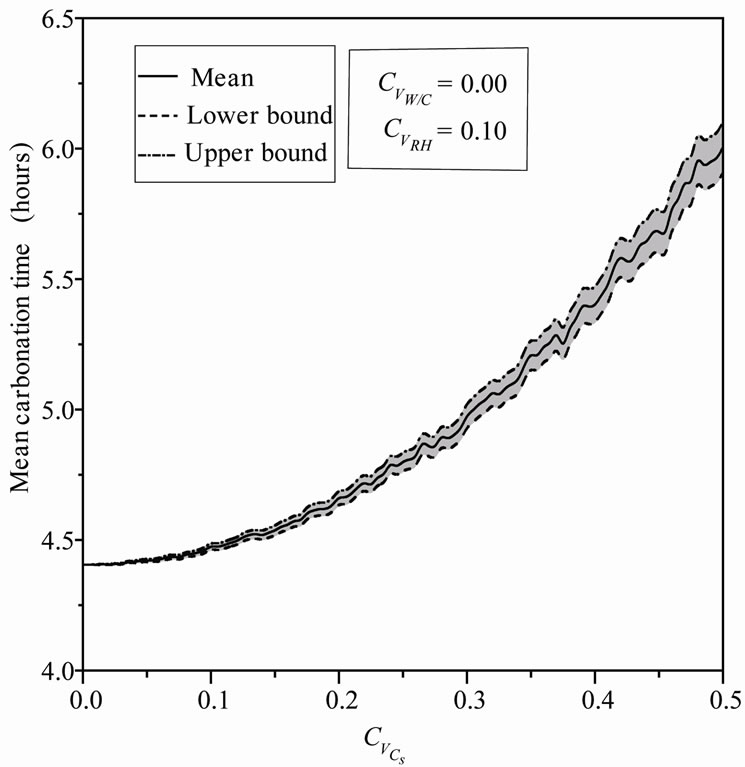
Figure 5. Mean carbonation time versus Cs coefficient of variation.
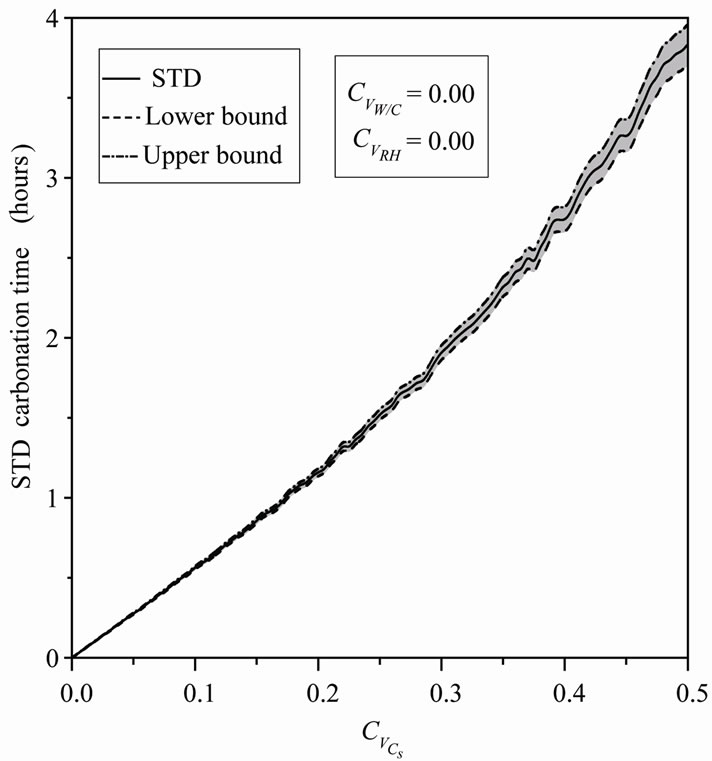
Figure 6. STD carbonation time versus Cs coefficient of variation.
4. Conclusions
The present paper deals with the effect of the pressure of the carbonic gas randomness on the carbonation depth and time.
Carbonic gas concentration variability effect on the carbonation depth is weak; this parameter can be assumed as deterministic for carbonation depth determination to decrease the computation time during a probabilistic treatment.
The carbonation time increases which indicates that the uncertainty in the CO2 concentration causes a delay in the carbonation process. The reaction of hydrated composed of concrete with carbon dioxide induces production of water, more the amount of carbon dioxide released into the pores is greater, more the quantity of water formed during carbonation is important, this training will also disrupt the process in the direction of slower reactions and increase the carbonation time.
REFERENCES
- N. Hyvert, “Application of the Probabilistic Approach to the Durability of the Prefabricated Concrete Products,” Doctoral Thesis, University of Toulouse, Toulouse, 2009.
- H. Böhni, “Corrosion in Reinforced Concrete Structures,” CRC Press, Boca Raton, 2005.
- E. Roziere, “Study of the Durability of Concrete with a Performance,” Doctoral Thesis, University of Nantes, Nantes, 2007.
- N. Lars-Olof and F. Katja, “CO2 Cycle in Cement and Concrete,” Lund Institute of Technology, Lund, 2009.
- F. Deby, “Probabilistic Approach to the Durability of Concrete in Marine Environment,” Doctoral Thesis, University of Toulouse, Toulouse, 2008.
- Duracrete, “Statistical Quantification of the Variables in the Limit Stat Functions,” Contract BRPR-CT95-0132, Project BE95-1347, The EU-Brite EuRam III, January 2000.
- FIB, Model Code for Service Life Design, Task Group 5.6, February 2006.
- M. Badaoui, M. K. Berrah and A. Mébarki, “Soil Height Randomness Influence on Seismic Response: Case of an Algiers Site,” Computers and Geotechnics, Vol. 36, No. 1-2, 2009, pp. 102-112. doi:10.1016/j.compgeo.2008.04.001
- M. Badaoui, M. K. Berrah and A. Mébarki, “Depth to Bedrock Randomness Effect on the Design Spectra in the City of Algiers (Algeria),” Engineering Structures, Vol. 32, No. 2, 2010, pp. 590-599. doi:10.1016/j.engstruct.2009.11.005
- V. Baroghel, “Micro Structural and Hydric Characterization of Cement Pastes, Ordinary Concrete and Very High Performance,” Doctoral Thesis, ENPC, Paris, 1994.
- M. Castellote, C. Alonso, C. Andrade and G. Chadbourn, “Oxygen and Chloride Diffusion in Cement Pastes as a Validation of Chloride Diffusion Coefficient Obtained by Steady State Migration Tests,” Cement and Concrete Research, Vol. 31, No. 4, 2001, pp. 621-625. doi:10.1016/S0008-8846(01)00469-0
NOTES
*Corresponding author.