Materials Sciences and Applications
Vol.4 No.12(2013), Article ID:40531,5 pages DOI:10.4236/msa.2013.412097
Strain Capacities Limits of Wrought Magnesium Alloys: Tension vs. Expansion
![]()
1Institut Jean Lamour, Université de Lorraine, Nancy, France; 2SYMME, Université de Savoie, Annecy-le-Vieux, France; 3SIMAP, Université de Grenoble CNRS, Grenoble, France.
Email: *remi.boissiere@univ-lorraine.fr
Copyright © 2013 R. Boissiere et al. This is an open access article distributed under the Creative Commons Attribution License, which permits unrestricted use, distribution, and reproduction in any medium, provided the original work is properly cited.
Received September 26, 2013; revised October 29, 2013; accepted November 12, 2013
Keywords: Tension; Expansion; Image Correlation; Magnesium Alloys; Strain Measurements; 3D Digitization; Hemispheric Punch; Deep-Drawing
ABSTRACT
Lightening structure is one of the goals of many fields of research. As a result, magnesium alloys are studied due to their low density. However, one drawback of these alloys is their low formability at room temperature due to their hexagonal closed-packed structure. In the present work, the forming capacity of an AZ31 Mg alloys has been studied using a mini deep-drawing device, image correlation techniques and tests (tension and expansion) at temperatures contained between 20˚C and 200˚C. To investigate formability limits of Mg alloys in expansion, major and minor strains data were generated using hemispherical punch tests and analyzed with 3D digital images correlation techniques. Thanks to images correlation, strains on the surface of the samples were observed by means of a double digitization of the sample in three dimensions before and after deformation by using stereoscopic vision and triangulation. Image correlations have also been used in 2D to measure strains on the surface of the tensile test samples. These tests gave interesting information on the evolution of various parameters such as hardening coefficient, strain rate sensitivity parameter, and Lankford coefficient, which may affect the behavior of the alloys. Finally, the forming limits in both configurations (tension and expansion) were compared and discussed.
1. Introduction
Magnesium alloys have a renewal of interest in research due to their light weight and quite high specific strength. However, forming of wrought magnesium sheets still limits the development of Mg alloys because of the low deformation capacity at room temperature due to the hexagonal closed-packed structure. Determining the forming limits of these alloys is then a priority. Several methods can be used to identify such forming limits as they can be determined via different strain situations. The most widely used method to test materials is the tensile tests, but multi-axial tests must be realized as behaviors might be slightly different from one situation to the other. In this paper, interest is given to the establishment of the forming limits diagram in the case of an AZ31 (Mg-3Al- 1Zn, wt.%) alloy thanks to tensile and deep-drawing tests. These tests were performed using images correlation techniques. In the case of multi-axial solicitations, the forming diagram is drawn using the major and minor strains observed at the surface of the sample. Data related to Forming Diagram have been reported in the literature (see for instance [1]). Ghosh et al. [2] and Shu et al. [3] have underlined that the maximal strains are depending on the punch geometry. Boissiere et al. [4] completed this study by showing that scale has a little effect on the limit strains when using a spherical punch. In the present work, to investigate formability limits of Mg AZ31, major and minor strains data were generated using hemispherical punch tests. Both tensile and deep-drawing devices allow undertaking tests at various temperatures. As those two types of strain situations give slightly different results, it is of interest to try to understand the reason of the differences between uni-axial tension and multi-axial.
2. Experimental Devices
2.1. Material State and Important Factors
The studied AZ31 alloy was obtained as a rolled sheet displaying a grain size close to 10 µm. The rolling of the metal sheet gives it a marked anisotropy in mechanical properties. This strain anisotropy was measured by the Lankford coefficient r defined as follows:
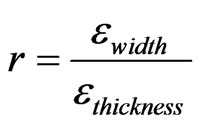
This factor is important for strain capacities as it drives the thickness reduction that leads to the fracture of the specimen. It will be seen that this is a key factor for comparing tension and expansion capacities. Rolling also gives a strong fiber texture to the alloy which has some effect on mechanical properties. Two other important factors are studied here: hardening coefficient n and strain sensitivity factor m that are controlling the material behavior with a relative influence mostly depending on temperature.
2.2. Mechanical Devices
1) Tensile tests The main tool used to characterize materials, and especially metallic alloys, is tensile test. To carry out these tests, a 50 kN Instron tensile test machine was used with the help of a camera system to measure displacements in order to calculate strain fields. The settings of the machine allowed driving it at a constant displacement rate. The chosen geometry was an aeronautical standard. In order to study anisotropic effects, samples were machined according to various orientations towards the rolling direction (0˚ for rolling direction and 90˚ for transverse direction).
2) Deep-Drawing Tests An original deep-drawing device was developed and adapted on the tensile test machine. This system allowed testing small samples with a punch diameter between 1 and 10 mm. On this device, the punch was fixed and the sample was clamped between the blank holder and the die. This assembly was moved up at a constant velocity of 1 mm/min that is close to the one used in tension. This tooling has two interesting features: first, it works in tension (preventing buckling), secondly it keeps constant the distance between the punch and the fixed camera. This last point is essential if strains are measured by using only one camera (for flat punch applications). A layer of PTFE was inserted between the specimen and the punch in order to limit friction. The thickness of the sheet used, which was initially of 2 mm was reduced to 0.5 mm by using electro-spark cutting techniques. In order to obtain various strain distributions, samples were not necessary circular.
2.3. Strain Measurement Tools
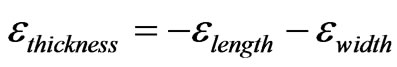
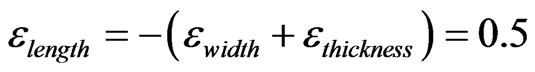
1) Tensile measurements in 2D Multiple tests realized on AZ31 alloys showed that strains were almost never homogeneous along the sample. This heterogeneity was more important for high strains. Whereas a conventional extensometer would only give average results, image correlation technique allows obtaining longitudinal and transversal strain for a huge number of locations in the sample that exhibit either uniform or non-uniform strain. Strain in the thickness can then be estimated with the formula assuming a constant volume:
It is then possible to confirm that the main strain direction in the tensile sample is confused with the longitudinal one. Figure 1 shows an example of strain distribution on a “nearly fractured” specimen with x,y, the plan corresponding to the initial image plan and the z axe showing longitudinal local strains.
This figure shows that the mechanical behavior of a metallic alloy is not limited to its macroscopic behavior. To describe a material behavior, two types of strains are studied: the maximal local strain and the average strain of the material.
2) Expansion measurements in 3D Strain fields on the surface were obtained by using images correlation techniques and stereoscopic visions. With this system allowing access to bi-axial stretching, it will be shown in the following that various strain distributions exist. 3D measurement is adapted to determine the whole range of these strain situations. The chosen comparisons were realized by exploiting these strain fields calculated between the state of the sample before deformation and after the apparition of the first crack. Displacement field measurements and calculation of
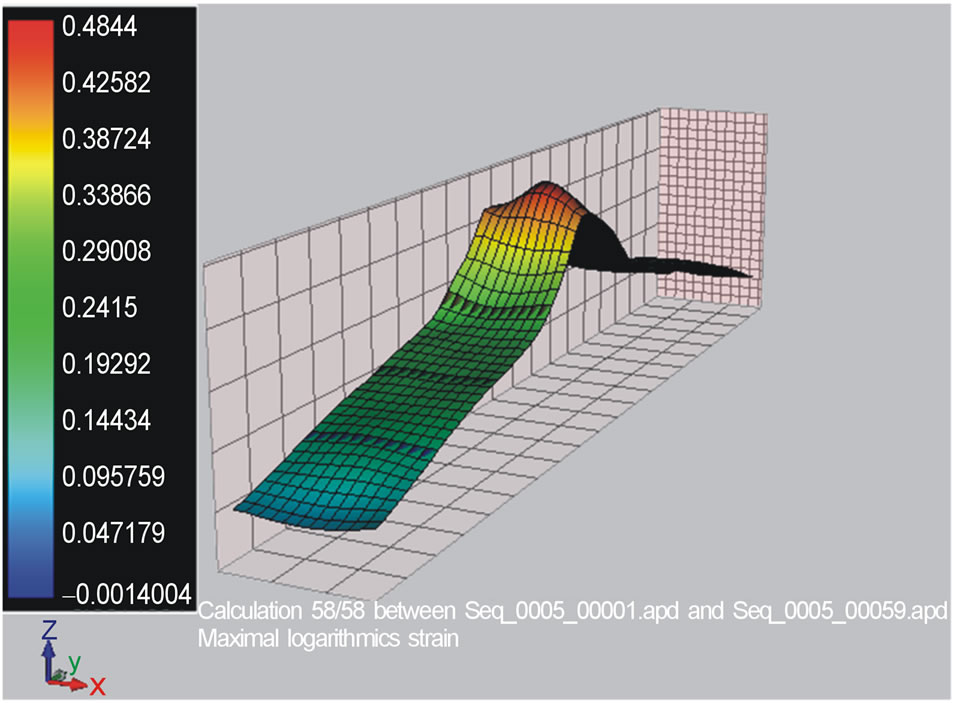
Figure 1. Local longitudinal strain distribution on each point of an AZ31 90˚ sample tested in tension showing significant necking.
strain fields along non planar surfaces requires a double 3D digitization of this part before and after the forming operation. Correlation software “7D” developed by P. Vacher et al. [5] was used. In the present investigation, forming diagrams (Emax − Emin) will be shown as comparison results with Emin corresponding to the minimal principal strain and Emax related to the maximal principal strain.
3. Results from Tensile Tests
3.1. Formability at Room Temperature
Details concerning the results provided here can be found in [6]. As image correlation was used, it was possible to have access to all strains on the surface of the sample. Samples were deformed until a strain of 0.27 for 90˚ samples and 0.22 for 0˚ sample (average strain, Figure 2) and 0.35 (0˚) to 0.5 (90˚) (maximum strain, Figure 1). These results were completed by measurements of the hardening coefficient n, strain rate sensitivity factor m and the Lankford coefficient r, as described in paragraph 2.1. Concerning the effect of strain rate, results have shown that m is very low (0.03) and has consequently little expected effect on the behavior of the material at room temperature. The hardening effect has to be taken into account as its value is not negligible and is close to 0.2, independently of the orientation. As a consequence, anisotropy is only detectable by a variation of the elastic limit and the Lankford coefficient. For 0˚ samples, the elastic limit is 150 MPa and r is close to 2 whereas for 90˚, the elastic limit is 170 MPa and r is closed to 4. This difference is a result of the non-symmetry of the fiber texture. It has been observed that 90˚ sample displays larger deformation than the 0˚ one. It can be observed that higher Lankford coefficient provide higher strain. It is then possible to assume that fracture is controlled by the thickness reduction.
3.2. Effect of Temperature on Strain Capacities during Tension
Hexagonal closed-packed structures and especially Mg wrought alloys are known to exhibit low ductility. As a consequence, one of the factors that can improve formability is an increase of forming temperature. Figure 3 displays the effect of temperature (up to 400˚C) on the stress – strain curves in tension when the alloy is deformed at a constant strain rate equal to 6 × 10⁻⁴·s−1. As expected, strain to fracture increases with the temperature. When the temperature is higher than 200˚C, it has been shown that new mechanisms of deformation could be activated in the studied alloy, involving new slip systems (than the basal system which is preferentially activated at room temperature), dynamic recrystallization or even grain boundary sliding for the upper studied
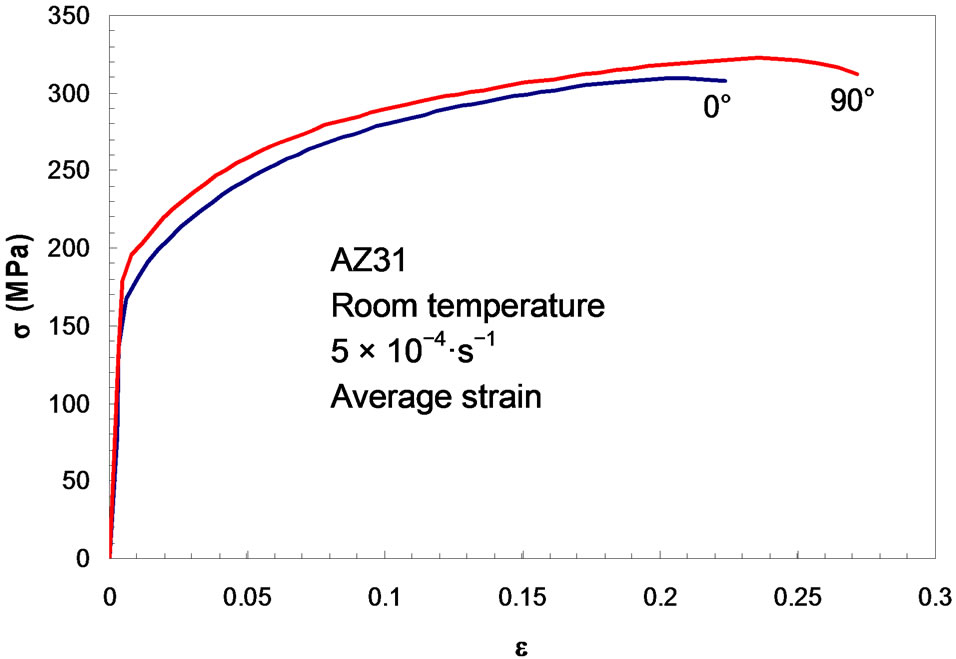
Figure 2. Tensile test curves for two orientations 0˚ and 90˚.
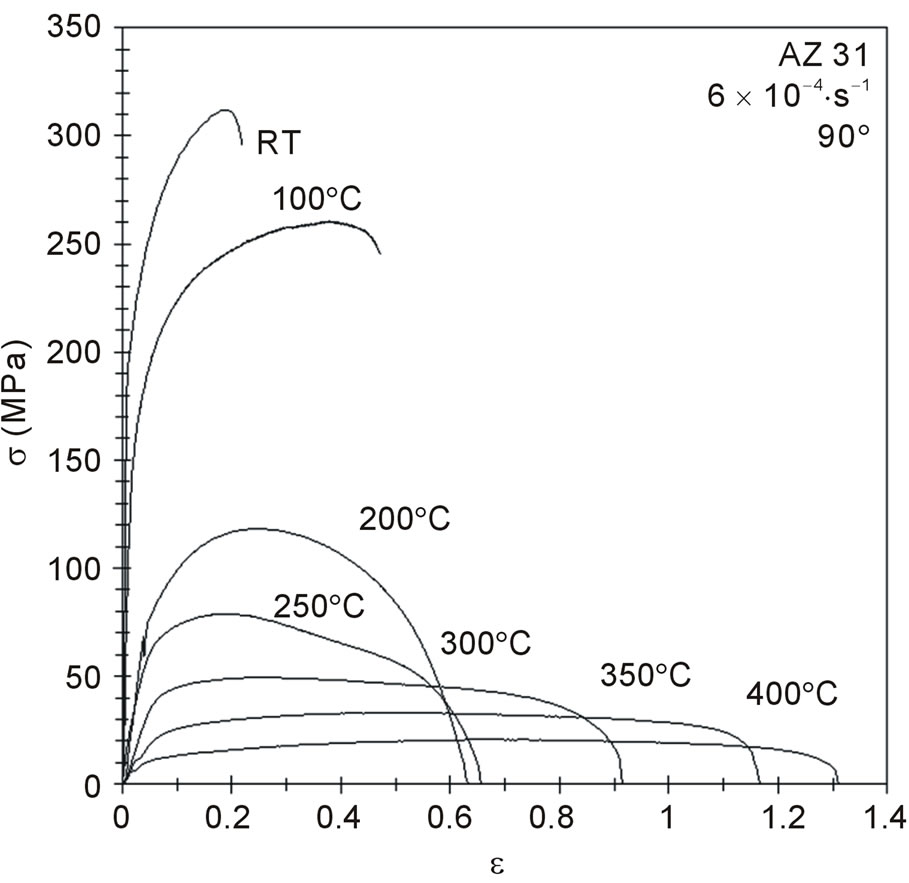
Figure 3. Tensile test curves at different temperatures (90˚ orientation).
temperatures. The raise of temperature induces a variation of the parameters m and n. As temperature is increasing, the strain rate sensitivity m is increasing and becomes a key parameter of the improvement of formability of the specimen. The hardening effect is still active but becomes less essential for the forming of the material.
4. Results from Expansion Tests
4.1. Room Temperature Results
Details concerning these results can be found in [6]. Deep-Drawing tests were carried out using a hemispherical punch and 3D images correlation. This method allows to measure strains on the surface. Figure 4 displays a forming diagram with the maximal surface strain called Emax and the minimal surface strain named Emin. Thanks to image correlation, a set of points is obtained to cover many strain situations. Then, the calculation of the strain in the thickness is performed as follows Emax + Emin = −Ethickness. From this equation, it can be deduced that the highest strain is the one in the thickness when tested in expansion. Figure 4 shows a forming diagram with strain distribution from tensile situation (sample at 90˚ from the rolling direction, room temperature) to expansion and it can be seen that expansion strain capacities are limited to 0.1. What can be observed here is that the limits in tension are much higher than the ones in expansion. As the hardening coefficient is not affected by the anisotropy of the material, it can be assumed that its effect is the same for both types of solicitations as expansion can be described as multi-axial tension. As the strain rate sensitivity parameter is very low, it is expected to have a very limited effect on multi-axial forming.
4.2. Effect of Temperature on Expansion
Thanks to the mini deep-drawing device deep-drawing tests were performed for temperatures up to 200˚C. The results presented Figure 5 show only the behavior of points that exhibits a near expansion situation.
As magnesium alloys are often compared to aluminum ones, it is of interest to show also points corresponding to the behavior of an Al 2024 alloy tested at room temperature [4]. It can be observed that at room temperature, aluminium is able to support significantly higher strains than the AZ31 alloy, but, it also revealed that the forming capacity of the magnesium alloy for a temperature as low as 200˚C could overpass the forming capacity of the Al 2024 alloy at room temperature. At 200˚C the strain rate sensitivity parameter m is close to 0.2 which leads to improve the formability of the material as much as the effect of the hardening coefficient (0.2 at room temperature) as n is decreasing when temperature is increased.
5. Comparison and Discussion
Results have shown that important differences in strain limits could be observed between tensile and expansion conditions. For instance, Figure 4 showed that the strain observed at the surface was significantly higher for the uni-axial tension than for the multi-axial tension. Various explanations can be suggested as many factors can affect the formability of such alloys. Three main factors controlling strain capacities have been studied: the hardening coefficient n, the strain rate sensitivity m, and the Lankford coefficient r. First of all, it has been underlined that hardening is controlling strain capacities at room temperature whereas strain rate sensitivity has a main role when temperature is increasing. Despite the fact that these two factors are affecting the limit strain, their study is not likely to explain the differences between limit strains in tension and expansion as no variations have
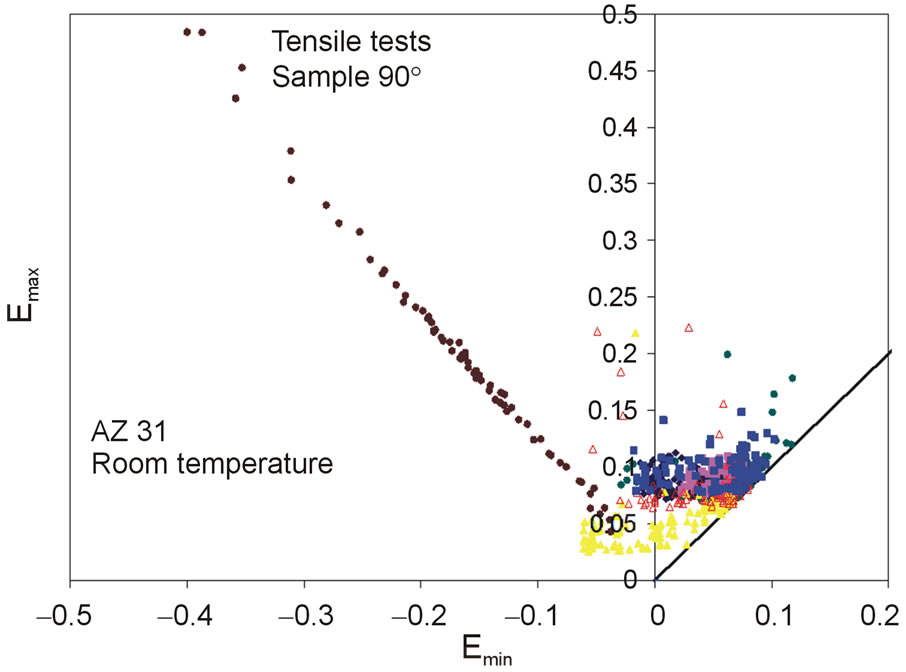
Figure 4. Forming diagram with local strain situations from tension to expansion.
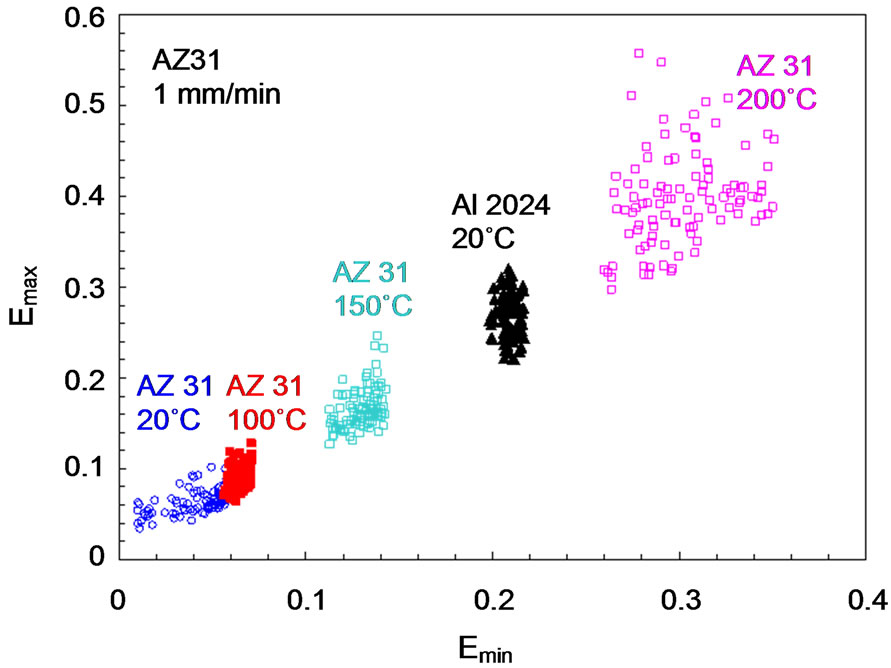
Figure 5. Forming diagram with local expansion situation in function of temperature.
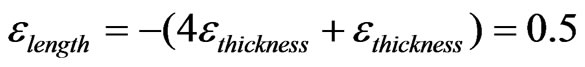
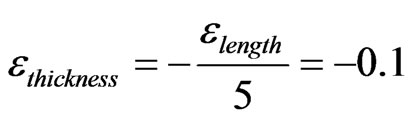
been detected in these parameters when changing from one solicitation to the other one. Indeed, it has been shown that m has little effect at room temperature and n shows no variation when changing the strain direction toward rolling direction (0˚ and 90˚). As a consequence, it is of interest to detail the role of the Lankford coefficient on the forming limits. It has been underlined that the fracture is mainly controlled by the variation of thickness. Thus, Lankford coefficient plays an efficient role to postpone fracture in tensile tests. Eventually, the width reduction can be much higher when r grows and consequently the reduction of thickness is more limited. Another explanation can be found when looking at true strains in the thickness. Concerning tension, if we consider that 0.5 (90˚) and 0.3 (0˚) are the limit longitudinal strain; one can detect the strain in the thickness. For transverse samples (90˚) and a Lankford coefficient equal to 4 (εwidth = 4 εthickness),
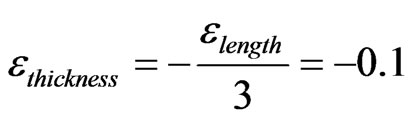
For longitudinal samples (0˚) and a Lankford coefficient equal to 2 (εwidth = 2 εthickness):
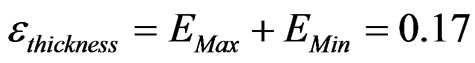
This observation suggests that the forming limit behavior of these types of alloys is preferentially guided by the thickness strain. Now, if one have a look on the strain in the thickness induced by expansion and considering strains on the surface Emax (0.1) and Emin (0.07), it leads to:
As a consequence, AZ31 sheets can support a higher deformation in the thickness under expansion than in tension. The appearing strong limits detected in expansion deals with the facts that only surface strains are measured. Concerning the temperature effect, it is interesting to consider the variation of anisotropy (r coefficient) since we saw that a high value of the Lankford coefficient could have a beneficial effect on deformation in tensile situations. Figure 6 shows a reduction of r when the temperature is increasing. The reduction of r is supposed to limit the strain capacities in tension. However, it was underlined that strain rate sensitivity parameter is controlling forming limits at high temperature in tension. As a consequence, forming limits are raised due to this new effect which remains negligible at room temperature but which can activate new mechanisms. Concerning the comparison with expansion, the lowering of r means that the material tends to exhibit a nearly isotropic behavior at high temperature (T ³ 250˚C). If one consider the temperature studied here (25˚C - 200˚C), Lankford coefficient is roughly varying from 4 to 1.5. As
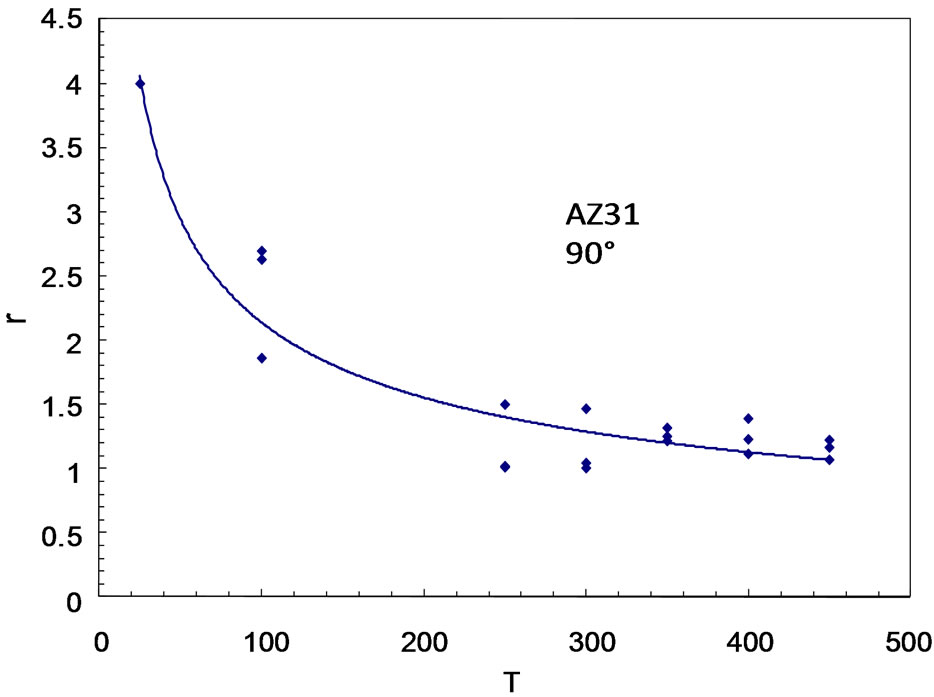
Figure 6. Variation of Lankford coefficient r with temperature T.
a consequence, differences observed between tension and expansion behavior must be lowered. In tension, a longitudinal strain of 0.6 is obtained whereas it is limited to 0.4 in expansion. The limits are converging when temperature rises, as the reduction of r provides a leveling of the strain observed on the surface in various solicitations. As a consequence, is can be assumed that the Lankford coefficient r contributes to the observed differences of surface strains limit between uni-axial tension and multiaxial tension.
6. Conclusion
The objective of this work is to try to understand the differences of behavior of an AZ31 wrought magnesium alloy between tensile behavior and expansion behavior. Tests have been realized using image correlation techniques, 3D digitization, and an innovative mini deepdrawing device. It appears from the results and discussions that the strain anisotropy (Lankford coefficient r) of the material plays a major role in the strain capacities of these alloys.
REFERENCES
- G. Reyes and H. Kang, “Mechanical Behavior of Lightweight Thermoplastic Fiber-Metal Laminates,” Journal of Material Processing Technology, Vol. 186, No. 1-3, 2007, pp. 284-290. http://dx.doi.org/10.1016/j.jmatprotec.2006.12.050
- A. K. Ghosh and S. S. Hecker, “Stretching Limits in Sheet Metals: In-Plane versus Out of Plane Deformation,” Metallurgical and Materials Transactions B, Vol. 5, 1974, pp. 2161-2164.
- E. Hsu, J. E. Carsley and R. Verma, “Development of Forming Limit Diagrams of Aluminum and Magnesium Sheet Alloys at Elevated Temperatures,” Journal of Materials Engineering and Performance, Vol. 17, No. 3, 2008, pp. 288-296. http://dx.doi.org/10.1007/s11665-007-9196-y
- R. Boissière, P. Vacher and J. J. Blandin, “Influence of the Punch Geometry and Sample Size on the DeepDrawing Limits in Expansion of an Aluminium Alloy,” International Journal of Forming, Vol. 3, Suppl. 1, 2010, pp. 135-138. http://dx.doi.org/10.1007/s12289-010-0725-0
- P. Vacher, S. Dumoulin, F. Morestin and S. MguilTouchal, “Bidimensional Strain Measurement Using Digital Images,” Proceedings of the Institution of Mechanical Engineers, Part C: Journal of Mechanical Engineering Science, Vol. 213, No. 8, 2010, pp. 811-817.
- R. Boissière, “Effet de la Temperature sur les Capacités de Mise en Forme d’Alliages de Magnésium Corroyés,” Ph.D. Thesis, Grenoble University, Grenoble, 2008.
NOTES
*Corresponding author.