Journal of Modern Physics
Vol.4 No.2(2013), Article ID:27713,8 pages DOI:10.4236/jmp.2013.42022
Decaying of Nitrogen Second Positive System by Addition of H2 Gas in Air DB Discharge
1Center of Plasma Technology, Al-Azhar University, Cairo, Egypt
2Physics Department, Faculty of Science, Al-Azhar University, Cairo, Egypt
Email: felakshar@yahoo.com
Received October 19, 2012; revised November 26, 2012; accepted December 5, 2012
Keywords: Nitrogen Second Positive; DBD; H2 Addition; Intensity Decaying
ABSTRACT
Effects of addition of H2 gas in air DB discharge on its optical and electrical characteristics have been studied. Optical emission spectroscopy is used to investigate the effect of hydrogen admixing on the emission intensity of the nitrogen second positive systems (300 - 420 nm) and the relative population density of  states. An obvious decaying of the emission intensity of the nitrogen second positive bands with the introduction of H2 has been observed. It has been concluded that quenching of the nitrogen excited state
  is the responsible reason of this decaying. Mechanisms of excitation and ionization processes of nitrogen molecules in this mixture have been studied. Processes which are responsible for the decaying of the population density of
  have been reported. Addition of H2 to air improves the electrical characteristics of the DB discharge. An abrupt increasing in the electron density, reached about thirty fold at H2 flow rate of 3 L/min, as a result of increasing the ionization processes has been reported. The breakdown voltage of the discharge decreased from 1.87 kV to about 1.25 kV by the addition of H2 at flow rate of 3 L/min.
1. Introduction
It is known that the working conditions in the plasma may be affected, considerably, by the addition of small amounts of some molecular gases beside the working gas [1]. Recently, several experiments have been conducted already by various research groups, for studying the effects of adding of small amount of molecular gases in the discharge. The analytical parameters, such as the effective sputtering rate, the emission intensity of several spectral lines and the electrical current, have been affected by the addition of foreign gases to the operating gas. Mixed plasma gases may not always exert a positive influence on the analytical performance of the discharge characteristics, although it can be a possible option to improve the analytical performance [1].
The description of gas excitation in various plasmachemical systems can be developed via the analysis of the population dynamics of reference levels for which rate constants of population by electron impact and following depopulation are well known. In the case of air DB discharge plasma, one such reference level is the  state of
 ; its population determines radiation intensity of the 2+ nitrogen system transition
  in discharges with N2. The short radiative lifetime
  and relatively high excitation rate of this level make this transition suitable for diagnostics of the stationary plasma [2].
In the present paper the effect of addition of H2 gas to air DB discharge on the optical and electrical characteristics is studied. These effects including the emission intensity of the nitrogen second positive systems (300 - 420 nm) and the relative population density of  states. Mechanisms of excitation and ionization processes of nitrogen molecules in this mixture are also studied.
2. Experimental Set Up
A DBD (dielectric barrier discharge) system, consists of two copper plane-parallel electrodes immersed in porous dielectric plates made of commercial gypsum (CaSO4∙2H2O) material, has been used to produce an atmospheric pressure air discharge. The diameter of the dielectric plates was about 4 cm and its thickness was 2 mm. The distance between the two dielectric plates was kept constant at 1.1 mm. Hydrogen gas has been injected between the two electrodes at flow rates of (1 to 3) L/min. The discharge open reactor was started up using a high voltage transformer (1 to 10 kV), generates sinusoidal voltage with frequency of 50 Hz. The applied potential (Va), and the discharge current (I) were recorded using a digital oscilloscope (HAMEG HM407 - 40 MHz). The current was measured using a voltage drop across the resistance R1 (= 100 Ω) (see Figure 1).
An optical emission spectroscopy (OES) technique consists of a McPherson scanning monochromator [model 270] with a grating of 1200 grooves mm−1 and resolution of less than 2 Å has been used to study the nitrogen spectra in a wavelength range of 300 - 420 nm. The monochromator was then connected to photomultiplier tube (PMT) type 9558 QB, which has a resolution time of less than 1 nanosecond, working at voltage of 1200 volts.
3. Results and Discussion
3.1. The Discharge Characteristics
Atmospheric pressure DB discharge can be operated in three different modes namely; the filamentary mode (streamers mode), the glow discharge mode (APGD mode) and the quasi-glow discharge mode. Figure 2 represents the voltage-current waveform of the atmospheric pressure discharge in air at applied voltage of 3 kV and frequency of 50 Hz. Quasi-glow discharge mode has been generated whenever the dry gypsum porous dielectric material was used. The quasi-glow mode is characterized by the uniformity of the discharge current with only small filaments superimposed on the glow component [3-5].
3.2. Optical Emission Spectroscopic (OES) Characteristics
3.2.1. Effect of H2 Addition on the Intensity of the Emitted Spectra
Typical emission spectra of the air DB discharge are shown in Figures 3(a)-(d) in the range of wavelength of (300 - 420 nm). Figure 3(a) shows the intensity of the nitrogen second positive systems in air discharge without admitting hydrogen gas. The second positive system is
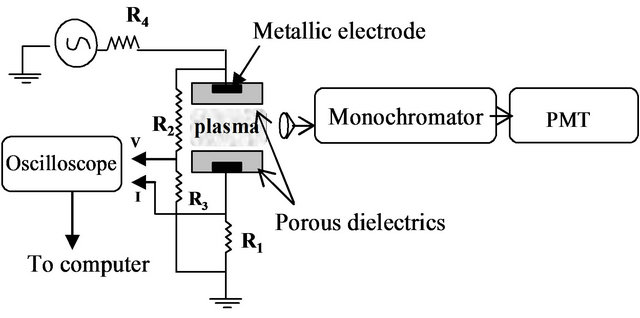
Figure 1. Schematic diagram of the discharge cell.
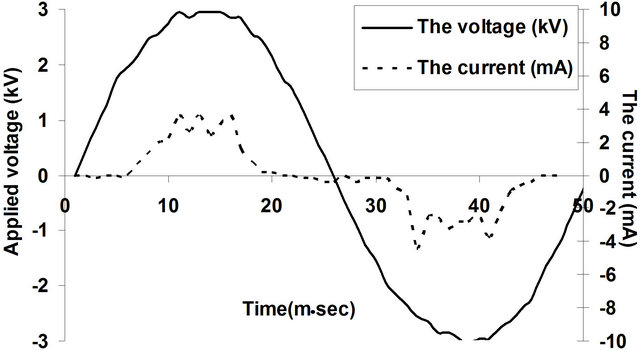
Figure 2. Voltage and current waveforms of air discharge using porous gypsum plates as barriers on the two electrodes, d = 1.1 mm and V = 3 kV.
related to the de-excitation transitions of molecular nitrogen from the  excited electronic state
  to the low-laying
  excited state
  according to: (Equation (1)), [6,7].
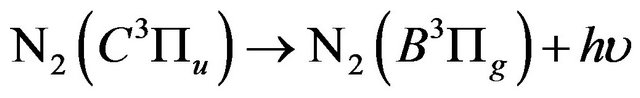 (Second positive) (1)
 and
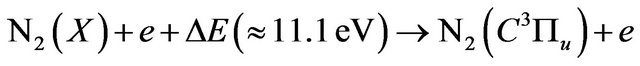
and  states are lying at 7.4 and 11.0 eV respectively, above the ground electronic state. According to a simple analytical calculation for the electron mean energy in the atmospheric pressure, non-thermal plasma is estimated to be about (2 - 5) eV. Therefore the electronic states of the background molecules can be excited by the high-energy electrons in the tail of the Boltzmann distribution according to Equation (2), [8].
 (2)
(2)
Figure 3(a) shows that a relatively large number of N2 molecules are excited in the plasma, and hence strong emission spectra in the wavelength region of 300 - 400 nm are observed [8,9].
Figure 3(a) indicates that a weak intensity of  first negative transition is also observed. This transition is related to the radiative decay of the excited nitrogen ion
 . The excited nitrogen ions results from the following two steps equations i.e. (3) and (4) [10]:
 (3)
(3)
 (4)
(4)
The de-excitation of  will followed by the emission of nitrogen First negative systems according to Equation (5), [10]:
 (First negative) (5)
Effect of addition of H2 on the intensity of emitted spectra is shown in Figures 3(b)-(d). It is noticed that:
1) There is an obvious decreasing in the intensity of the nitrogen second positive system by the addition of H2
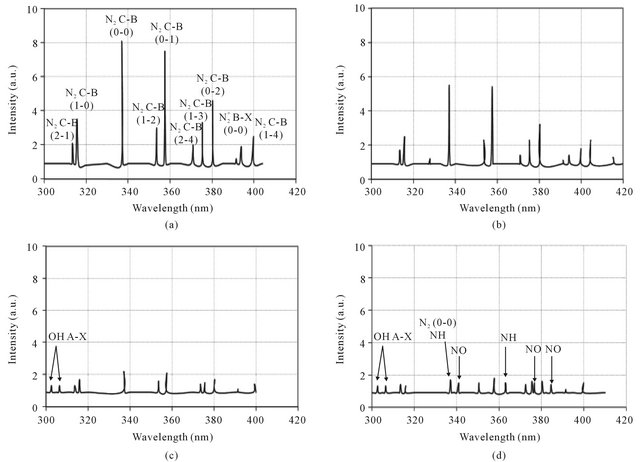
Figure 3. Typical emission spectra of air DB discharge in open air (a) and with addition of H2 gas at flow rates 1 L/min (b), 2 L/min (c) and 3 L/min (d) where the discharge current is 1 mA.
gas, (see Section 3.2.2).
2) New species such as OH , NO and NH are observed in Figures 3(c) and (d). This can be related to the fact that increasing of H2 flow rate in air discharge gives rise to increase the dissociation processes of the nitrogen, hydrogen and oxygen molecules to form other species such as NO, OH and NH. NO radical is formed as a result of the dissociation of O2 and N2 by electron impact [11,12] according to Equations (6) and (7) and then re-combination of oxygen and nitrogen occurs (Equations (8) and (9)) [13]; i.e.
 (6)
(6)
 (7)
(7)
 (8)
(8)
 (9)
(9)
while the species NH and OH are formed according to the following equations;
 (10)
(10)
then
 (11)
(11)
 (12)
(12)
3) No hydrogen lines are observed in Figures 3(b)-(d) e.g. (at 656.2 nm),
  (at 486.1 nm) or
  (at 434 nm). The disappearing of hydrogen lines is related to the exhausting of their excitation energy in the Penning ionization processes rather than the radiated decaying processes (see Section 3.3).
3.2.2. Effect of H2 on the Decay of Nitrogen Second Positive System
The pronounced decay of the nitrogen second positive system  is attributed to:
1) Reducing the mean electron energy by the addition of hydrogen molecules to air discharge;
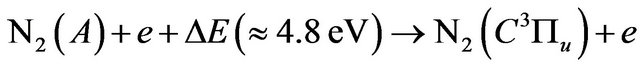
According to the fact that the dissociation energy of the hydrogen molecule (4.3 eV) is very low compared with that of the nitrogen (9.8 eV) or oxygen (5.11 eV) molecules, a considerable amount of electron energy is dissipated in the dissociation process of hydrogen molecules, Equation (10). As a result, the mean electron energy is reduced with the addition of H2 to air discharge. Meanwhile, the production processes of  either by direct electron impact, Equations (13) and (14), or by the pooling reaction, Equation (15), is reduced.
 (13)
(13)
 (14)
(14)
 (15)
(15)
2) Reducing the formation of nitrogen excited molecules ;
;
The dissociation processes of N2 molecules increase by the increasing of H2 to form another species such as NH and NO, etc. This in turns decreases the density of nitrogen molecules in the ground state that collide with the electrons to form the nitrogen excited molecules  , (Equation (2)), that are responsible for the emission of nitrogen second positive system according to Equation (1).
3) Quenching of the formed  excited states before undergo the spontaneous emission to the lowlaying
  excited state;
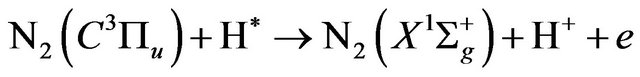
This quenching is due to the collision of the nitrogen excited molecules  with N2 or with other quenchers such as molecular hydrogen or oxygen respectively according to the collisional deactivation processes, Equation (16), [2] and its excited energy is exhausted in other reactions such as the dissociation of oxygen, Equation (17), [14] or hydrogen (H2), Equation (18), [15] and [16], or excited hydrogen (H*), Equation (19). The formed water (H2O), by the re-combination of H2 and O, is considered as a quencher for
  [2]:
[2]:
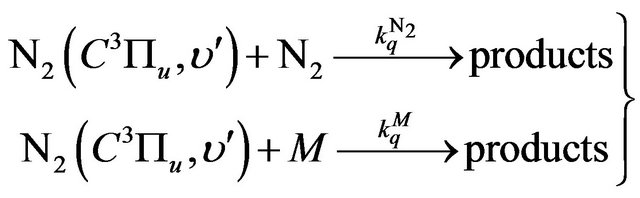 (16)
(16)
where  is the quenching rate constant of
  by N2 and
  is the quenching rate constant of
  by M molecule, where M is O2, H2, H* or H2O.
 (17)
(17)
 (18)
(18)
 (19)
(19)
The quenching mechanism of the nitrogen  is confirmed by using the Stern-Volmer Equation (20), [16,17] i.e.:
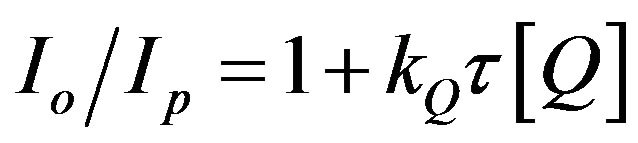 (20)
(20)
where Io and Ip are the intensities of the special bands system in the absence and the presence of the quencher (which is H2 in the present study), respectively, [Q] is the concentration of the quencher,  is the lifetime of the nitrogen excited state, and kQ is the quenching rate constant. In the present work, the hydrogen concentration can be represented by its flow rate in air. Therefore, by plotting the ratio
  vs the hydrogen flow rate, the quenching efficiency of the different bands of the nitrogen second positive system is estimated. Figure 4 represents the Stern-Volmer plot of three selected bands of the nitrogen second positive system e.g. 313.6, 315.9 and 337.1 nm (life times
  39 × 10−9, 41 × 10−9 and 42 × 10−9 s) respectively [2].
The quenching rate of the band 337.1 nm (0 - 0) is the highest one (Figure 4), therefore, it is expected that the different quenchers prefer to react with this band rather than the other bands.
Figure 5 represents the effect of H2 flow rate, in air DB discharge, on the intensity of the most popular nitrogen second positive band which (337.1 nm). A pronounced decaying of the intensity of this band by the increasing of H2 flow rate is observed. The intensity of the NH band, at wavelength of 336 nm, is overlapped with that of the main band 337.1 nm.
3.2.3. Effect of H2 Flow Rate on the Population Density of the Nitrogen Upper State 
In order to study the effect of addition of H2 to air
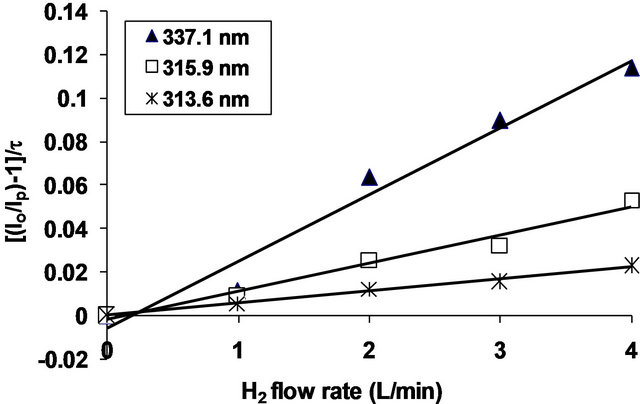
Figure 4.  as a function of H2 flow rates.
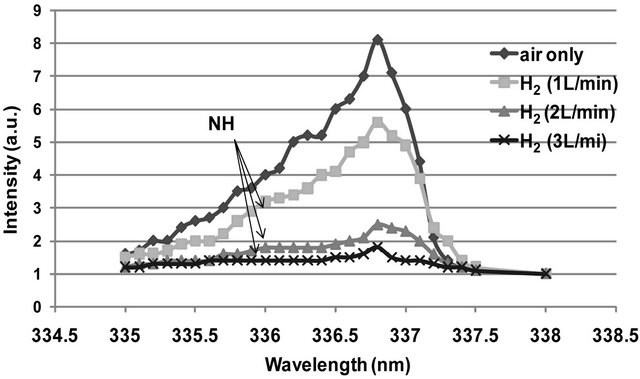
Figure 5. The emitted intensity of the nitrogen second positive band 337.1 nm at different H2 flow rates.
discharge on the population density of the excited nitrogen states , Equation (21), which relates the intensity
  of the
  band of the system to the population density
  of the excited state has been used [17] i.e.:
 (21)
(21)
where D is an instrumental constant;  is the quantum energy involved in the transition
 ,
,  is the frequency corresponding to the given band;
  is the electronic transition moment;
  is the FranckCondon factor for the transition, both latter quantities are theoretically constant.
Figure 6 shows the normalized population density of , which is represented by the ratio
with and without addition of hydrogen to air discharge.
Figure 6 indicates a pronounced decay of the nitrogen population density of , by increasing the H2 flow rate up to 2 L/min, then it saturates. The nitrogen population density decay confirms the quenching processes of the nitrogen
  excited molecules (see Section 3.2.2).
3.3. Effect of H2 Addition on the Electrical Characteristics of the Air Discharge
Figure 7 represents the voltage-current waveforms of the DB discharge using dry Gypsum dielectric material at hydrogen flow rates of 0, 2 and 3 L/min and using applied voltage of 3 kV at 50 Hz. Addition of hydrogen with different flow rates increases the peak current from (≈3 mA) without H2 up to (≈13 mA) with H2 at flow rate of 3 L/min.
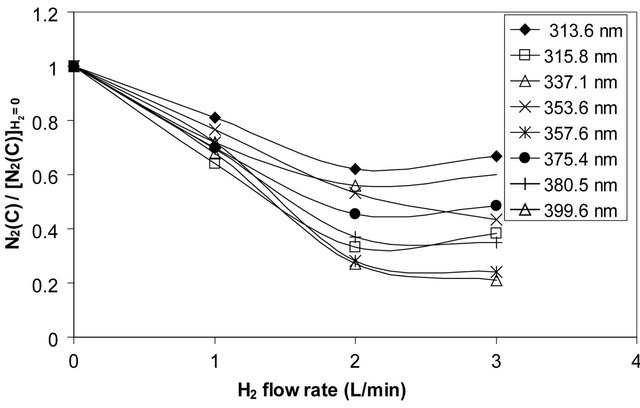
Figure 6. The normalized population density of nitrogen the upper state  as a function of H2 flow rates in air discharge.
Figure 8 shows the peak values of the discharge current as a function of the applied voltage in air without and with addition of H2 at different flow rates. Figure 8 confirms that increasing of the H2 flow rate up to 3 L/min will increase the electric current by about 60% at the same voltage.
The enhancement of the discharge current by increasing the amount of H2 is related to the following reasons;
1) More ionization processes are expected to take place in the present of H2 such as the reactions in Equations (19), (22)-(25) i.e.:
 (22)
(22)
 (23)
(23)
(H* here is the hydrogen metastable state which has life time of 0.12 sec [25]) then
 (24)
(24)
Also using Equation (7) then
 (25)
(25)
2) Addition of H2 to air discharge enhances the humidity of the porous dielectric that coated the electrodes.

Figure 7. Voltage-current waveforms of air discharge in quasiglow mode at applied voltage 3 kV at different flow rates of hydrogen gas.

Figure 8. V-I characteristic curve of the DB discharge in air without and with H2 at different flow rates.
This humidity resulted from the formation of OH and in turns promotes the formation of H2O molecules according to Equations (26)-(28) [18] i.e.
 (26)
(26)
 (27)
(27)
 (28)
(28)
Consequently, the humidity increases the current inside the micro-holes of the porous dielectric and hence increases the seed electrons that sustain the discharge in the glow mode [19].
3) Addition of H2 to air discharge at atmospheric pressure increases the probability of Penning ionization and energy transfer processes. Addition of H2 enhances also the dissociation processes of the molecular N2 and O2 (Equations (6) and (7)) to form large number of species, of different ionization and excitation energies. For example the product species NO, NH and O2 have ionization energies; of 9.25, 13.1 and 12.07 eV [20] which can be ionized by another excited species of excitation energies higher than these values. The required energy can be obtained from the excited hydrogen or nitrogen states such as ,
,  ,
,  and
and  . The threshold excitation energies (from the ground state) for these states are 12.09, 12.75, 13.06 and 11.1 eV [21] respectively. The hydrogen excited atoms exhausted their energies in ionization processes rather than in radiative decaying processes. This explains the disappearing of the hydrogen lines
  ,
,  and
and  in the observed spectra (Figure 3(b)-(d)).
Figure 9 confirms a decreasing in the breakdown voltage by increasing of H2 flow rate which is related to the increasing of the ionization processes by the addition of H2 to air discharge.
3.4. Effect of H2 Addition on the Electron Density in the Discharge
Figure 10 shows values of the electron density as a function of the hydrogen flow rate at applied voltage of 3 kV.
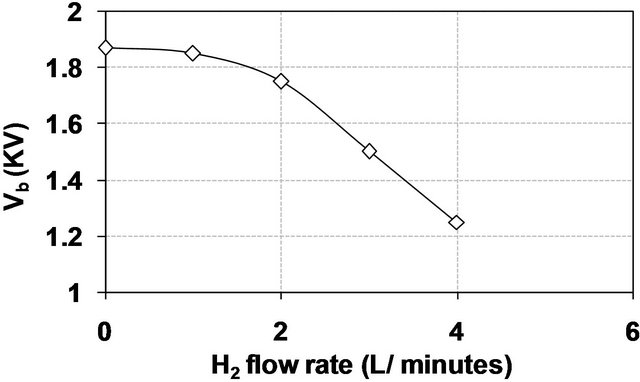
Figure 9. The breakdown voltage as a function of H2 flow rate in air DB discharge.
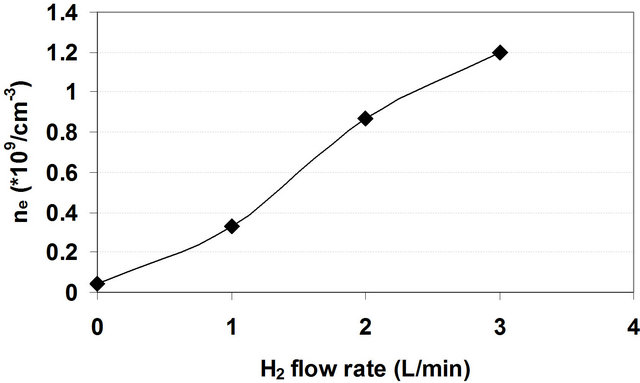
Figure 10. The electron density as a function of H2 flow rates at applied voltage of 3 kV.
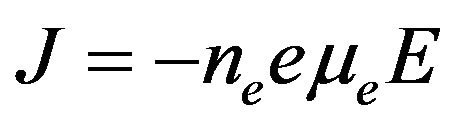
The electron density has been calculated using the electron conduction current density [22,23] i.e.:
 (29)
(29)
where J is the discharge current density, μe is the electron mobility and E is the electric field of the discharge region.
Using the data in Figure 8, at applied voltage of 3 kV, the applied electric field E on the two electrodes is 2.7 × 10⁴ V/cm. The electron mobility has been estimated by using Boltzmann solver, BOLSIG (KINEMA software) [24]. The software expresses the electron mobility as a function of E/P at a gas temperature of 300 K. In the present work E/P = 35.52 V∙cm−1∙torr−1, at this condition the mobility is found to be 5.13 × 102 cm2/V∙sec. The electron density was estimated by substituting values of E, μe, and J in Equation (29).
Figure 10 indicates that addition of H2 to air DB discharge causes an abrupt increasing in the electron density reached about thirty fold at flow rate of 3 L/min as a result of the mentioned increasing of the ionization processes.
3.5. Effect of H2 Flow Rate on the Total Optical Emission Intensity of the Discharge
The total optical emission intensity of the discharge as a function of time has been measured using the PMT at different H2 flow rates (= 0, 1, 2 and 3 L/min) in air discharge and at the same discharge current (~0.4 mA), see Figure 11.
The total emitted light decreases with the increasing of the H2 flow rate. Addition of hydrogen to air DB discharge plasma enhances the ionization processes, such as Penning ionization, which occurs mainly by the energy transferring between the excited species. Since the present work has been carried out at atmospheric pressure the excited species will exhaust their energies through such ionization processes rather than in radiative decayed processes.
4. Conclusion
Admixing of hydrogen gas, with different flow rates, to
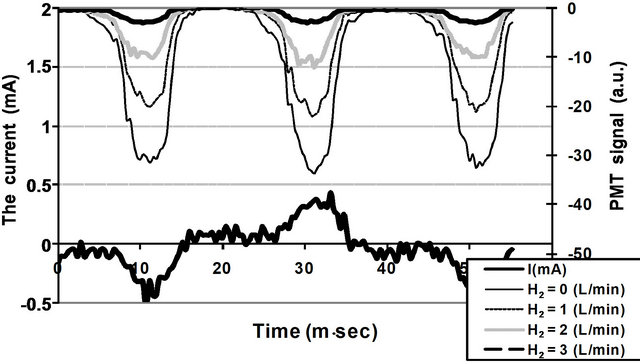
Figure 11. The Total optical emission intensity measured by a PMT and the discharge current as a function of time.
air DB discharge has an important effect on the optical and electrical characteristics of the discharge. An obvious decaying of the nitrogen second positive bands emission intensity was observed. This decaying of the nitrogen second positive bands resulted from the quenching of the nitrogen excited state . On the other hand, admixing the hydrogen to air discharge enhances the discharge current and in turns the electron density increases as a result of the increasing of the ionization processes e.g. the Penning ionization processes.
REFERENCES
- A. Bogaerts, “Hybrid Monte Carlo—Fluid model for studying the effects of nitrogen addition to argon glow discharges,” Spectrochimica Acta Part B: Atomic Spectroscopy, Vol. 64, No. 2, 2009, pp. 126-140. doi:10.1016/j.sab.2008.11.004
- S. V. Pancheshnyi, S. M. Starikovskaia and A. Yu. Starikovskii, “Collisional Deactivation of N2(C, v = 0, 1, 2, 3) States by N2, O2, H2 and H2O Molecules,” Chemical Physics, Vol. 262, No. 2-3, 2000, pp. 349-357. doi:10.1016/S0301-0104(00)00338-4
- N. N. Morgan, A. Samir, A. A. Garamoon and Al-Azhar Bull, Special Issue, 2009, pp. 83-93.
- S. J. Scott, C. C. Figgures and D. G. Dixon, “Dielectric Barrier Discharge Processing of Aerospace Materials,” Plasma Sources Scientific Technology, Vol. 13, No. 3, 2004, pp. 461-465.
- A. A. Garamoon, D. M. El-Zeer, A. A. El-Ghany, D. Ghoneem and F. El-Hossary, “The European Physical Journal Applied Physics,” The European Physical Journal Applied Physics, Vol. 53, No. 2, 2011, 6 p. doi:10.1051/epjap/2010100196
- S. V. Pancheshnyi, S. M. Starikovskaia and A. Yu. Starikovskii, “Influences of the Barrier Types and Arrangements on Dielectric Barrier Discharge Characteristics,” Chemical Physics Letters, Vol. 294, No. 2, 1998, pp. 523- 527. doi:10.1016/S0009-2614(98)00879-3
- D. M. El-Zeer, N. Dawood, F. Elakshar and A. A. Garamoon, “The Influence of the Addition of Argon Gas to Air DB Discharge,” The European Physical Journal Applied Physics, Vol. 58, No. 3, 2012, 8 p. doi:10.1051/epjap/2012120022
- D. N. Shin, C. W. Park and J. W. Hahn, “Methane Conversion in Pulsed Corona Discharge Reactors,” Bulletin of the Korean Chemical Society, Vol. 21, No. 2, 2000, pp. 228-232
- R. Brandenburg, H.-E. Wagner, A. M. Morozov and K. V. Kozlov, “Axial and Radial Development of Microdischarges of Barrier Discharges in N2/O2 Mixtures at Atmospheric Pressure,” Journal of Physics D: Applied Physics, Vol. 38, No. 11, 2005, pp. 1649-1657. doi:10.1088/0022-3727/38/11/003
- A. Gomez, L. Flores, C. Torres, P. G. Reyes, F. Castillo and H. Martínez, “Diagnostic Studies of N2-O2-AR Glow Discharge Mixture,” Poceedings of the 29th ICPIG, Cancún, 12-17 July 2009, pp. 284-287.
- Z. Machala, M. Janda, K. Hensel, I. Jedlovský, L. Leš- tinská, V. Foltin, V. Martišovitš and M. Morvová, “Emission Spectroscopy of Atmospheric Pressure Plasmas for Bio-Medical and Environmental Applications,” Journal of Molecular Spectroscopy, Vol. 243, No. 2, 2007, pp. 194-201. doi:10.1016/j.jms.2007.03.001
- H. G. Kalyuzhna, D. S. Levko and A. I. Shchedrin, “The Influence of the Parameters of an Atmospheric Pressure Barrier Discharge in Air on the Plasma Kinetics,” Ukr Journal of Physics, Vol. 53, No. 10, 2008, pp. 957-961.
- M. Yousfi, N. Merbahi, J. P. Sarrette, O. Eichwald, A. Ricard, J. P. Gardou, O. Ducasse and M. Benhenni, “Biomedical Engineering—Frontiers and Challenges,” 2011.
- R. Brandenburg, V. A. Maiorov, Yu. B. Golubovskii, H.-E. Wagner, J. Behnke and J. F. Behnke, “Diffuse Barrier Discharges in Nitrogen with Small Admixtures of Oxygen: Discharge Mechanism and Transition to the Filamentary Regime,” Journal of Physics D: Applied Physics, Vol. 38, No. 13, 2005, pp. 2187-2197. doi:10.1088/0022-3727/38/13/017
- A. Starikovskiy and N. Aleksandrov, “Aeronautics and Astronautics,” 2011.
- Z. P. Lin and W. A. Aue, “Quenching and Enhancement of Aroyl Luminescence in Excited Nitrogen,” Analytical Chemistry, Vol. 72, No. 1, 2000, pp. 198-205.
- I. Iova, M. Bazavan and F. L. Iova, “Specific Excitation of Some Head Bands of N2 and N2+ Molecules in Cylindrical Hollow Cathode Electrical Discharge (HCED),” Romanian Reports in Physics, Vol. 35, No. 4, 2003, pp. 472-479.
- V. Yu. Bazhenov, A. V. Ryabtsev, I. A. Soloshenko, V. A. Khomich, V. V. Tsiolko, A. I. Shchedrin, A. I. Kuzmichev1, V. I. Kryzhanovsky1 and I. L. Mikhno, Ukr Journal of Physics, Vol. 48, No. 1, 2003.
- A. A. Garamoon and D. M. El-Zeer, “Atmospheric Pressure Glow Discharge Plasma in Air at Frequency 50,” Plasma Sources Scientific Technology, Vol. 18, No. 4, 2009, 8 p.
- NIST Chemistry WebBook. http://webbook.nist.gov/chemistry/
- Q. S. Yu and H. K. Yasuda, “An Optical Emission Study on Expanding Low-Temperature Cascade Arc Plasmas,” Plasma Chemistry and Plasma Processing, Vol. 18, No. 4, 1998, pp. 461-485. doi:10.1023/A:1021807215831
- J. H. Kim, Y. H. Choi and Y. S. Hwang, “Electron Density and Temperature Measurement Method by Using Emission Spectroscopy in Atmospheric Pressure NonEquilibrium Nitrogen Plasmas,” Physics of Plasmas, Vol. 13, No. 9, 2006, 7 p.
- M. Moravej, X. Yang, M. Barankin, J. Penelon, S. E. Babayan and R. F. Hicks, “Properties of an Atmospheric Pressure Radio-Frequency Argon and Nitrogen Plasma,” Plasma Sources Scientific Technology, Vol. 15, No. 2, 2006, pp. 204-210.
- Bolsig, Kinema Software, Washington St. Monument, CO 80132. http://www.siglo-kinema.com
- A. Von Engle, “Electric Plasma the Nature and Uses,” Tayler and Frances Ltd., London and New York, 1983.