Optics and Photonics Journal
Vol. 3 No. 2 (2013) , Article ID: 32627 , 5 pages DOI:10.4236/opj.2013.32024
Application of Multispectral Imaging Method in Rapid Identification and Analysis of Chinese Herbal Medicine Powders*
1Department of Physics, Jinan University, Guangzhou, China
2Department of Optoelectronic Engineering, Jinan University, Guangzhou, China
3College of Traditional Chinese Medicine, Southern Medical University, Guangzhou, China
4Department of Applied Physics, South China Agricultural University, Guangzhou, China
Email: hcyhome@163.com
Copyright © 2013 Cuiying Hu et al. This is an open access article distributed under the Creative Commons Attribution License, which permits unrestricted use, distribution, and reproduction in any medium, provided the original work is properly cited.
Received February 1, 2013; revised March 6, 2013; accepted March 15, 2013
Keywords: Spectral Imaging Technology; Rapid Identification; Chinese Medicine
ABSTRACT
Five kinds of traditional flower Chinese medicine powders (TFCMD) were identified using tuneable liquid spectral imaging instrument, to discuss the application range and advantages of spectral imaging technology in Chinese medicine identification and analysis field. The testing system is the liquid crystal multispectral imaging system designed by ourselves. All the tests are standard samples supplied by National Institute for Drug Control. The spectral cubes of Campsis grandiflora, Carthamus tinctorius, Albizzia julibrissin, Dendranthema morifolium, and Dendranthema indicum were captured, and then the normalized characteristic spectral curves of them were picked up. The spectral resolution is 5 nm, and the spectral range is 400 nm - 650 nm. The result shows that different TFCMD has different normalized characteristic fluorescence spectral curve. Spectral imaging technology can be used to identify TFCMD, and the testing course is convenient, quick, noninvasive and without pre-treatment.
1. Introduction
Flower is the unique reproductive organ of angiosperms, and it is also an important basis for identification of species. The herbs and pieces of flower traditional Chinese herbal medicines are almost the same in the shape, structure and size. So, it is not difficult to identify the full flower traditional Chinese medicines based on the structure or medicinal parts of them. However, the identification is quite difficult if their structures are incomplete, broken, or they were ground into powders. Not only the micro-or-nano features are necessary to identify them, but also the testing personnel must have a wealth of practical experience in order to make the right judgments.
Multispectral imaging is an emerging technology that integrates conventional imaging and spectroscopy to attain both spatial and spectral information from an object. The principle of multispectral imaging is that the spectrum of the detected samples is divided into many narrow wavebands by a filter, and then the images at a number of wavebands are captured by a detector. Both the spatial and the spectral data of the detected sample can be obtained. The two dimensional characteristic spectral curve and three dimensional information distribution of the detected samples can be gotten at the same time.
Multispectral imaging was originally developed for remote sensing applications [1] but has since found application in diverse fields such as environment, telemetry, agriculture and other fields [2-6]. A series of exploratory studies have been conducted about different kinds of Chinese herbal medicines by our research group [7-9]. Traditional flower Chinese herbal medicine powders were identified using the multispectral imaging technology in this paper. The result shows that multispectral imaging technology provides an objective, quick and simple method for the identification of traditional Chinese herbal medicine powders.
2. Materials and Methods
2.1. Samples Preparation
The whole test samples were standard samples supplied by National Institute for Drug Control on December 8, 2010 and April 27, 2011, respectively. Sample details are listed in Table 1. GDIDC is abbreviation for “Guangdong Institute for Drug Control”, and GZIDC is abbreviation for “Guangzhou Institute for Drug Control”.
2.2. Multispectral Imaging System
The system was designed by the spectral imaging laboratory in Department of optoelectronic engineering, Jinan University. The main components are a light source, a light source filter, a liquid crystal tunable filter (LCTF), the controller of LCTFs, a CCD, a host computer and several lenses [10].
The light source filter is used to select the wavelengths and spectral width of the light source. The LCTFs is used to divide the light coming from the samples in two dimensions. The working wavelength of LCTF is from 400 nm to 1100 nm, which is controlled by the controller of LCTF. The wavebands from 400 nm to 650 nm are chosen in our experiment. The spectral resolution is up to 0.5 nm.
The ray path of the testing system is shown in Figure 1. The light coming from the light source reaches the samples. After the interaction of light and the sample, the light which carries the information of the samples is divided by the LCTF and captured by CCD. If the characteristic spectrum of a sample has been confirmed, the wavelength of LCTF can be selected at several discrete wavelengths. If the characteristic spectrum of a sample has not been confirmed, the wavelength of LCTF can be set to change continuously. The two-dimensional spectrum data is saved and processed by the host computer. At last, the results can be shown on the screen.
2.3. Image Acquisition
Two mercury lamps with the center wavelength of 254 nm were employed in our research as the excitation

Table 1. Information of samples.
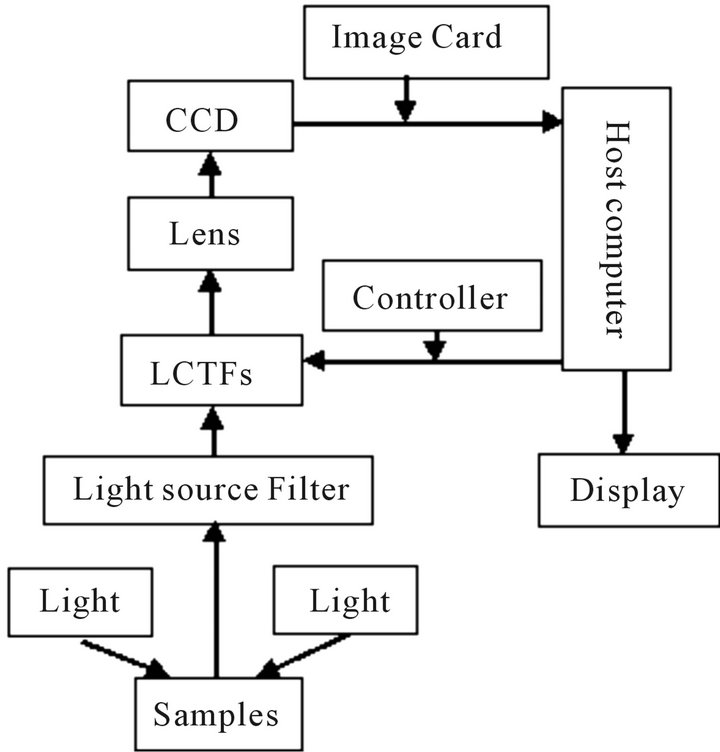
Figure 1. The ray path of the system.
source. Single channel, continuous spectrum scan was used in the detection process. The spectral scan range was from 400 nm to 650 nm, controlled by the controller of LCTFs. The two adjacent frames interval is 5 nm. The CMOS imaging camera was adjusted so that the focal plane coincided with the surface of the test samples at 550 nm waveband. The CMOS camera was set to continuous mode with the exposure time of 1000 ms, which was synchronized with spectral scanning time, and then the fluorescence images of the test sample were acquired at the whole wavebands. The captured images were stored in the computer with jpg format. A spectral cube of the test sample, formed by 51 frame spectral images, can be obtained in one test.
2.4. Extraction of Characteristic Spectral Curve
The detected samples were placed on the substrate without any pre-treatment, and the two-dimension images of them at a number of narrow wavebands were obtained according to Section 2.3. Removed noise in the images with a bandpass filter. Selected the same area in every image to calculate the average light intensity of the corresponding pixel according to and to normalize them according to Equation (1), then the characteristic spectral curves of the samples were obtained.
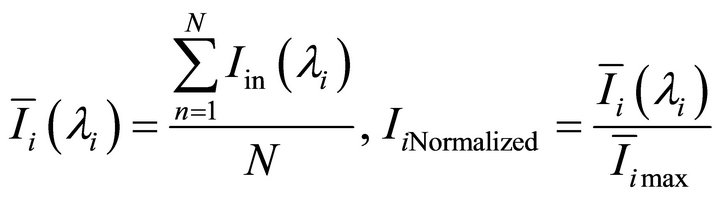 (1)
(1)
where, N is the number of the pixel,  is average light intensity of the ith image,
  ,
,  is the biggest light intensity among the 51 frame images.
2.5. Methodological Study
2.5.1. Stability Test
Test the same sample five times according to Sections 2.3 and 2.4, 24-hour interval between two times. Compare the characteristics spectra curves obtained from the 5 times. The similarity of the 5 curve peak shape (measured by its covariance) is greater than 0.95, and the positions of characteristic peak remain unchanged. The uncertainty of characteristic peaks fluctuations in light intensity is less than 1.86% of the measurements. It shows that the samples have good stability in the detection.
2.5.2. Precision Test
Repeat measuring the same sample five times according to Sections 2.3 and 2.4. Compare the characteristics spectra curves obtained from the 5 times. The similarity of the 5 curve peak shape is greater than 0.95, and the positions of characteristic peak remain unchanged. The uncertainty of characteristic peaks fluctuations in light intensity is less than 1.86% of the measurements. It shows that the imaging system has good precision.
2.5.3. Reproducibility Test
Test the same sample five times according to Sections 2.3 and 2.4. Compared the characteristics spectra curves obtained from the 5 times. The similarity of the 5 curve peak shape is greater than 0.95, and the positions of characteristic peak remain unchanged. The uncertainty of characteristic peaks fluctuations in light intensity is less than 1.86% of the measurements. It shows that this method has good reproducibility.
3. Result and Discusion
3.1. Characteristic Spectral Curves of TFCMD
Figures 2-6 are the characteristic spectral curves of Campsis grandiflora, Carthamus tinctorius, Albizzia julibrissin, Dendranthema morifolium and Dendranthema indicum, respectively. Figure 7 is the set of the five
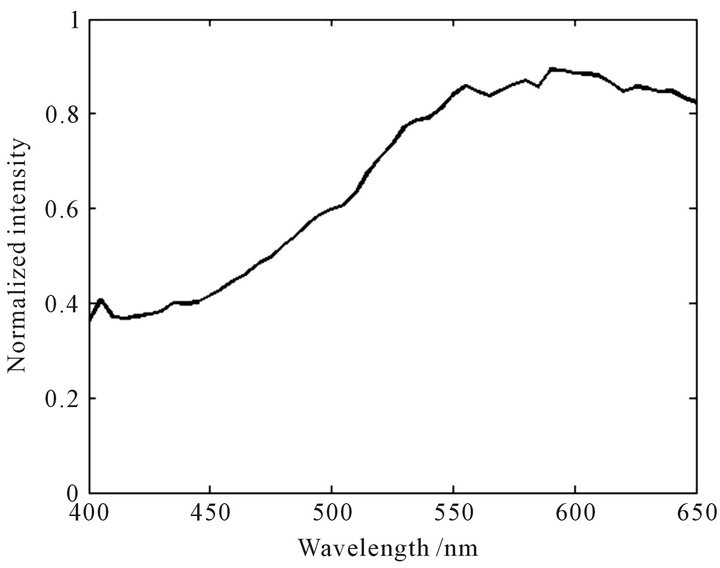
Figure 2. Normalized characteristic spectral curve of Campsis grandiflora.
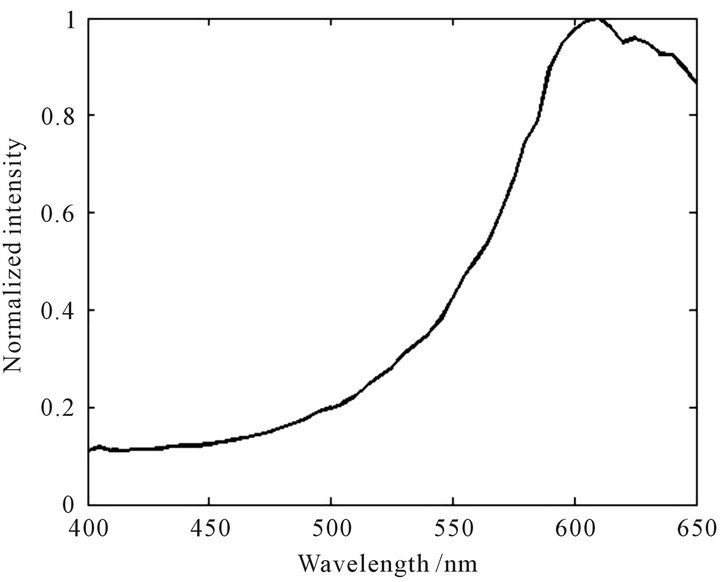
Figure 3. Normalized characteristic spectral curve of Carthamus tinctorius.
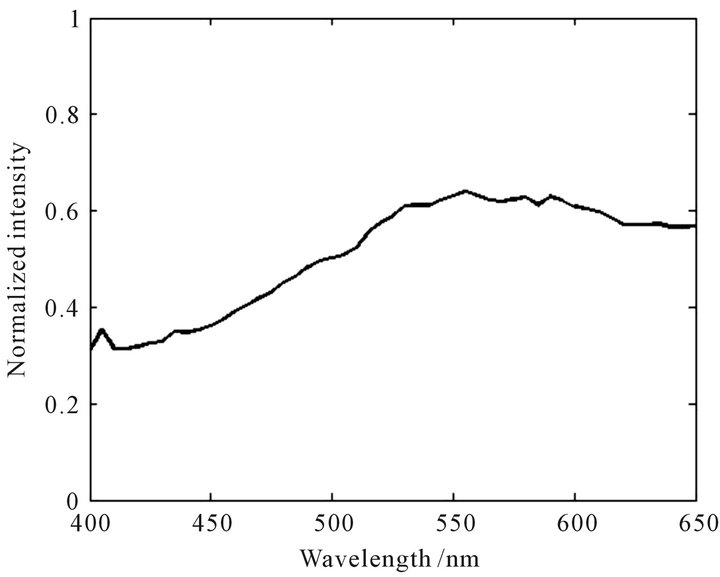
Figure 4. Normalized characteristic spectral curve of Albizzia julibrissin.
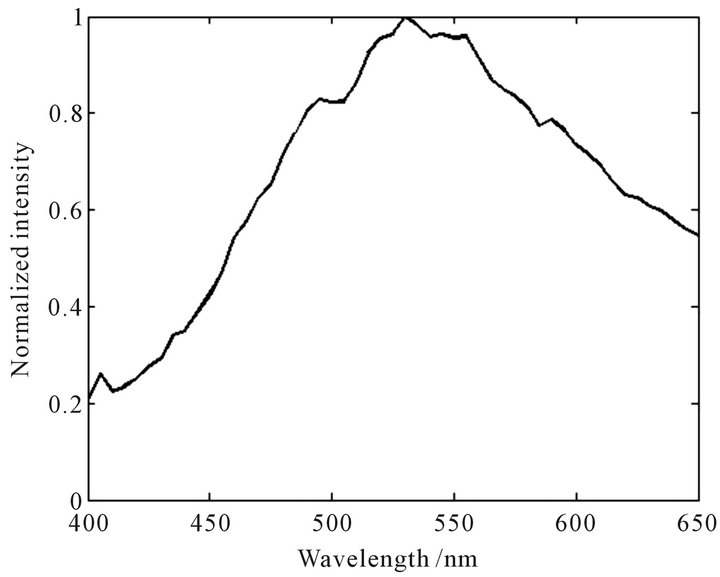
Figure 5. Normalized characteristic spectral curve of Dendranthema morifolium.
characteristic spectral curves. From the figures we can see that every TFCMD has its own characteristic spectral curve, whose peak shape, peak and valley positions are different with others.
3.2. Analysis of the Characteristic Spectral Curves
Figures 2-7 indicate that the normalized characteristic spectral curves of the TFCMD are significant differences each other. The general trends and characteristics peaks are completely different. The curves of Carthamus tinctorius and Campsis grandiflora have partial peak structures. The peak position of Carthamus tinctorius is at 610 nm with the peak height of 1.0 (normalized strength, following the same). The change of fluorescence inten-
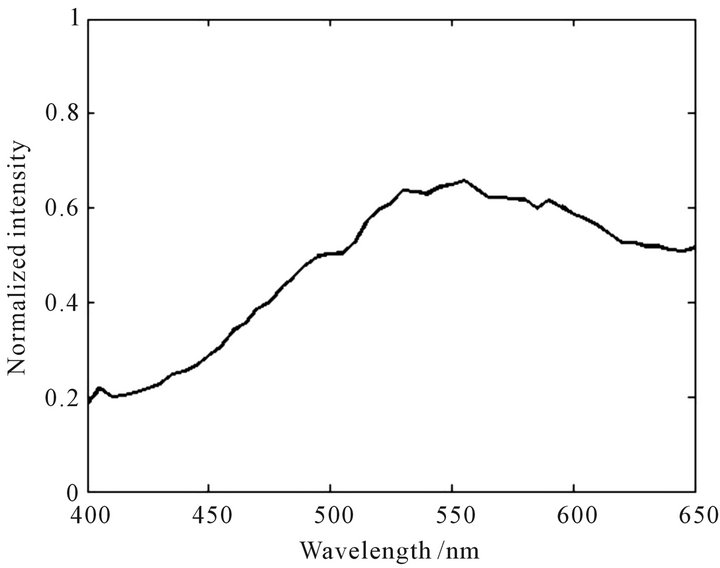
Figure 6. Normalized characteristic spectral curve of Dendranthema indicum.
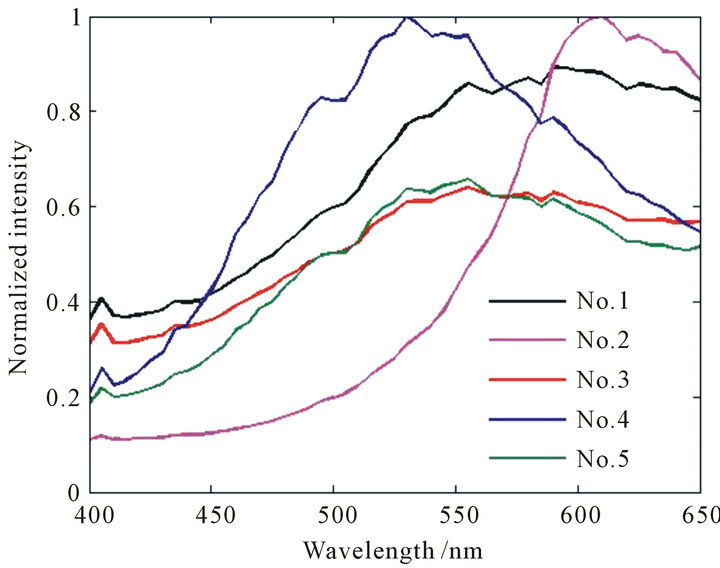
Figure 7. Normalized characteristic spectral curves of the five Chinese herbal medicine powders. No. 1-5 corresponding to Campsis grandiflora, Carthamus tinctorius, Albizzia julibrissin, Dendranthema morifolium, and Dendranthema indicum.
sity near the peak is quite large; The peak position of Campsis grandiflora is at 590 nm with the peak height of 0.89. The change of fluorescence intensity in the vicinity of the peak is smaller. The curves of Dendranthema morifolium and Dendranthema indicum are close to the normal distribution. The peak position of Dendranthema morifolium is at 530 nm with the peak height of 1.0, and the curve show a ladder distribution on both sides of the peak; The peak position of Dendranthema indicum is at 555 nm with the peak height of 0.66, and the fluorescence intensity changes slowly near the peak. The characteristic spectral curve of Albizzia julibrissin is relatively flat at the whole detection wavebands, and the peak is not obvious. The results show that every TFCMD has a unique characteristic spectral curve, and TFCMD can be identified easily according to the curves of their own.
4. Conclusions
The multispectral imaging method is presented as a nondestructive technique to identify and analyze the traditional Chinese herbal medicine powders.
Compared to chemical methods, which are either tedious, time or produce consuming, biased or difficult to automate, the most advantage of multispectral imaging method, besides their rapidity, simplicity, safety and low operational costs, is using intact samples presented directly to the system without any pre-treatment. The measuring process is time-saving and the results are steady, precise and repeatable.
A series of other studies have been conducted about different kinds of Chinese herbal medicines. It can be concluded that the multispectral imaging method can be used not only to identify the authenticity of Chinese herbal medicines, to control the quality of traditional Chinese medicines during the production process, but also to monitor the growth process in the plantation.
REFERENCES
- A. F. H. Goetz, G. Vane, T. E. Solomon, and B. N. Rock, “Imaging Spectrometry for Earth Remote Sensing,” Science, Vol. 228, No. 4704, 1985, pp. 1147-1153. doi:10.1126/science.228.4704.1147
- S. Xiao, S. Fan, Y. Li and Y. Zhao, “Progress of Spectral Imaging Technique,” Modern Instruments, No. 5, 2003, pp. 5-8.
- K. Heia, A. Sivertsen, S. Stormo, et al., “Detection of Nematodes in Cod (Gadus morhua) fillets by imaging spectroscopy,” Journal of Food Science, Vol. 72, No. 1, 2007, pp. E011-E015. doi:10.1111/j.1750-3841.2006.00212.x
- Y. Peng and R. Lu, “Prediction of Apple Fruit Firmness and Soluble Solids Content Using Characteristics of Multispectral Scattering Images,” Journal of Food Engineering, Vol. 82, No. 2, 2007, pp. 142-152. doi:10.1016/j.jfoodeng.2006.12.027
- M. Liu, Q. Chen and H. Lin, “The Study of Non-Destructive Measurement of Fruit Internal Qualities Using Spectral Imaging,” Acta Optica Sinica, Vol. 27, No. 11, 2007, pp. 2042-2046.
- S. Xiao, S. Fan, Y. Zhao, Y. Li and Y. Zhao, “Spectral Imaging Technique and Its Biomedical Researching Applacations,” Modern Scientific Instruments, Vol. 12, No. 1, 2005, pp. 60-62.
- J. Zhao, Q. Pang, J. Ma, et al., “Rapid Identification of Cortex Dictamni Pieces and Its Counterfeit Alangium Chinese by Spectral Imaging Method,” China Journal of Chinese Material Medica, Vol. 35, No. 13, 2010, pp. 1696-1698.
- Q. Meng, Q. Pang, J. Ma, et al., “Transmission Spectral Imaging Research on Folium Uncariae from Guangdon,” Journal of Chinese Medicinal Material, Vol. 33, No. 5, 2010, pp. 696-699.
- J. Zhao, Q. Pang, J. Ma, et al., “Spectral Imaging Fingerprint of Cortex Phellodendri Chinensis Piece,” Chinese Traditional and Herbal Drugs, Vol. 41, 2010, pp. 384- 386.
- J. Zhao, Q. Pang, J. Ma, et al., “Design of the Continuous Spectrum Imaging Apparatus Based on LCTFs,” Acta Photonica Sinica, Vol. 37, No. 3, 2008, pp. 758-762.
NOTES
*This work was supported by the National Natural Science Foundation of China under Contract 60908038, Science and Technology Planning Project of Guangdong Province, China under Contract 2012B04030 2002 and Agricultural Science and Technology Project of Guangzhou, China under Contract GZCQC1002FG08015.