Journal of Environmental Protection
Vol.4 No.11(2013), Article ID:39245,11 pages DOI:10.4236/jep.2013.411139
Modeling of Quaternary Groundwater Pollution Risk by GIS and Multicriteria Analysis in the Southern Part of Abidjan District (Côte d’Ivoire)
![]()
1Laboratoire de Géosciences et Environnement, Université Nangui Abrogoua, Abidjan, Côte d’Ivoire; 2Université Jean Lorougnon Guédé, Daloa, Côte d’Ivoire.
Email: innocent_kouassi@yahoo.fr
Copyright © 2013 Innocent Kouassi Kouame et al. This is an open access article distributed under the Creative Commons Attribution License, which permits unrestricted use, distribution, and reproduction in any medium, provided the original work is properly cited.
Received August 1st, 2013; revised September 3rd, 2013; accepted October 2nd, 2013
Keywords: Pollution Risk; Quaternary Groundwater; GIS; Multicriteria Analysis; Sensitivity Analysis; Abidjan
ABSTRACT
The pollution generated by human activities in the area “Vridi canal-Grand Bassam” puts more at risk the quaternary groundwater that supplies water to a large part of the population of the southern part of Abidjan city. This paper deals with the combined approach of geographic information systems and multicriteria analysis to delineate areas at risk of pollution of groundwater in the study area. The multicriteria analysis also incorporated the statistical and geostatistical techniques for defining the factor ratings and weightings of all the parameters under a GIS environment. The criterion for these factor ratings and weightings was the correlation coefficient of each parameter with the nitrates concentration in groundwater. Two indicators were combined for creating situations of pollution risks according to their importance: the intrinsic vulnerability indicators which combined the depth to groundwater, the net recharge, the slope, the soil media, the unsaturated hydraulic conductivity and extrinsic vulnerability characterized by the land use. The results showed that all to the site presents nitrate pollution risks with 50.7% of moderate risk, and 49.3% of high and very high risks. The areas which present the highest risks of pollution are the densely urbanized communes of Treichville, Marcory, Koumasi, Port-Bouët and Grand-Bassam. The sensitivity analysis indicates that parameters causing high sensitivity on the nitrate pollution risks map are the depth to groundwater and the recharge. The errors committed on the maps establishment are ±0.15%, ±0.40% and ±6% respectively for IV map, EV map and pollution risk map.
1. Introduction
Groundwater resource protection has become a critical issue worldwide. One of the approaches widely used to protect groundwater quality and reduce human health risks consists in assessing and mapping groundwater vulnerability to contamination. The term groundwater vulnerability includes two basic parameters: intrinsic vulnerability (IV) and specific vulnerability [1]. The former defines the vulnerability of groundwater to contaminants generated by human activities, taking into account only the inherent hydrogeological characteristics of the area, and is independent of the nature of the contaminants. The latter is specified for a particular contaminant or group of contaminants. The most common vulnerability assessment techniques used is the DRASTIC system [2]. This model has been widely used in many countries because the inputs required for its application are generally available or easy to obtain. It is based on seven parameters to be determined as input for computing the DRASTIC index number, which reflects the pollution potential for the aquifer [2-5]. However, the major drawback of this method is the subjectivity of the determination of the rating scale and the weighting coefficients. The combination of GIS and MCA is a powerful tool to solve the groundwater vulnerability problem. Indeed, GIS provides efficient manipulation and presentation of the data and MCA provides consistent ranking of the groundwater vulnerability based upon a variety of criteria. This combination of GIS and MCA has already been used for solving the groundwater potential zone delineation problem and landfill site selection [6-8].
The objective of this study is to assess the groundwater pollution risks in area of Vridi chanel to Grand-Bassam in Abidjan city (Côte d’Ivoire) using a GIS modeling combined with a MCA and statistical procedures.
2. Materials and Methods
2.1. Study Area
The study area is located in the South of Côte d’Ivoire. It covers the area between latitude 5˚12'5'' and 5˚20'15''N and longitude 4˚4'57'' and 3˚43'19''W. It is divided into five communal zones namely Treichville, Marcory, Koumassi, Port-Bouët and Grand-Bassam (Figure 1). The population is estimated at 880,712 inhabitants [9]. This area is under the influence of the equatorial transition climate with four distinct seasons: a long dry season (December to April), a long rainy season (May to July), a short dry season (August to September) and a short rainy season (October to November). The study area is located in the coastal sedimentary basin and covers 253 km2 and is characterized by a flat relief. Various geological formations of Quaternary age are found in this zone. These include clayey sands reaching 15 to 30 m thickness, mud and sands from the fluvio-lagunal depression, and marine sands reaching up to 45 m thickness. It is a sandy aquifer that receives high recharge. The permeability of the surface deposits of this aquifer system ranges from 10−4 m∙s−1 to 10−3 m∙s−1 for the clayey sands and 10−3 m∙s−1 for marine sands [9]. Groundwater flow velocity in the aquifer is high and can be regarded as relatively uniform.
2.2. Data Collection and Factors Establishment
2.2.1. Intrinsic Vulnerability Parameters
The assessment of Intrinsic Vulnerability (IV) in this study made up possible using the following parameters: depth to water (D), net recharge (R), aquifer media (A), soil type (S), hydraulic conductivity of the unsaturated zone (K) and slope (T).
Depth of water (D)
The depth of water influences the transfer of pollutants from surface to groundwater resources [10]. According to [11] when the water table is shallow, the transfer time of pollutants is low, increasing the risk of contamination. In contrast, the level of groundwater pollution decreases
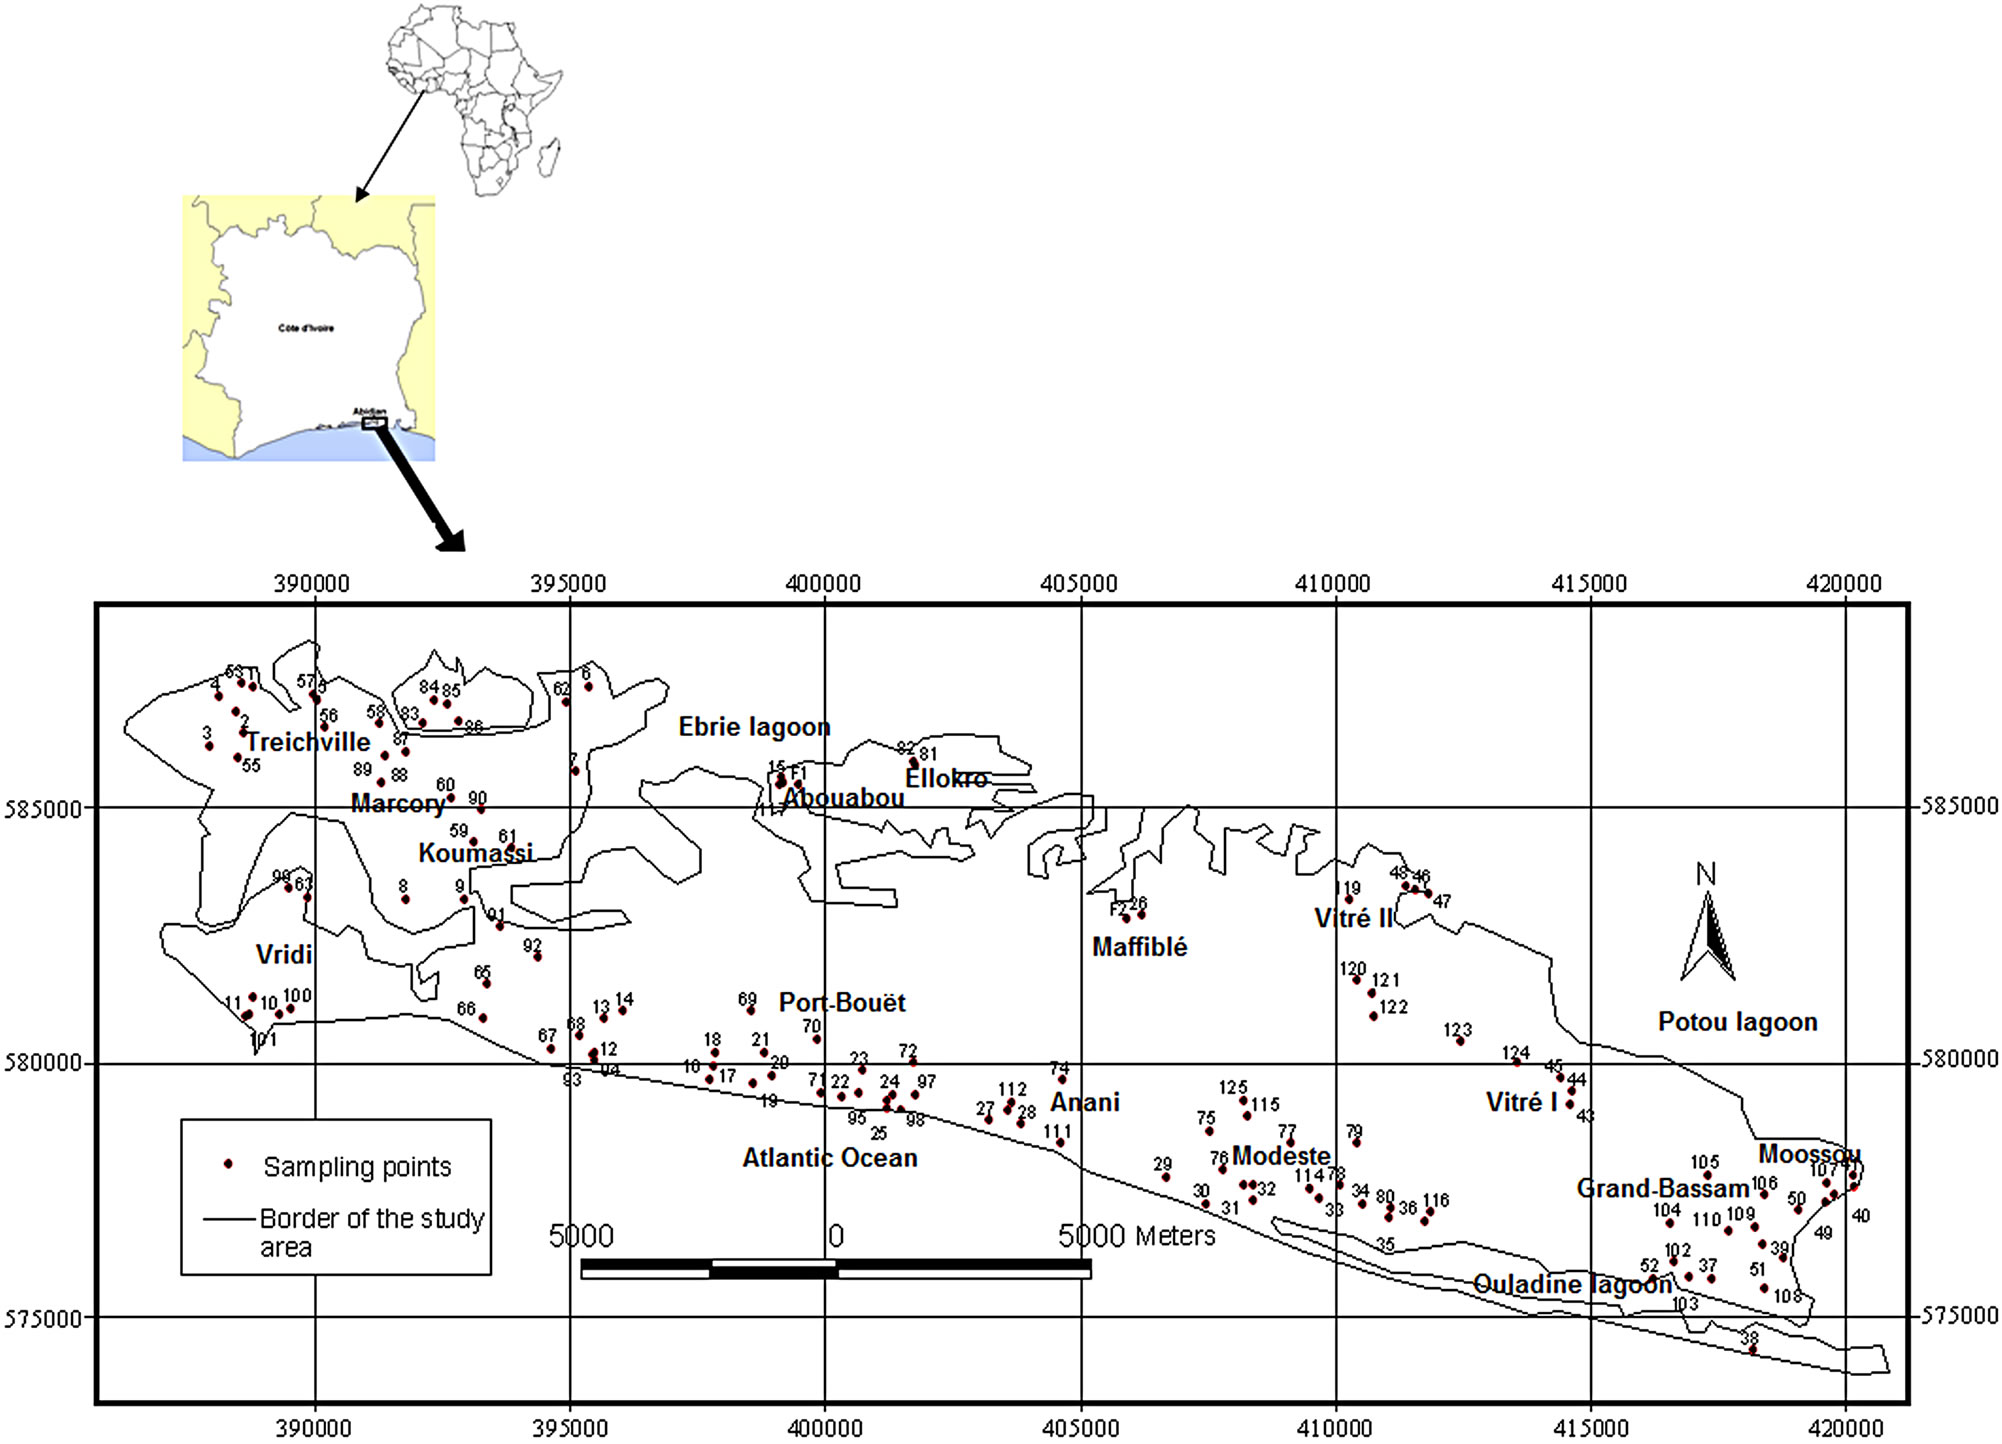
Figure 1. Sampling and measurement points in the study area.
with increasing depth. In the study area, Depth to groundwater distribution was produced based on water level measurements contacted in 127 wells interpolated by ordinary kriging method. Water levels have been monitored using a graded tape that provides sound signals when it touches water in the well, with an accuracy of 2 mm.
Net recharge (R)
The net recharge that is the total amount of water that seeps into the soil surface to groundwater on an annual basis is the main factor for the leaching and transport of contaminants to the groundwater. The chance for contaminants to reach groundwater is important and depends on the recharge level [8]. Considering the data availability in the study area, the water-table fluctuation method was used in this study to estimate net groundwater recharge as described by [12]. Point estimates of the net recharge at 127 sites were interpolated by ordinary kriging technique to obtain a spatial map of net recharge.
Aquifer media (A)
Aquifer media map constructed by [9] was used for the determination of the Quaternary aquifer media in this study. It is characterized by medium and coarse sand. The most dominant formations are medium sands that cover almost all of the study area.
Soil media (S)
Topsoil properties control the amount of water that can seep into the soil and reach groundwater [13]. According to [11] permeable soils (sands and gravels) allow a large amount of water to infiltrate to the water, making the groundwater more vulnerable, while the less permeable soils, such as clays, reduce infiltration, making it less vulnerable to pollution. It represents the first layer of the vadose zone which controls the amount of recharge that can seep down [8]. Soil samples were taken at 50 sites. Care was taken to make sure that these samples were representatives of important patterns of particle-size distribution in soils of the study area. Soils were sampled using an auger and the cores were bulked and stored in polyethylene bags. In these samples, particles < 63 µm (i.e., silt and clay components) were uncommon. Organic matter was removed using 30% H2O2. The sand fraction (>63 µm) was dried and processed by dry sieving technique. Soil media was determined from grain sizes using the methods developed by [14,15].
Topography (T)
The topography represents the variability of the slope of the land surface. The slope is a critical parameter with direct control over runoff and therefore over infiltration [16]. Indeed, with low sloping, runoff is slow and allows rainwater to seep into the subsurface, whereas highly sloping areas facilitate runoff [17]. Due to lack of a good topographic map for the study area, a topographic map was constructed for the needs of the present study by global positioning system leveling based on 306 sites uniformly spread in the whole extent of the study area. A digital elevation model (DEM) of the study area whose values varied from 0 to 16 m was generated from this topographic map. The slopes in the study area were then derived from the DEM.
Hydraulic conductivity (K)
The hydraulic conductivity of the aquifer was determined by a double ring infiltrometer method at 50 sites. Litter was cleared from 1.0 - 1.5 m2, on soil surfaces that were not disturbed and metal rings (inner 13 cm diameter, outer 30 cm diameter, height 25 cm) were driven vertically into the soil for about 10 cm so that the smaller ring was centered in the larger ring, using a hammer. Both rings were partially filled with water, thereby maintained a constant liquid level. The volume of water added from the graduated cylinder into the infiltration rings to keep the water levels constant is equal to the measure of the volume of liquid that infiltrates into the soil. After stabilization of the water flow, the volume V (m3) of water infiltrated for a time t (s) is measured. The infiltration flow q (m3/s) is evaluated by Equation (1):
 (1)
(1)
Darcy’s law is applied according to the infiltration surface S (m2) equal to the section of cylinder and the hydraulic gradient by Equation (2):
 (2)
(2)
The value of the vertical gradient is equal to 1 and K is expressed in m∙s−1.
2.2.2. Extrinsic Vulnerability Parameter
Land use Extrinsic vulnerability is characterized by the level of land use. To determine of the land use types in the study area, the land use map of Abidjan city and vicinity was used. This map produced by National Office of Engineering and Development studies (BNETD) at a scale 1/200,000, was scanned and digitized to obtain the land use layer.
To assess the actual pollution occurrence in the study area, groundwater samples were collected in the dry period (March) of 2007 on a sampling network including 127 sampling points. The sampling points were selected based on the geographic location of wells and boreholes and the use of the wells and boreholes as sources of water for drinking purpose. Figure 1 shows the location of the selected wells and boreholes. Water samples collection from wells and boreholes was carried out according to the procedures described by [18]. Samples from wells were collected with weighted bucket (50 cm below the water table). For boreholes, samples were taken after pumping for 5 min. The tap and the bucket were cleaned before sampling and caution was taken to avoid splashing. Samples were collected in 500 mL polyethylene bottle. Once collected, all samples were stored on ice and immediately transported to the laboratory. Nitrate analyses were processed within 6 hours after collection. Nitrates were analyzed by spectrometry according to French standard NFT 90-012.
2.3. Factors Classification and Standardization
The rating scale of IV parameters is accomplished by using the mean of every class of each parameter defined in the DRASTIC model. Following the check that was carried out using the Wilcoxon rank-sum nonparametric statistical test [19], it was ascertained that the mean of two neighboring classes, did not differ statistically. Classes were grouped in such cases, while for non-continuous parameters (parameters with discrete classes, e.g. aquifer type) all the categories existing in the area were maintained, regardless of statistical diversity.
In Table 1 the parameter classes, as well as the corresponding rating of each class or group of classes and the average nitrates concentration are presented. Rating values were derived using the mean nitrates concentration of each class reduced to a ten-grade scale.
The next step is the determination of the weighting factors. The factor weights were assigned according to how important each factor was. To make the process of assigning factor weights more objective, a pairwise comparison was applied in which only two criteria were considered at a time. The implemented technique of the pairwise comparison of factors was developed by [20] in the context of a decision-making process known as the Analytical Hierarchy Process. In the procedure for multicriteria evaluation in the present study, using a weighted linear combination, it was necessary that the assigned factor weights sum to 1. In the technique developed by [20], factor weights can be derived by taking the principal eigenvector of a square reciprocal matrix of pairwise comparisons between the criteria. The comparisons concern the relative importance of the two criteria involved in determining suitability for the assessment of pollution potential. This relative importance was determined on a numerical scale of 9 levels [21] based on the study of the correlation of each parameter of IV with the nitrate concentrations for the 127 sampling points of the research area. For the calculation of the quantitative correlation between the discrete (nominal) parameters and the nitrate concentrations, their factor scores were used. Additionally, due to the fact that the factor scores vary with an interval scale, the correlation was calculated using the Spearman’s correlation coefficient which is advisable for such type of parameters. In the case when one of the coefficients is not statistically significant, the corresponding parameter will be excluded from IV indicator as recommended by [22]. Table 2 gives the pairwise comparison matrix for weighting assigned in intrinsic vulnerability parameters, respectively.
The values of the parameter vectors were obtained by calculating their geometric mean by line [7] (Equation (3)):
 (3)
(3)
Vpi = load vector of each factor; Ni = Value of each factor.
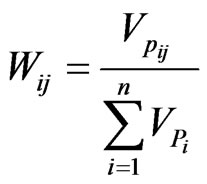
The weighting coefficient (Wij) of each factor is given
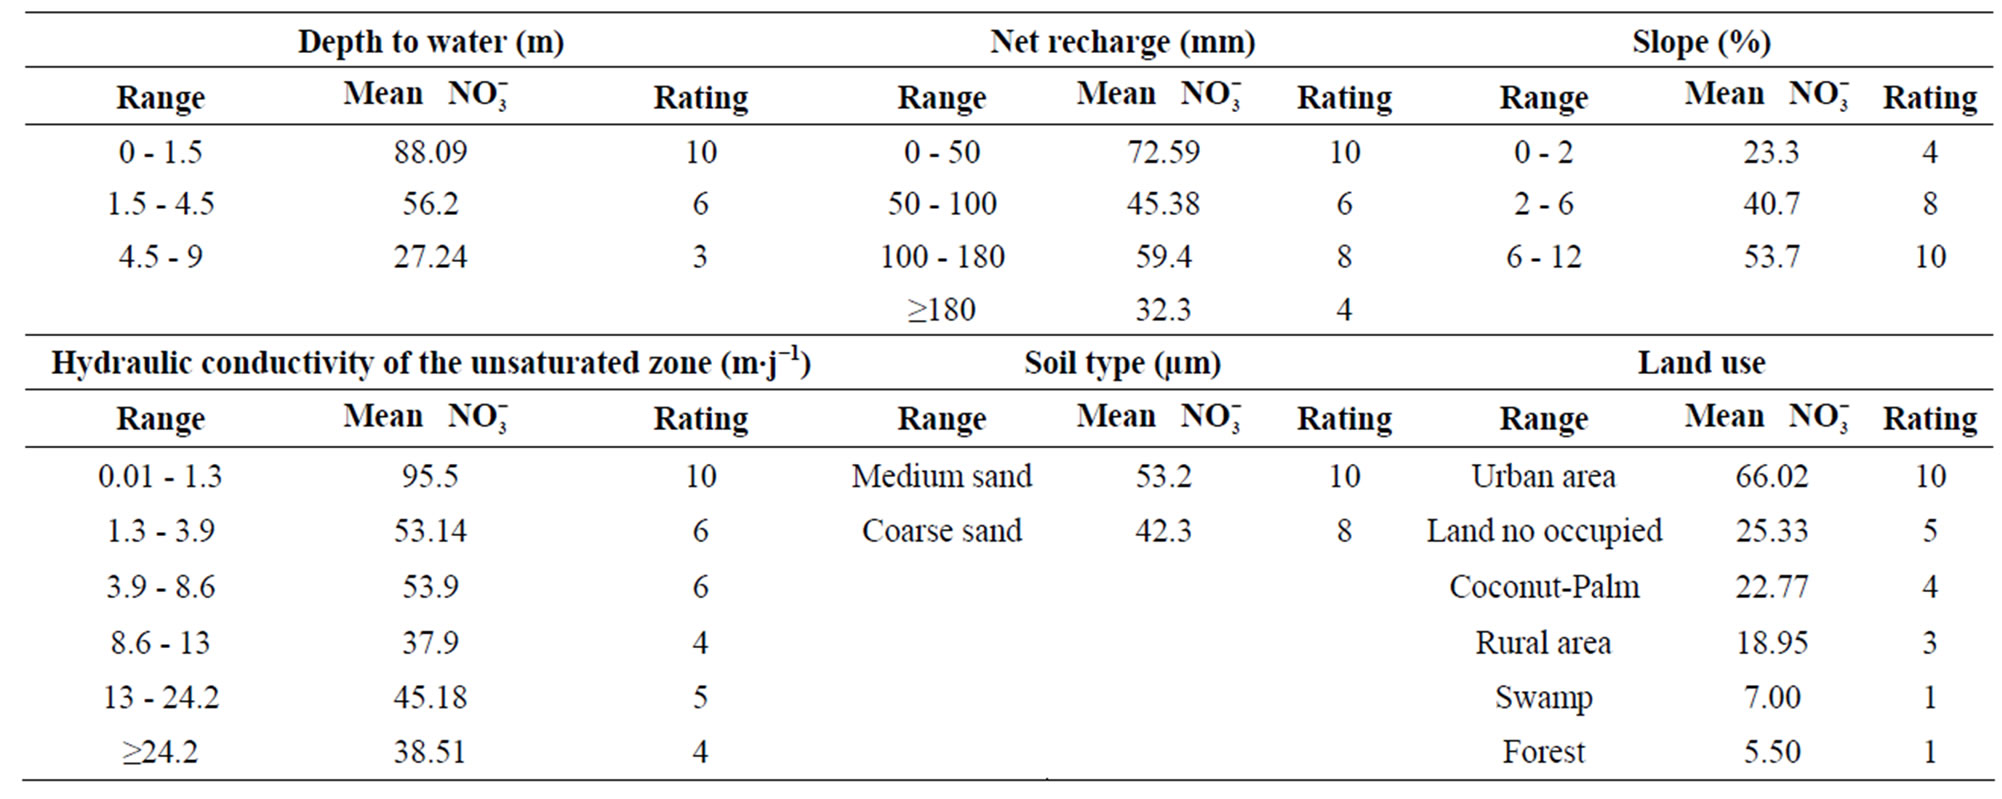
Table 1. Ratings of the intrinsic vulnerability parameters.

Table 2. Pairwise comparison matrix for weighting assigned in intrinsic vulnerability parameters.
as follows (Equation (4)):
 (4)
(4)
The grade of each land use category was derived similarly in accordance with the revision of the rating scales of the IV’s parameters. Namely, the mean nitrates concentration in each land use category was used, reduced in a ten-grade scale.
2.4. Factors Aggregation
In order to combine information from various parameters in each indicator, an aggregation procedure should be applied. The most commonly used vulnerability assessment methods apply an aggregation technique known as the weighted linear combination, where parameter or indicator scores are multiplied by their factor weight and then summed to yield the vulnerability score.
Pollution risk index based on 3 scenarios have been designed using the change in the relative importance of IV and EV (Table 3). Thus, groundwater vulnerability results were grouped in 3 distinct classes: low (0 - 2.5), moderate (2.5 - 5), high (5 - 7.5) and very high (7.5 - 10).
2.5. Uncertainty and Sensitivity Analysis
Sensitivity tests were used as supporting experimental evidence for GIS-MCA model implementation to remove the doubt about the accuracy of the model. In this contribution, the aspects related to the uncertainty analysis, the influence of the map removal and the single-parameter sensitivity analysis were only used.
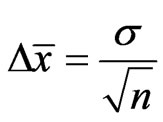
Uncertainties: The uncertainty of each parameter was calculated using Equation (5):
 (5)
(5)
with  uncertainty on average of the data series, σ standard deviation, n number of data.
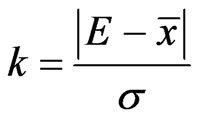
An expansion factor (k) is then calculated in order to determine the confidence interval by Equation (6):
 (6)
(6)
where k is the expansion factor, E is the extreme value of the statistical series which can be the maximum or the minimum of this series. Confidence levels of the different parameters have been deduced from different values of k. Thus, k = 1 for a confidence of 68%, k = 2 for a confidence of 95%, k = 3 for a confidence of 99%.
Map errors: The errors of IV and EV index on the maps were calculated by the following formula (Equation (7)):
 (7)
(7)
with Er, the error (%) committed on the map of IV or EV index; Unc, the uncertainty on the map of IV index (UncI) or EV index (UncE); I, IV index (IIV) or EV index (IEV).
The error of the final map (map of pollution risk areas), Ef, was obtained by the following calculation (Equation (8)):
 (8)
(8)
Two sensitivity tests were performed: the map removal sensitivity analyses introduced by [23] and the single-parameter sensitivity analysis introduced by [21].
The map removal sensitivity measure identifies the sensitivity of the IV map towards removing one map from the suitability analysis and is computed in the following way (Equation (9)):
 (9)
(9)
where S is the sensitivity measure expressed in terms of variation index, V and Vi are the unperturbed and the perturbed vulnerability indices respectively, and N and n are the number of data layers used to compute V and Vi. The actual vulnerability index obtained using all seven parameters was considered as an unperturbed vulnerability while the vulnerability computed using a lower number of data layers was considered as a perturbed one.
The single-parameter sensitivity measure was developed to evaluate the impact of each of the intrinsic parameters on the vulnerability index [24]. It has been made to compare the effective weight of each input parameter in each polygon with the GIS-MCA modeling weight assigned by the model. The effective weight of each poly-

Table 3. Pairwise comparison matrix for weighting assigned in vulnerability factors.
gon is obtained using the following formula (Equation (10)):
 (10)
(10)
where W refers to the effective weight of each parameter, Pr and Pw are the rating value and weight of each parameter and V is IV index.
3. Results and Discussion
3.1. Intrinsic Parameters and Intrinsic Vulnerability Map
The depth to groundwater was generally low throughout the study area and varied from 0.2 m to 8.9 m. (D) parameter had high negative correlation with nitrates concentration (Figure 2(a)). Hence, the deeper the depth to water table the lesser the chance of pollutants to arrive to the water table and the greater for pollutants to be attenuated. Therefore, at low water table areas, pollutants have less time to be removed by biological and chemical processes such as reaction with existing material at soil media and unsaturated zone, hence reach to groundwater rapidly. However, at high water table areas, the mentioned processes have more time for removing the pollutants and therefore aquifer has no pollution risk at these areas. These findings are in agreement with those reported by [25] who assessed Aquifer Vulnerability in Kherran Plain, Khuzestan (Iran).
Net recharge values varied from 27.14 mm to 857.63 mm. The parameter (R) was also strongly negatively correlated with nitrates (Figure 2(b)). This can be explained by a dilution phenomenon. Indeed, the main source of groundwater recharge in the study area is precipitation which percolates from the ground surface and infiltrates through the soil and the unsaturated zone to reach the aquifer. The first rains can easily transport a lot of contaminants to groundwater. With the intensification of rainfall, the aquifer receives an important volume of water which dilutes nitrates concentration of groundwater. Thus, the greater the recharge, the lesser vulnerable is the aquifer to contamination.
The grain size average (Mz) varied from 389 µm to and 1019 µm. Using particle size classes defined by [14, 15], these soil sediments are medium sand (389 µm ≤ Mz <500 µm) and coarse sand (500 µm < Mz ≤ 1019 µm). These sandy formations were negatively correlated with nitrate concentrations (Figure 2(c)). This significant correlation reveals that the topsoil influence the nitrates concentration of the groundwater in the study area and it may be attributed to the presence of reduction reactions in the soil zone due to oxygen deficiency.
Generally, slope in the study area was low and its value was less than 2% (Figure 2(d)). Associated with a higher hydraulic conductivity of unsaturated zone (Figure 2(e)), there is a relatively greater potential for nitrate pollution. That explains the significant correlations obtained between these pollutants and (T) and (K).
Unlike other previous parameters, (A) is not statistically significant (Figure 2(f)). This reflects the lack of heterogeneity of the lithology of the aquifer which can change the migration speed of the flow of pollution. This parameter should be excluded.
Therefore, the IV index map was computed applying a combination of (D), (R), (S), (T) and (K) parameters. This map shows moderate to very high intrinsic vulnerability (Figure 3). Urban areas of Treichville, Marcory, Koumassi, Port-Bouet and Grand-Bassam were characterized by high to very high intrinsic vulnerability. This was due to the combination of low depth to water and low to moderate net recharge. These high to very high vulnerable zones cover 61.87% of the study area. Overall, the moderate intrinsic vulnerable zones (38.13%) were found in rural areas (Anani, Modeste, Maffiblé and Vitré I). These zones were characterized by relatively high net recharge (180 mm - 857.6 mm) and depth to water (4.5 m - 8.9 m). However, in the villages of Abouabou, Ellokro and Vitré II, the aquifer presented high intrinsic vulnerability to pollution. This pattern is mainly related to moderate recharge (100 mm - 180 mm) and low depth to
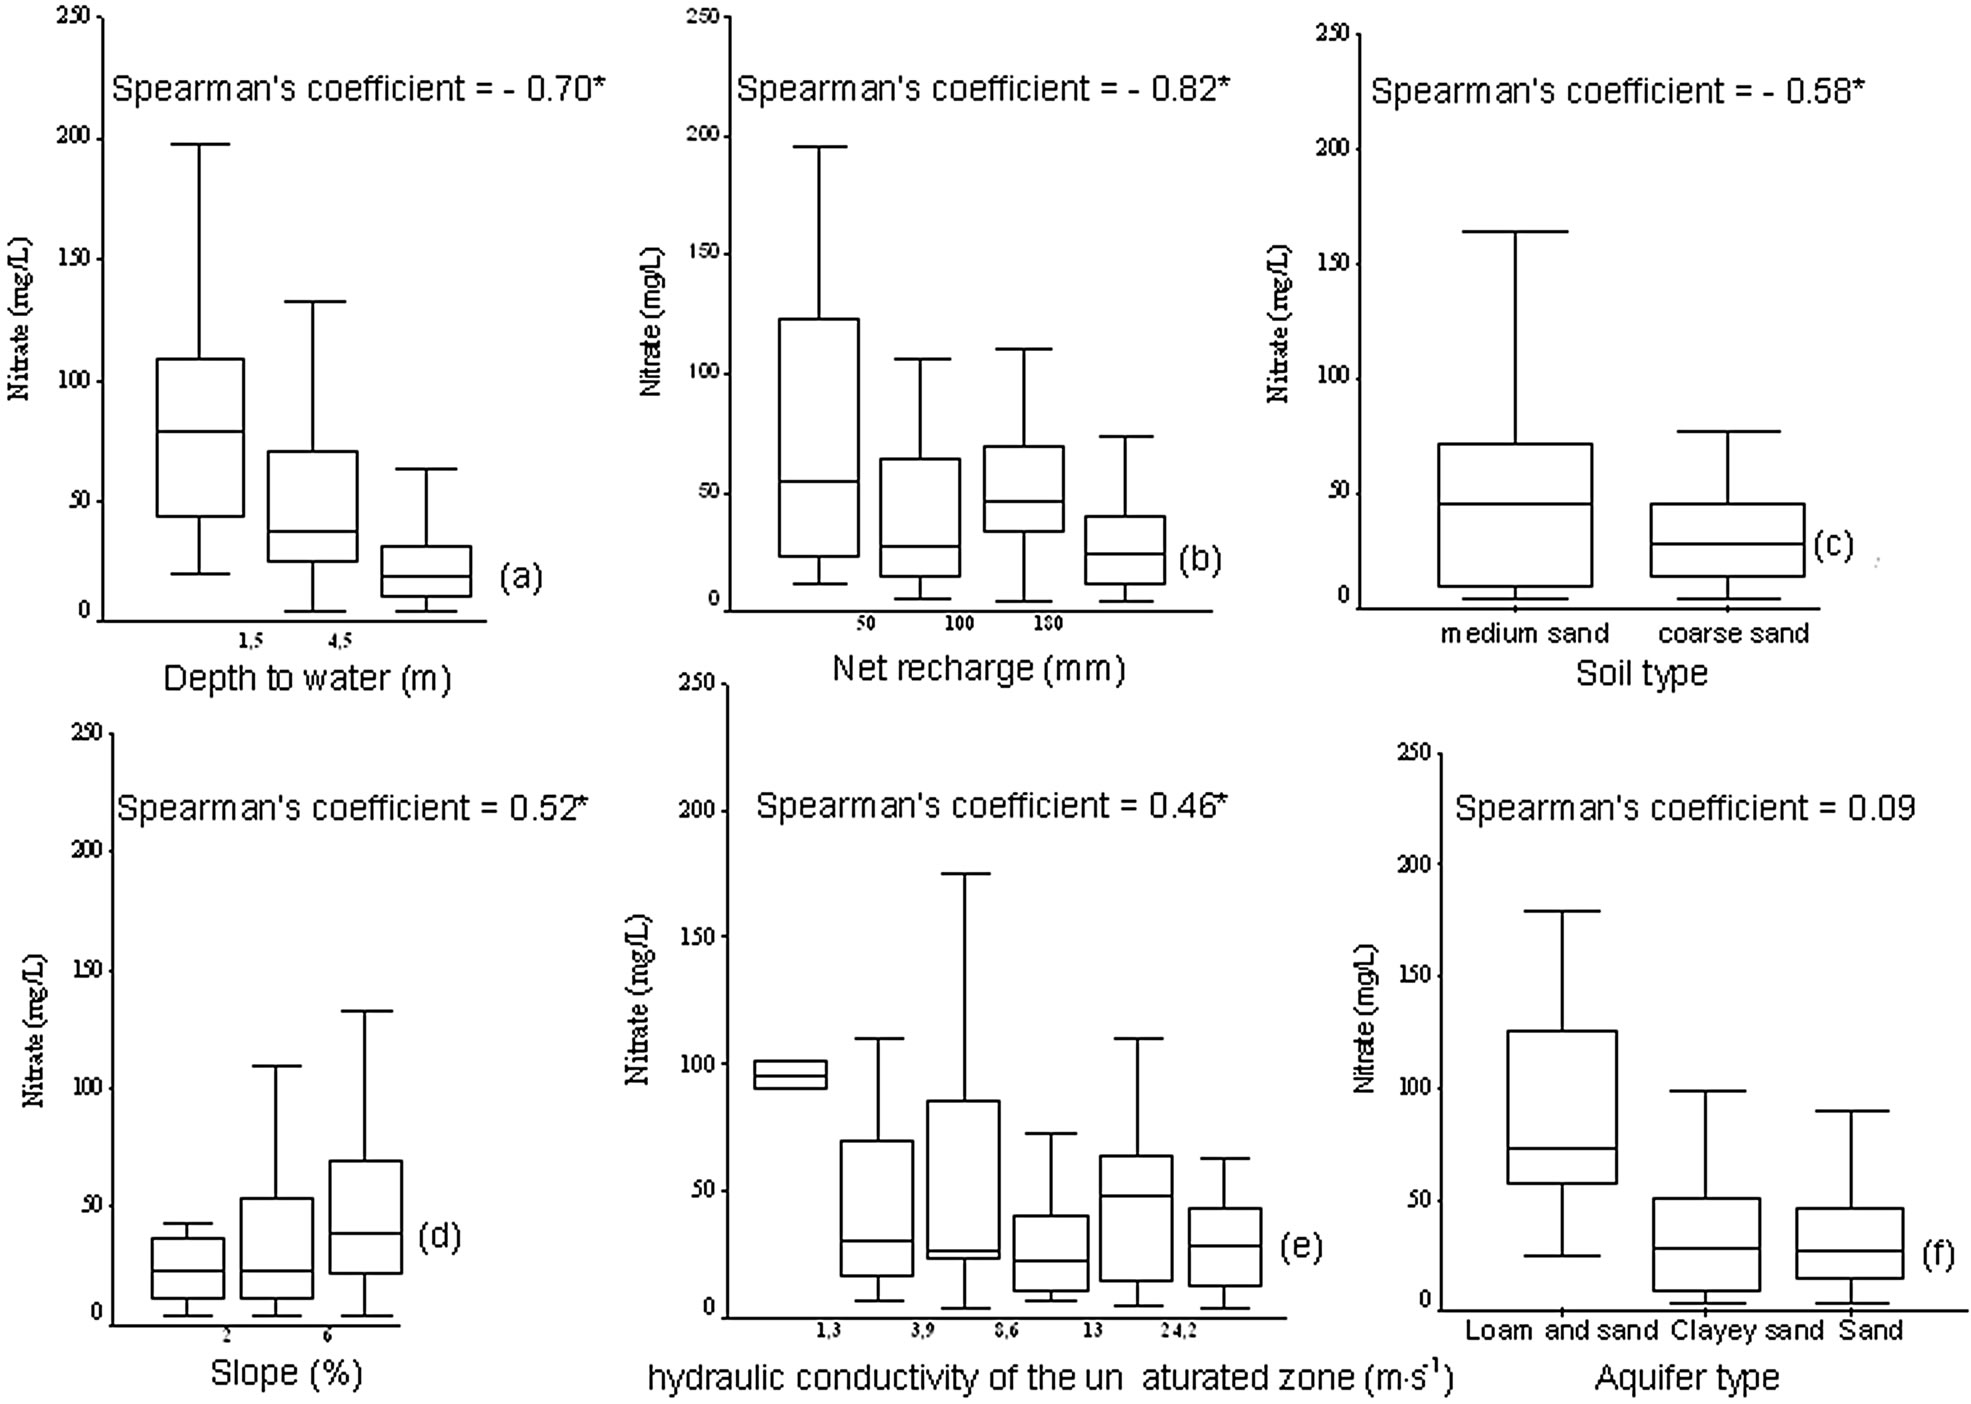
Figure 2. Distribution of groundwater nitrates concentration for the statistically different classes of Depth to water (a), Net recharge (b), Soil type (c), Slope (d), Hydraulic conductivity of unsaturated zone (e) and Aquifer type (f) parameters.
water (1.5 m - 4.5 m).
3.2. Extrinsic Vulnerability Map
The extrinsic vulnerability map (Figure 4) indicates that most of the urban centers (Treichville, Marcory, Koumassi, Port-Bouët and Grand-Bassam) which cover 36% of the study area had high extrinsic vulnerability to pollution because of the important potential source of nitrate pollution in these zones. Crop (palm, coconut), non-cultivated and rural zones produced a relatively high nitrates concentration but below the World Health Organization guideline value (50 mg∙L−1). These zones were characterized by moderate extrinsic vulnerability and cover more than half (59%) of the study site. However, swamp and forest areas which generated few pollutants had low extrinsic vulnerability. These zones only cover 5% of the study site.
3.3. Map of the Risk of Nitrate Pollution Risk
The average calculated index of IV and EV are 6.10 ± 1.25 and 6.00 ± 3.21 respectively. It appears that the IV and EV index were statistically similar. This indicates an equal contribution of these two indicators in assessing of nitrate pollution risk of groundwater in the study area. Hence, the pollution risk map (Figure 5) corresponds to combination of indicators from scenario 1 (Table 3).
The risk classes obtained from the model varied from moderate pollution risk to very high pollution risk.
Villages of Maffiblé, Anani, Abouabou, Ellokro, Modeste, Moossou, Vitré I and Vitré II were located in the moderate pollution risk zones (MPRZ) covering 50.7% of the study site. No industrial activities were found in the MPRZ.
The very high pollution risk zones (VHPRZ) and high pollution risk zones (HPRZ) were mainly located in the west, southwest and east of the study area. This pattern is attributed to the fact that VHPRZ and HPRZ coincide with areas of high population density at Treichville, Marcory, Koumassi, Port-Bouet and Grand-Bassam. Moreover, in these zones urban and industrial activities are concentrated. On the other land, these zones have high intrinsic vulnerability. VHPRZ and HPRZ cover 49.3% of the study area. Some high pollution risk zones can also
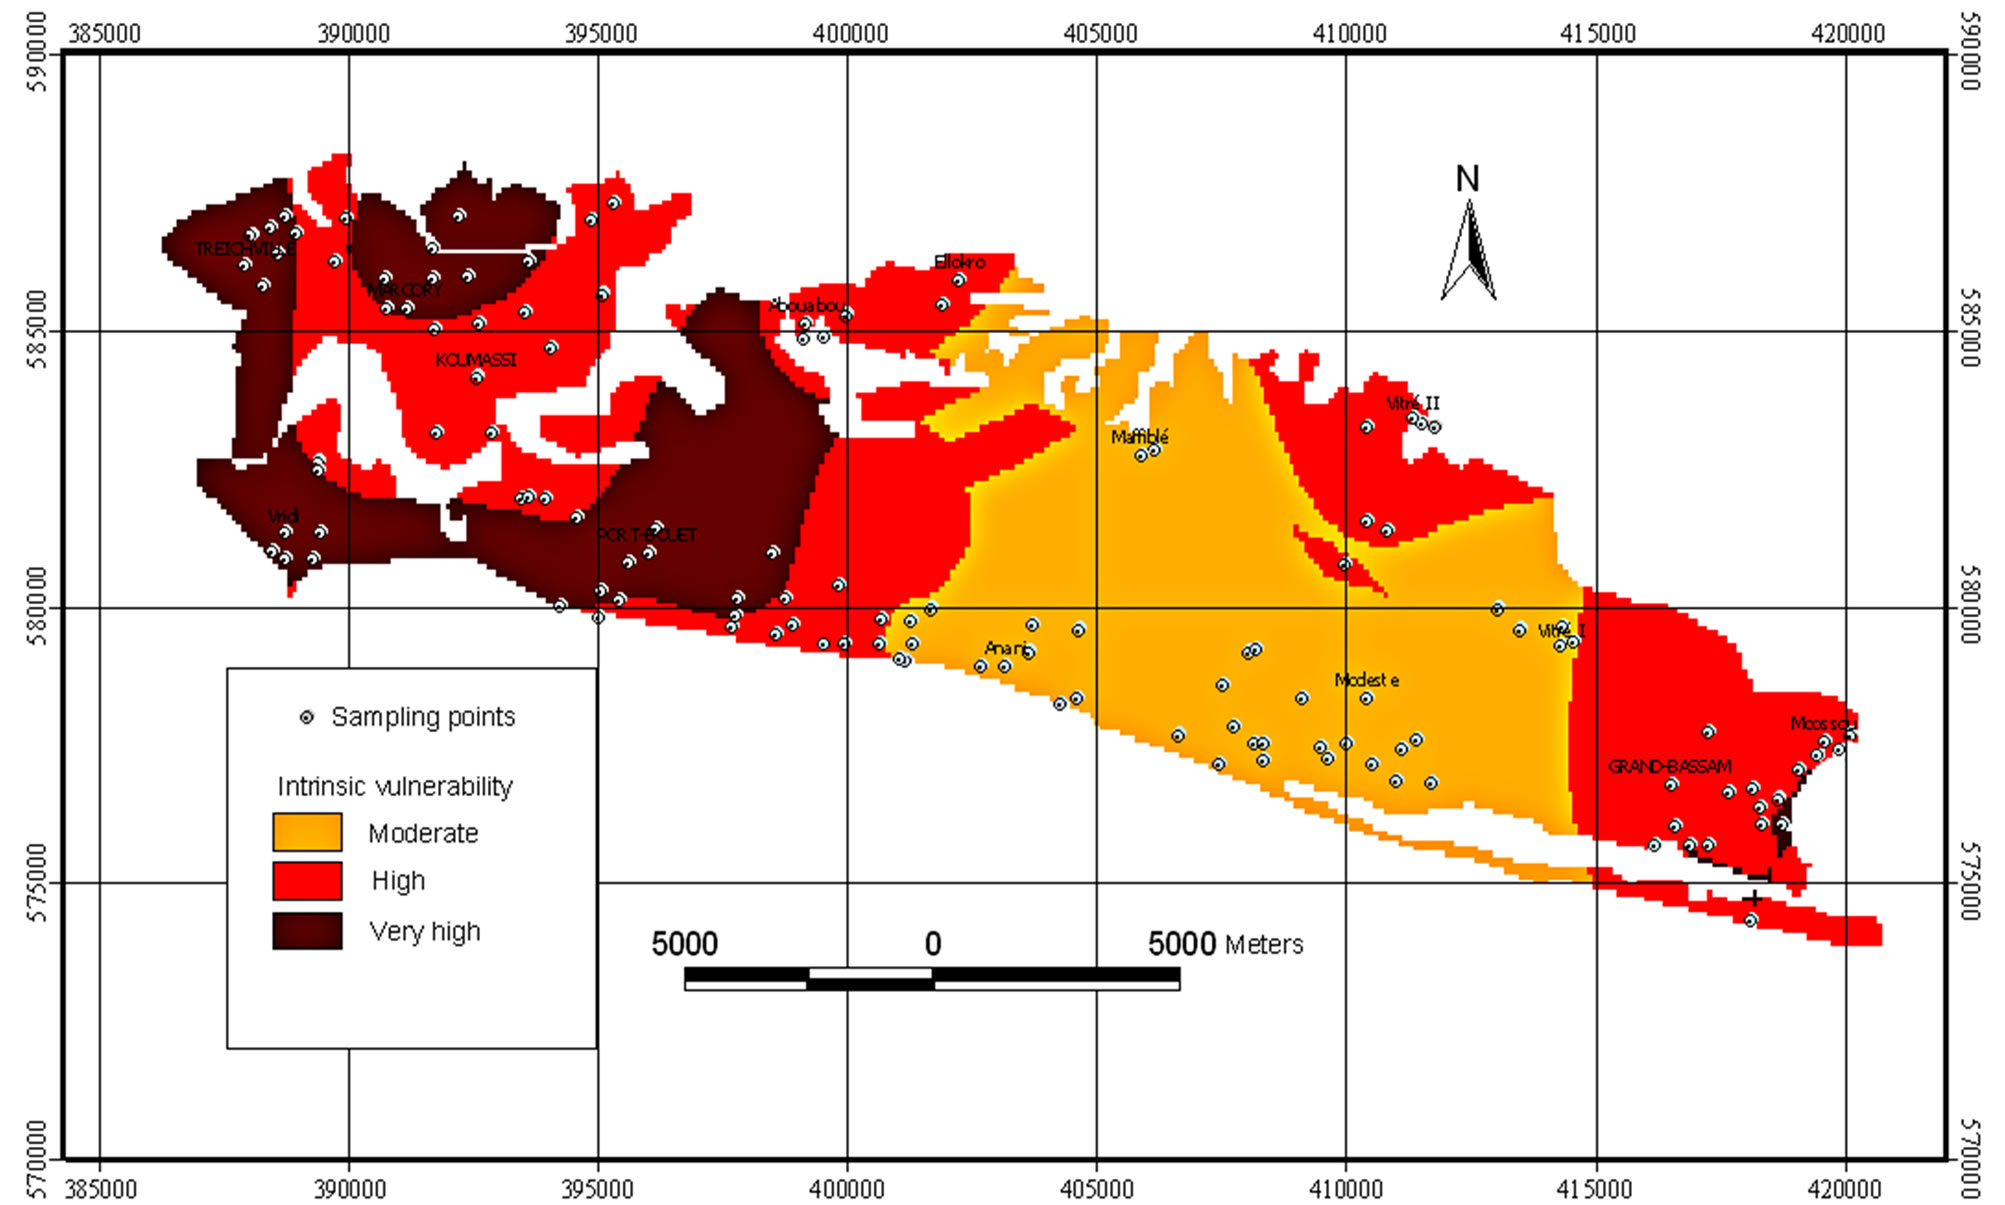
Figure 3. Intrinsic groundwater vulnerability map of the study area.
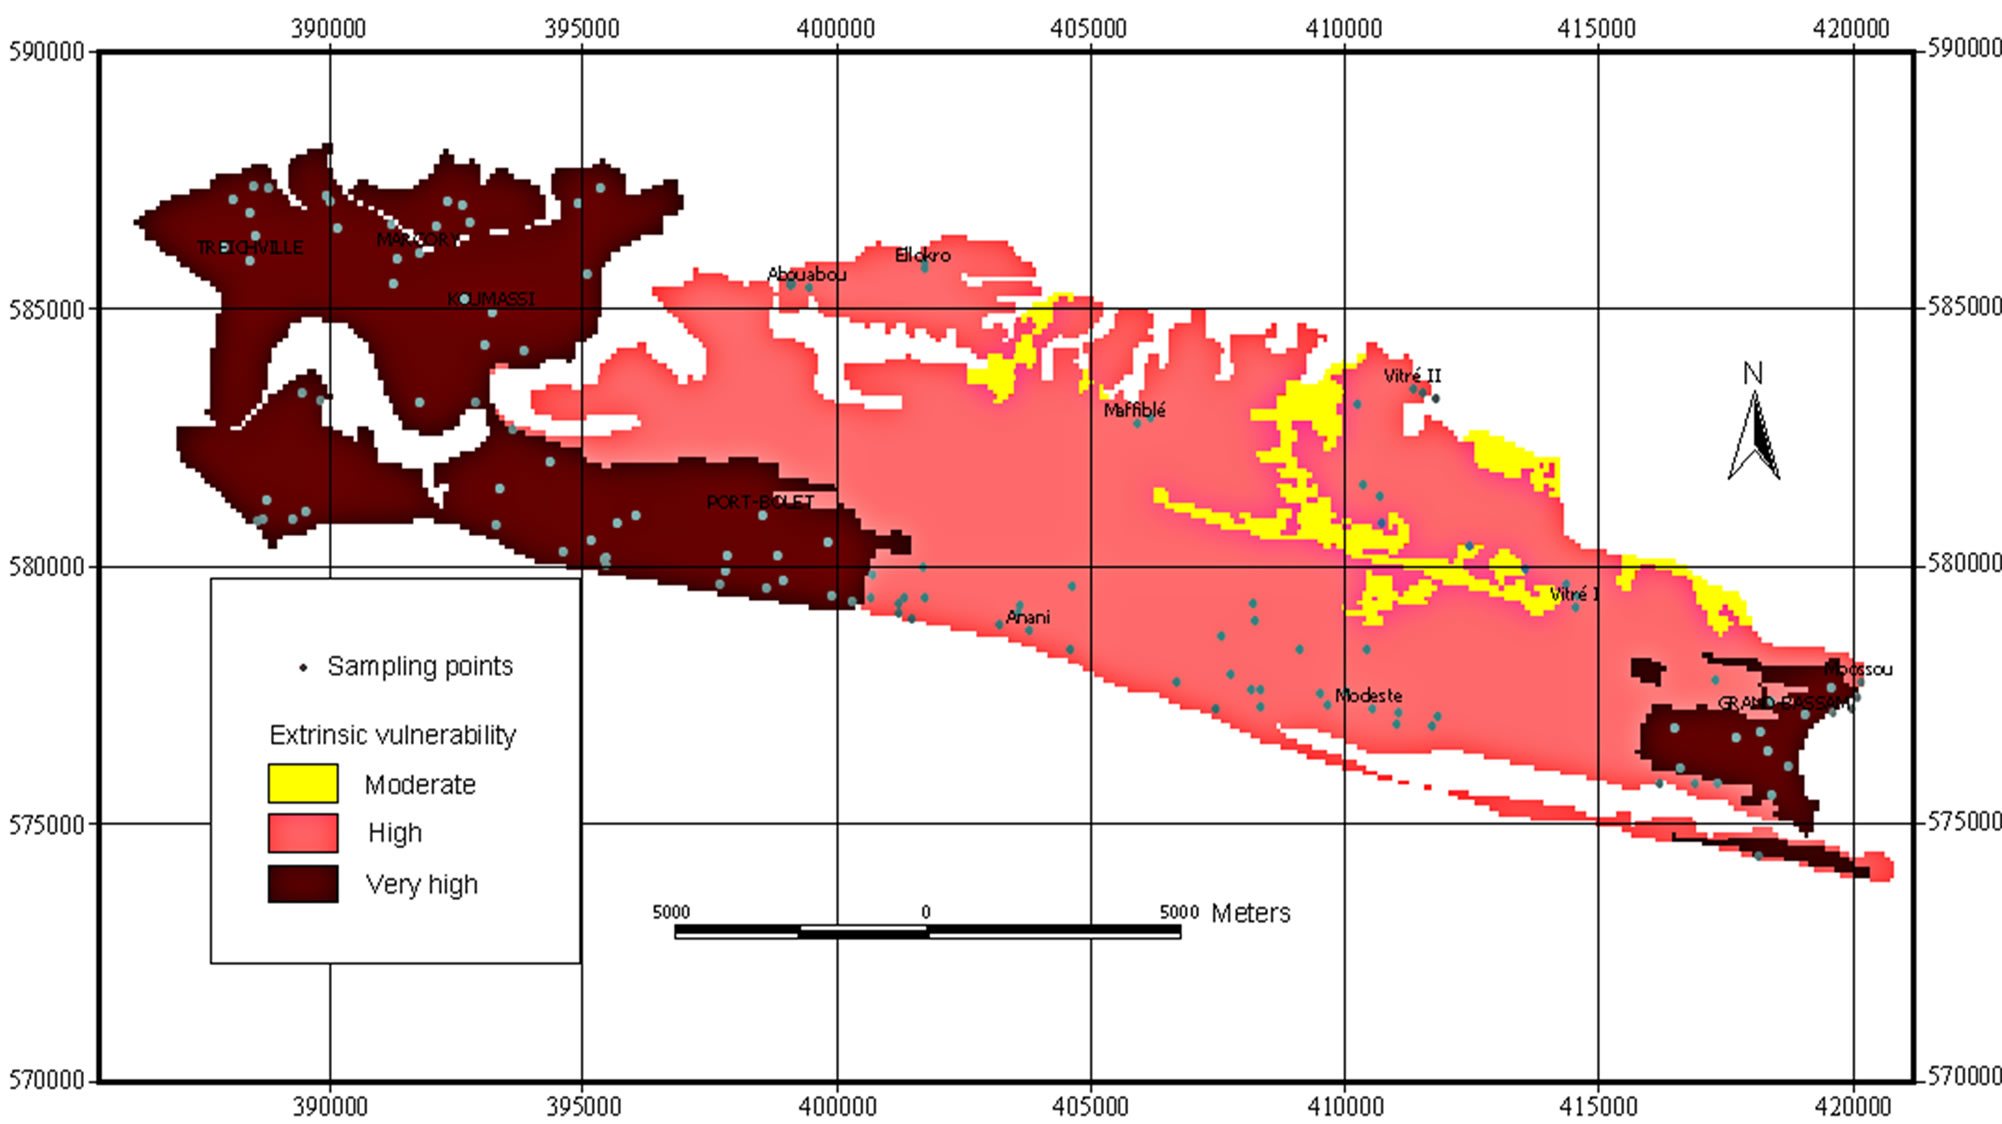
Figure 4. Extrinsic groundwater vulnerability map of the study area.
be seen in the outskirts of sectors such as Abouabou, Ellokro, Moossou Vitré I. This was due to the development of traditional agricultural farms, the use of pit latrines which can be potential sources of nitrogen pollu-
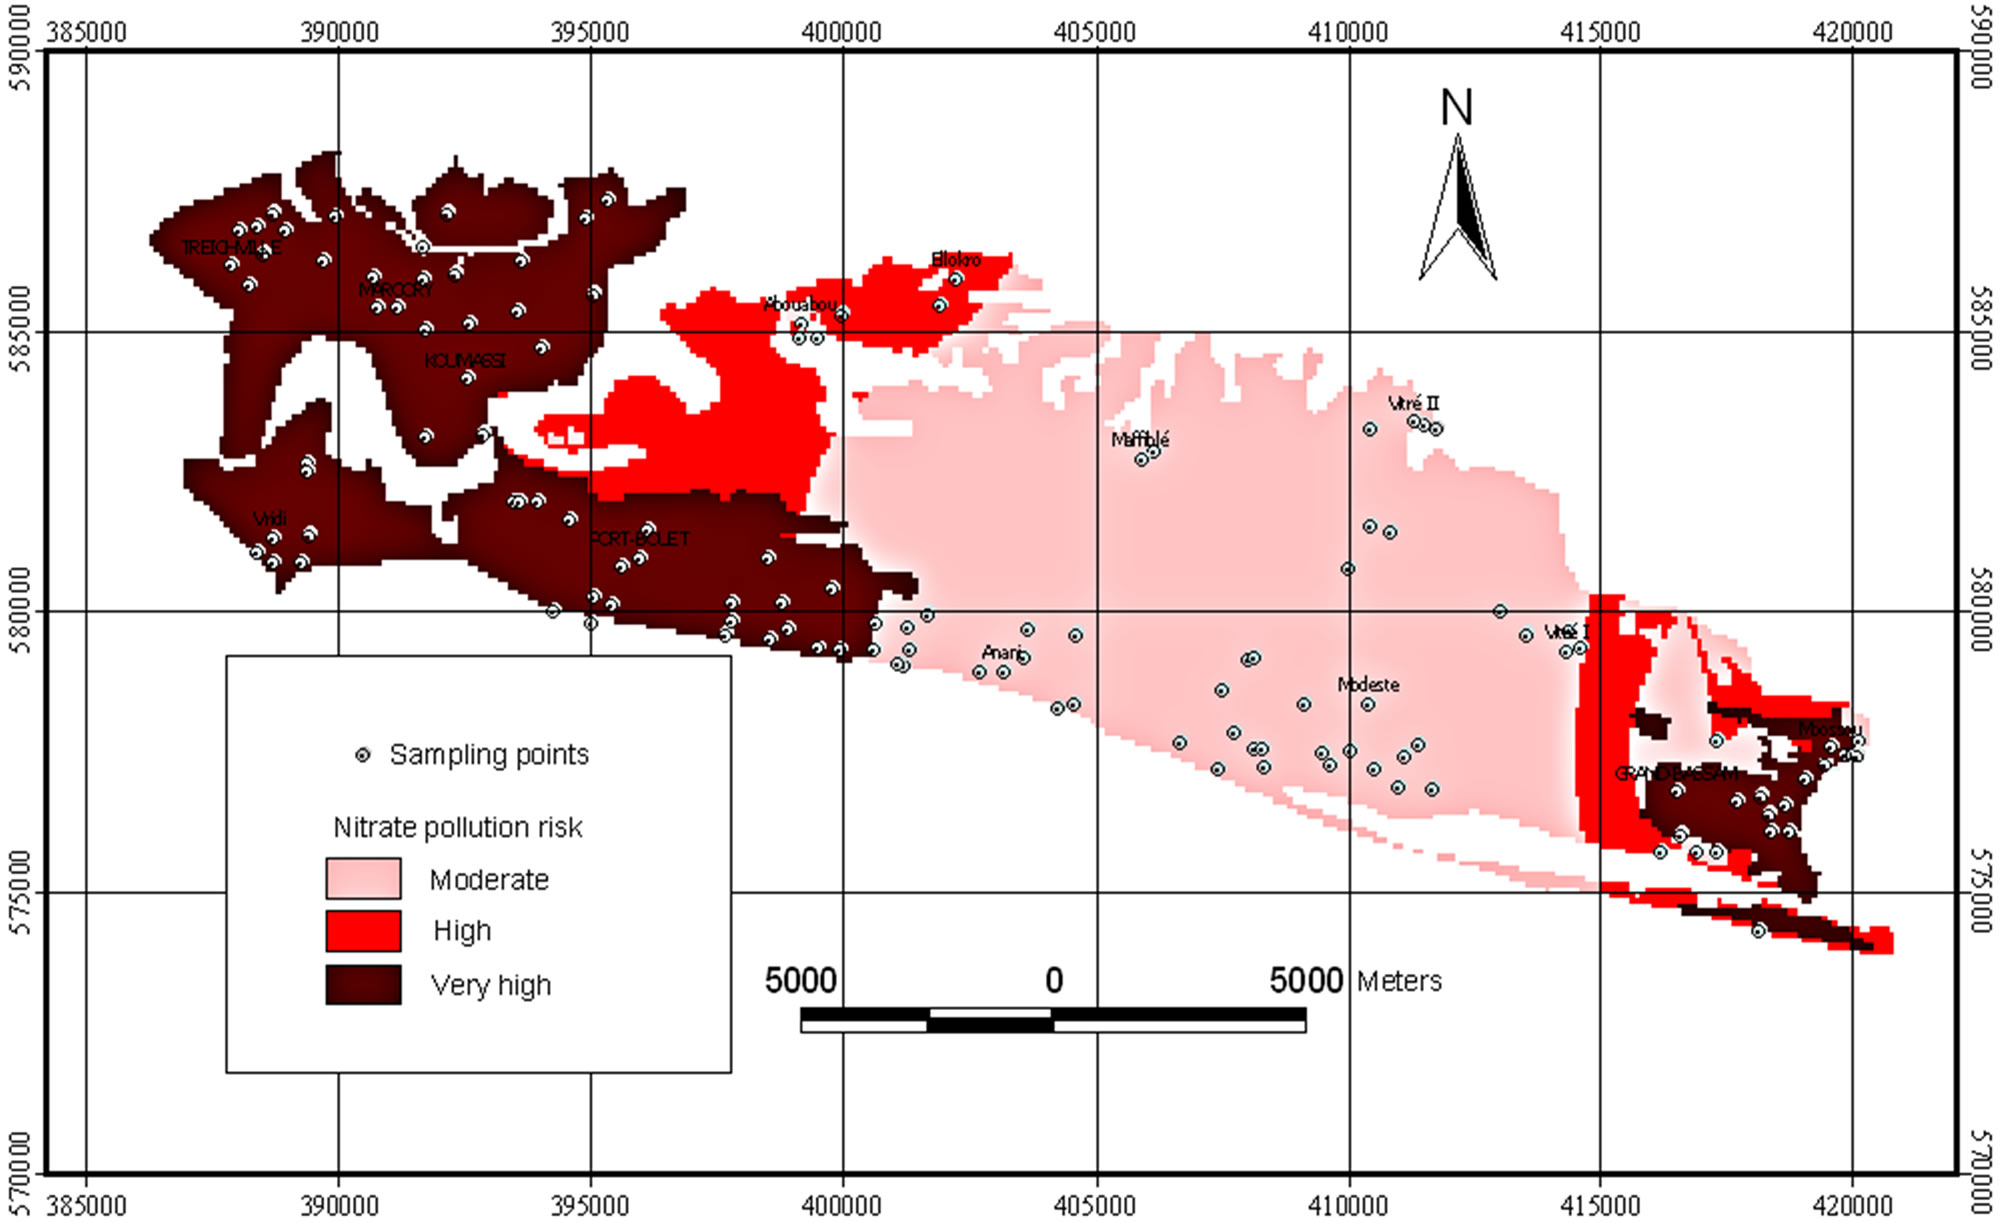
Figure 5. Groundwater pollution risk zonation in the study area.
tion in these rural areas.
3.4. Sensitivity Analysis
The uncertainty analysis computed by determining confidence levels is presented in Table 4.
All parameters of IV had low uncertainties with confidence levels of 99% for (D), (S), and (R), 95% for (T) and 68% for (K). Accordingly, the variation coefficients were low on the parameters (S) (23.22%), (D) (32.32%) and (T), and high on parameter (K) (67.58%). The net recharge had also high variation coefficient of 71.24%.
These low uncertainties can be attributed to low measurements and sampling errors of the field data collected or low spatial sources of variation at distances smaller than the sampling interval or both. Furthermore, the application of the ordinary kriging to produce value prediction surfaces of the parameters using their spatial continuities achieved unbiased estimations. This gives a high reliability to the map these parameters allow us to make.
Table 5 shows the results of calculation errors on the maps of extrinsic vulnerability, intrinsic vulnerability and nitrate pollution risk. The errors are ±0.15% and ±0.40% respectively on IV and EV maps. The nitrate pollution risk representing the combination of the two previous maps gave a low error percentage of ±6%. Therefore, the confidence levels of these maps were 68% for EV and 95% for IV and nitrate pollution risk. This indicates the final map has a high reliability to be a decision making tool for developing plans and regulations and in implementing actions to reduce human health risks.
3.5. Map Removal Sensitivity Analysis
Table 6 shows the statistics on sensitivity to removal of one statistically significant parameter on the IV values.
The most sensitive parameters to contamination were net recharge and depth to water, followed in importance by soil media, topography, and hydraulic conductivity of unsaturated zone. The highest values were associated with (R) (0.410) and (D) (0.236). The parameter (K) showed the lowest sensitivity value (0.054). In comparison, the measure of (R) influence on the IV index obtained in this study is consistent with that of [13] who found the removal of (R) caused large variation in aquifer vulnerability index in Kakamigahara (central Japan).
Table 7 shows the statistics of the calculated effective weights. (R) and (D) show the highest effective weights. This means these parameters are the most significant environmental factors which dictate the high vulnerability of the Quaternary aquifer. As shown in this table, the effective weight for each parameter coincides with the weight assigned by the GIS-MCA model. This indicates GIS modeling associated with MCA in this study re-
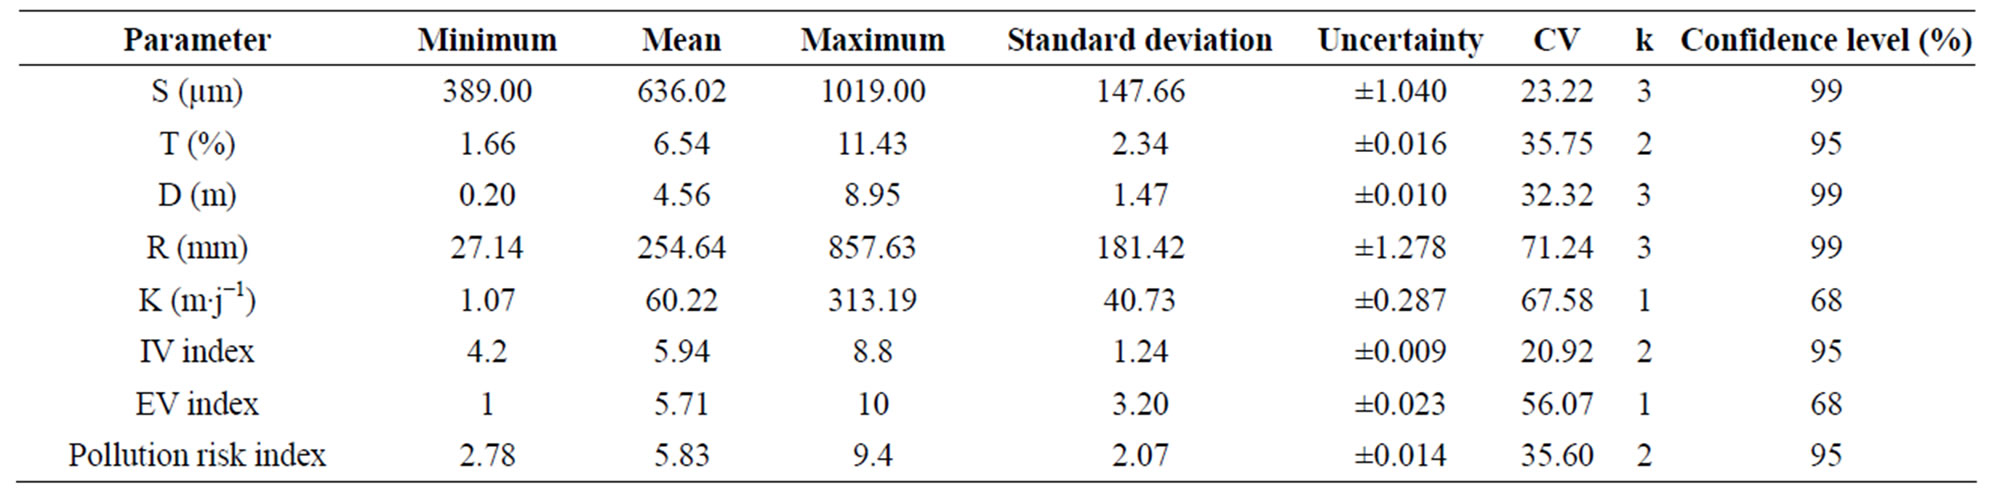
Table 4. Statistics of the vulnerability factors.
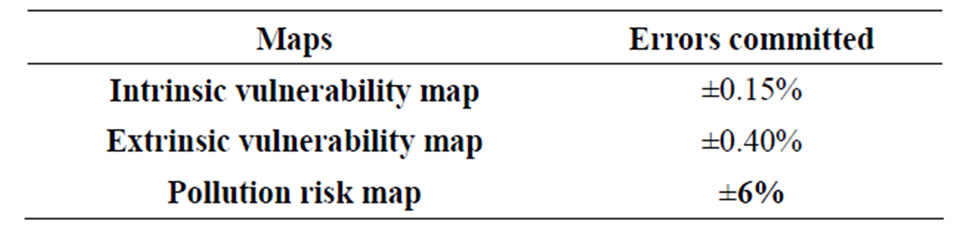
Table 5. Errors committed on the vulnerability maps.
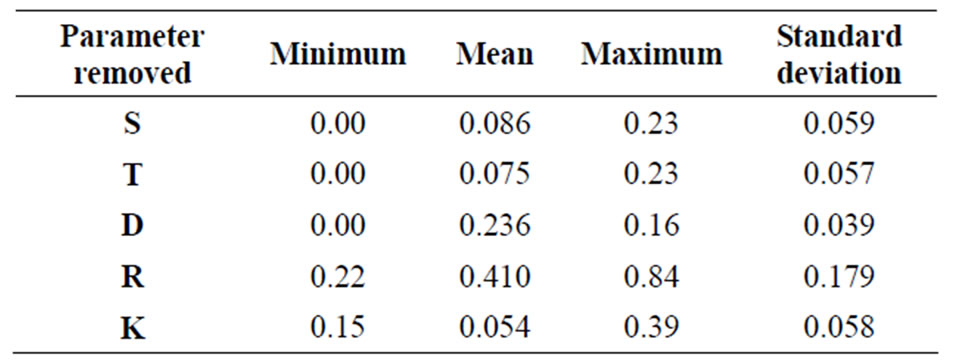
Table 6. Statistics of the map removal sensitivity analysis.

Table 7. Statistics of the single parameter sensitivity analysis.
duced subjectivity in the selection of rating ranges and increased reliability for assessing Quaternary aquifer vulnerability to contamination.
4. Conclusions
The nitrate pollution risk zones mapping of the study area is a decision-making tool for developing plans and regulations and in implementing actions to reduce human health risks.
Thus, VHPRZ and HPRZ are considered as unable to provide better access to drinking water safety. Installation of water supply for drinking in the MPRZ should be preceded by consultations with experts in hydrogeology. In this way, precautions to control risks must be taken. These might include the establishment of proper distances to sources of pollutants such as latrines or farms, ideally defined based on the travel time between wells and sources of pollution, achieving a proper finishing wellhead equipped with a hand pump, using a mortar joint in the coating of dug wells, installation and maintenance of a hand pump, or other means no health risk to extract water.
The evolution of soil and its geomorphology evolution, anthropogenic activities and climatic variations can change the geological, geomorphological and hydrogeological parameters considered here for assessing of quaternary groundwater vulnerability. The use of a GIS can view and easily update the zoning established.
5. Acknowledgements
We would like to extend our sincere thanks to the local authorities (Treichville, Marcory, Port-Bouet, Koumassi, Grand-Bassam) and to the chiefs of villages (Abouabou, Maffiblé, Anani, Modeste, Moossou, Vitré I et Vitré II) for allowing us to carry out different investigations in their jurisdiction.
REFERENCES
- R. C. Gogu and A. Dassargues, “Current Trends and Future Challenges in Groundwater Vulnerability Assessment Using Overlay and Index Methods,” Environmental Geology, Vol. 39, No. 6, 2000, pp. 549-559. http://dx.doi.org/10.1007/s002540050466
- L. Aller, T. Bennett, J. H. Lehr, R. J. Petty and G. Hackett, “DRASTIC: A Standardised System for Evaluating Ground Water Pollution Potential Using Hydrogeologic Settings,” Environmental Protection Agency Report, 1987, pp. 38- 57.
- A. El Hanini, A. Added and S. Abdeljaoued, “A GIS-Based DRASTIC Model for Assessing Phreatic Aquifere of Bekalta (Tunisian Sahel),” Journal of Geographic Information System, Vol. 5, No. 3, 2013, pp. 242-247. http://dx.doi.org/10.4236/jgis.2013.53023
- A. H. Jasem and M. Alraggad, “Assessing Groundwater Vulnerability in Azraq Basin Area by a Modified DRASTIC Index,” Journal of Water Resource and Protection, Vol. 2, No. 11, 2010, pp. 944-951. http://dx.doi.org/10.4236/jwarp.2010.211112
- A. M. Al-Rawabdeh, N. A. Al-Ansari, A. A. Al-Taani and S. Knutsson, “A GIS-Based Drastic Model for Assessing Aquifer Vulnerability in Amman-Zerqa Groundwater Basin, Jordan,” Engineering, Vol. 5, No. 5, 2013, pp. 490-504. http://dx.doi.org/10.4236/eng.2013.55059
- N. Bilgehan, C. Tayfun, I. Fatih and B. Ali, “Selection of MSW Landfill Site for Konya, Turkey Using GIS and Multi-Criteria Evaluation,” Environmental Monitoring Assessment, Vol. 160, No. 1-4, 2010, pp. 491-500. http://dx.doi.org/10.1007/s10661-008-0713-8
- I. Doumouya, B. Dibi, I. K. Kouame, B. Saley, J. P. Jourda, I. Savane and J. Biemi, “Modelling of Favourable Zones for the Establishment of Water Points by Geographical Information System (GIS) and Multicriteria Analysis (MCA) in the Aboisso Area (South-East of Côte d’Ivoire),” Environmental Earth Science, Vol. 67, No. 6, 2012, pp. 1763-1780. http://dx.doi.org/10.1007/s12665-012-1622-2
- B. Dibi, K. I. Kouame, A. B. Konan-Waidhet, I. Savane, J. Biemi, V. Nedeff and G. Lazar, “Impact of Agriculture on the Quality of Groundwater Resources in Peri-Urban Zone of Songon (Côte d’Ivoire),” Environmental Engineering and Management Journal, Vol. 11, No. 12, 2012, pp. 2173-2182.
- S. Issiaka, G. B. T. Albert, D. G. Aristide and K. K. Innocent, “Vulnerability Assessment of Abidjan Quaternary Aquifer Using the DRASTIC Method,” In: Y. Xu and B. Usher, Eds., Groundwater Pollution in Africa, Taylor & Francis/Balkema, Leiden, 2006, pp. 115-124.
- D. Thirumalaivasan, M. Karmegam and K. Venugopal AHPDRASTIC: Software for Specific Aquifer Vulnerability Assessment Using DRASTIC Model and GIS,” Environmental Modeling & Software, Vol. 18, No. 7, 2003, pp. 645-656. http://dx.doi.org/10.1016/S1364-8152(03)00051-3
- N. C. Brady and R. R. Weil, “The Nature and Properties of Soils,” 13th Edition, Macmillan Publishing Co. Inc., New York, 2002.
- R. W. Healy and P. G. Cook, “Using Groundwater Levels to Estimate Recharge,” Hydrogeology Journal, Vol. 10, No. 1, 2002, pp. 91-109. http://dx.doi.org/10.1007/s10040-001-0178-0
- I. S. Babiker, M. A. A. Mohamed, T. Hiyama and K. K. Kikuo, “A GIS-Based DRASTIC Model for Assessing Aquifer Vulnerability in Kakamigahara Heights, Gifu Prefecture, Central Japan,” Science of the Total Environment, Vol. 345, No. 1-3, 2005, pp. 127-140. http://dx.doi.org/10.1016/j.scitotenv.2004.11.005
- G. M. Friedman, “Dynamic Processes and Statistical Parameters Compared for Size Frequency Distribution of Beach and River Sands,” Journal of Sedimentary Petrology, Vol. 37, No. 2, 1967, pp. 327-354. http://dx.doi.org/10.1306/74D716CC-2B21-11D7-8648000102C1865D
- R. L. Folk, “Petrology of Sedimentary Rocks,” Hemphill Publishing Company, Austin, 1974.
- S. Ettazarini and N. El Mahmouhi, “Vulnerability Mapping of the Turonian Limestone Aquifer in the Phosphates Plateau (Morocco),” Environmental Geology, Vol. 46, No. 1, 2004, pp. 113-117. http://dx.doi.org/10.1007/s00254-004-1022-3
- R. K. Prasad, N. C. Mondal, B. Pallavi, M. V. Nandakumar and V. S. Singh, “Deciphering Potential Groundwater Zone in Hard Rock through the Application of GIS,” Environmental Geology, Vol. 55, No. 3, 2008, pp. 467- 475. http://dx.doi.org/10.1007/s00254-007-0992-3
- G. A. Douagui, K. I. Kouamé, K. Koffi, B. T. A. Goula, B. Dibi, L. D. Goné, K. Coulibaly, M. A. Séka, K. A. Kouassi, O. M. J. Mangoua and I. Savané, “Assessment of Bacteriological Quality and Nitrate Pollution Risk of the Quaternary Groundwater in the Southern Part of Abidjan District (Côte d’Ivoire),” Journal of Hydro-Environment Resources, Vol. 6, No. 3, 2012, pp. 227-238. http://dx.doi.org/10.1016/j.jher.2012.05.001
- F. Wilcoxon, “Individual Comparisons by Ranking Methods,” Biometrics Bulletin, Vol. 1, No. 6, 1945, pp. 80-83. http://dx.doi.org/10.2307/3001968
- T. L. Saaty, “How to Make a Decision: The Analytic Hierarchy Process,” European Journal of Operational Research, Vol. 48, No. 1, 1990, pp. 9-26. http://dx.doi.org/10.1016/0377-2217(90)90057-I
- Z. El Morjani, “Conception d’un Système d’information à Référence Spatiale pour la Gestion Environnementale; Application à la Sélection de Sites Potentiels de Stockage de Déchets Ménagers et Industriels en Région Semi-Aride (Souss, Maroc),” Thèse, Université de Genève, Terre Environnement, Suisse, 2003.
- G. P. Panagopoulos, A. K. Antonakos and N. J. Lambrakis, “Optimization of the DRASTIC Method for Groundwater Vulnerability Assessment via the Use of Simple Statistical Methods and GIS,” Hydrogeology Journal, Vol. 14, No. 6, 2006, pp. 894-911. http://dx.doi.org/10.1007/s10040-005-0008-x
- W. A. Lodwik, W. Monson and L. Svoboda, “Attribute Error and Sensitivity Analysis of Maps Operation in Geographical Information Systems—Suitability Analysis,” International Journal of Geographical Information Système, Vol. 4, No. 4, 1990, pp. 413-428. http://dx.doi.org/10.1080/02693799008941556
- P. Napolitano and A. G. Fabbri, “Single Parameter Sensitivity Analysis for Aquifer Vulnerability Assessment Using DRASTIC and SINTACS,” In: K. Kovar and H. P. Nachtnebel, Eds., HydrolGis Application of Geographic Information Systems in Hydrology and Water Resources Management, IAHS Publication, Vol. 235, 1996, pp. 559- 566.
- M. Chitsazan and Y. Akhtari, “A GIS-based DRASTIC Model for Assessing Aquifer Vulnerability in Kherran Plain, Khuzestan, Iran,” Water Resource Management, Vol. 23, No. 6, 2009, pp. 1137-1155. http://dx.doi.org/10.1007/s11269-008-9319-8