Journal of Environmental Protection
Vol. 3 No. 12 (2012) , Article ID: 25648 , 10 pages DOI:10.4236/jep.2012.312178
Assessing the Sensitivity of Climate Change Targets to Policies of Land Use, Energy Demand, Low Carbon Energy and Population Growth
![]()
Cambridge Centre for Climate Change Mitigation Research, University of Cambridge, Cambridge, UK.
Email: djc77@cam.ac.uk
Received August 22nd, 2012; revised September 19th, 2012; accepted October 21st, 2012
Keywords: Climate Change; Policy; Sensitivity Analysis
ABSTRACT
A reduced scale model of the coupled carbon cycle, population dynamics, energy system and land use characteristics is used to assess the sensitivity of atmospheric carbon to a variety of policies. Policies simulated include reduction of the rate of growth of the population; reduction of the rate of conversion of forested land to cropland; reduction in per capita energy demand in developed nations; reduction in per capita energy demand in developing nations; reduction in the carbon intensity of energy production in developed nations; and reduction in the carbon intensity of energy production in developing nations. For each policy, both the time to onset of the policy and the fractional annual rate of change in the associated model variable are established. Using as a measure of sensitivity the extension in years required for atmospheric carbon to reach the policy ceiling of 1160 BMT, achieved at a policy that introduces a rate of change in each affected model variable of 0.05 per year (a 5% change per year), then the policies in decreasing order of sensitivity are: Developing nations per capita growth (17 years), Developing nations carbon intensity (17 years), Population control (11 years), Developed nations carbon intensity (2.9 years), Developed nations per capita growth (2.8 years) and Land use (1.3 years). These values are all approximately doubled when population is stabilised first. An analysis of the model results also shows a convergence of the developed and developing nations per capita carbon emissions by 2100 when a portfolio of policies is selected to prevent a doubling of the pre-industrial revolution level of atmospheric carbon at any point in the future, consistent with a principle of “contract and converge”.
1. Introduction
Over the past several UNFCCC Conference of the Parties (COP) meetings, there has been a gradual shift in international climate change policy away from a sole reliance on emissions reductions to strategies that include adaptation and the capture and storage of atmospheric carbon dioxide. In part, this movement is due to recognition of the increasing likelihood that existing mitigation measures alone will fail to meet the previously stated target of keeping the increase in mean global temperature below 2˚C in the 21st century. Meinshausen et al. [1] demonstrate that meeting this policy target under even the most optimistic projections of emissions reductions alone is characterised by a confidence of no more than 50% - 60%, which is significantly lower than that in other areas of environmental protection or as suggested under the precautionary principle [2]. Hence the increasing focus on a portfolio of policy options that include mitigation measures controlling population growth, land use, energy efficiency, low carbon energy provision and demand reduction.
Following on the COP meetings, the world is moving towards a post-Kyoto Protocol era in which all of the nations of the world will be expected to contribute to decarbonising the global economy, with differentiated responsibilities and capabilities. This stems from increased recognition that if developed nations decarbonise, but developing nations remain on their current trajectories of growth of carbon emissions, it will not be possible to achieve the climate change targets set internationally (a less than 2 degrees C rise in mean global temperature, translating roughly into a doubling of the pre-industrial revolution levels of carbon dioxide in the atmosphere).
While this certainly is the case, it also is the case that the developed nations have a special responsibility to not only decarbonise their own economies, but to assist with decarbonisation of the developing nations [3,4]. This is both a matter of equity, justice and fairness on the one hand, and of economic and political reality on the other. The populations of developing nations understandably tie their economic development to increased access to the world's resources, including energy resources. The key to balancing these economic and climate aims lies in sustainable growth, which means a significantly lower carbon intensity (carbon dioxide released per unit of Gross Domestic Product or GDP) and enhanced presservation and even expansion of the carbon sequestration potential of land. Hence the need to find a path forward in which 1) the developed nations decarbonise; 2) this decarbonisation produces technology innovation and drives down costs of technologies so they become feasible for the developping nations to adopt; and 3) finance, knowledge and institutional capacity flow from the developed to developing nations to support adoption of low carbon technologies and practices.
A key issue in this global discussion is the relative effectiveness of different policies, applied differently across developed and developing nations, in regard to meeting the aim of avoiding a doubling of the pre-industrial revolution levels of atmospheric carbon. With pre-industrial levels of approximately 580 billion metric tons of carbon (BMT), the global policy aim is therefore to remain below an increase to 1160 BMT while allowing for sustainable economic growth in developing nations. The ability to reach this aim is driven by two considerations: the effect of developed and developing nations’ policies on atmospheric carbon if those policies have their intended impacts, and whether such policies can be implemented successfully—and have their intended impacts, including avoiding the rebound effect [5]—in the current political and economic arena.
The current paper explores the former issue: the effecttiveness of different policy approaches in achieving the aim of remaining below the 1160 BMT target of atmospheric carbon IF those policies were to be fully implemented and effective in their intent. “Policy approaches” here means policies that control 1) population growth; 2) land use (including deforestation); 3) introduction of low carbon energy to drive down the carbon intensity of energy use; and 4) energy demand reduction, or at least slowing the rate of growth of per capita energy demand. In addition, “policy approaches” means whether these 4 policy areas are applied primarily in the developed nations, primarily in the developing nations, or in both; and the time-scale and rate at which such policies are introduced and become effective globally. To perform the analysis in the current paper, a measure of sensitivity of the trajectory of atmospheric carbon to each policy approach is developed, and the combined effect of portfolios of policies assessed when applied to developed nations alone (the Annex I nations), developing nations alone and all nations simultaneously. The result is an increased capacity of decision-makers to understand the relative roles of these policy approaches in meeting the climate target of preventing a doubling of the pre-industrial revolution levels of atmospheric carbon.
2. Science and Policy Model
To perform the analysis, a computational model coupling the environmental system, land use, population growth and energy technologies is used to estimate the impact of changes in any of these on the amount of carbon dioxide in the atmosphere [6]. The model was developed initially as a simplified or reduced scale version of more computationally intensive models such as those employed by the IPCC in their analyses [7], allowing for more rapid assessments of the effects of policies such as might be required in policy negotiations. “Reduced Scale” refers to the fact that the model contains approximations and simplifications of the more complex models, leading to predictions that are equal to the central tendency values of these more complex models. Such a reduced scale model is not appropriate as a research tool, as it simplifies biogeochemical processes that underpin the systems behaviour of the carbon cycle, and the economic and other social processes that drive population growth, energy demand, land use and the uptake of low carbon technologies. It does, however, provide reasonable approximations to the results of the more complex models when focus is on the trajectory of increase in atmospheric carbon as components of the model are adjusted. Hence the reduced scale model is appropriate for the policyrelevant sensitivity analyses performed here.
The model components are shown in Figure 1. They consist broadly of a carbon cycle, population growth, societal energy use and land use the model as used here contains components for developed nations and developing nations in regard to the Population sub-model and the Energy Systems sub-model. The Land Use sub-model and the Carbon Cycle sub-model are global rather than region-specific. In the current paper, the Radiation Balance function is disabled because we are focussed on global atmospheric carbon dioxide as the policy aim.
The model is computationally the same as that in Crawford-Brown and LaRocca [6], with the exception that controls have now been added to land use, population growth, per capita energy demand and carbon intensity (emissions factors) to allow simulation of policies. These controls are of two forms necessary for the current analysis: a control on the year in which the policy is introduced in the developed nations, developing nations or both; and a control on the fractional annual rate at which the policy becomes effective in changing the associated variables within the model.
Throughout, the units of estimates of carbon dioxide in the atmosphere are billions of metric tons (BMT), and all
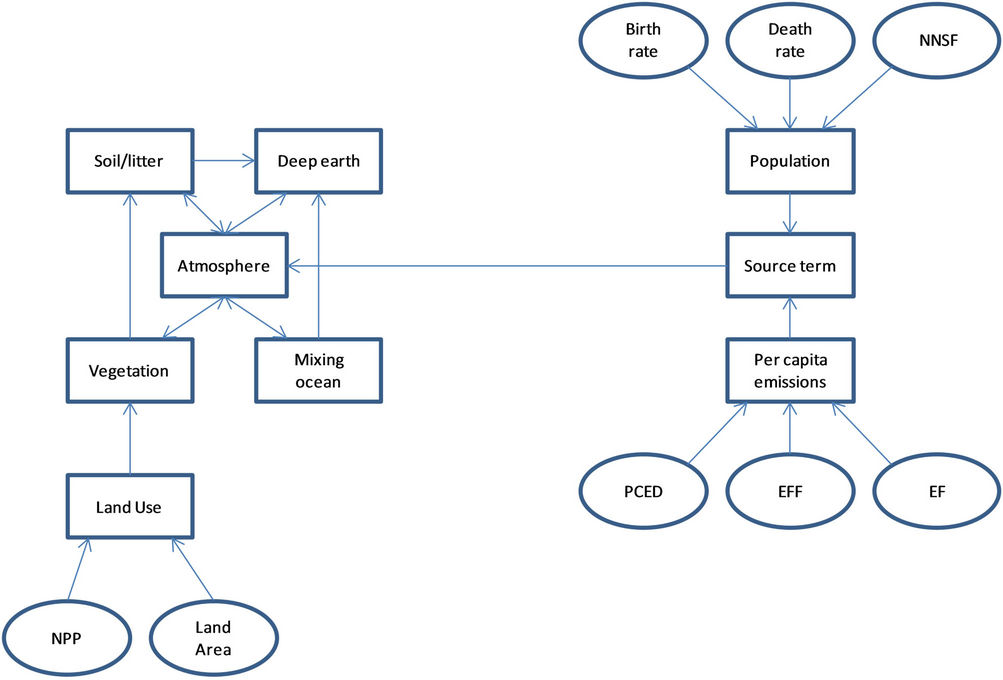
Figure 1. The model used in the present paper to assess the ability of policies to reduce atmospheric carbon. In the land use component of the model, NPP refers to the net primary productivity of vegetation (including but not restricted to forests) and land area is the total amount of land dedicated globally to each category of vegetation. PCED is per capita energy demand; EFF is the efficiency of the energy use; EF is the emissions factor or carbon intensity of energy provision. Separate values for these final three variables are provided for developed and developing nations.
other units are scaled accordingly. We follow only carbon dioxide, not all greenhouse gases. In addition, following climate science practice [8], the model follows carbon rather than carbon dioxide because carbon can appear in many chemical forms throughout the environmental system. There are no implications of this distinction in regard to the analysis performed here.
The mathematical details of the model are not provided here, both because these are provided in the originnal paper and due to the nature of the current paper, which is primarily addressed to a policy community rather than climate modellers. The underlying mathematics is a series of coupled zeroth and first order differential equations representing population growth, per capita carbon emissions (in turn influenced by per capita energy demand, efficiency of energy provision, and carbon intensity of energy provision) and the flow of carbon throughout the carbon cycle (including into and out of land/vegetation). All equations are solved numerically using Runge-Kutta 4 methodology [9], with time step selected to reduce approximation errors to less than 1% (approximation due to use of numerical solutions, not approximations due to the reduced scale nature of the model).
Two scientific points are relevant to the policy community, as they affect the reliability of the model as a tool for assessing the effect of policies on the international climate policy targets. First, as shown in the original paper [6], the model comports well with the estimates of trajectories of atmospheric carbon produced by the significantly more complex IPCC models. Second, the model agrees well with the measurements of atmospheric carbon obtained from the Mauna Loa data, providing an historical check on the reliability of the model for future projections.
3. Analysis
The above model is used here to examine the sensitivity of atmospheric carbon to the four sets of policies, and across the two sets of developed and developing nations. Hence the result is a 4 × 3 matrix of sensitivities, with the value of 3 arising from consideration of cases where policies are introduced in both developed and developing nations simultaneously. Some representative results (prior to turning to the issue of sensitivity analysis) are shown in Figure 2. The starting year here and in all subsequent figures is 1990, the year against which most international policies are compared. In Figure 2, the horizontal dashed (red; 1160) line represents the international policy ceiling of a doubling of the pre-industrial revolution atmospheric carbon (estimated to have been 580 BMT as mentioned previously). Curve A is the projection of levels of atmospheric carbon out to 2100 if current trends of population growth, per capita energy demand, emissions factors (carbon intensity) for the provision of energy and rates of land use change persist throughout this century. Note from these two curves that the world passes a doubling of atmospheric carbon (and violation of the international climate policy target) at some point mid-century.
Curve B is the projection of levels of atmospheric carbon if no policy is introduced other than population measures to stabilise the global population by 2040; it assumes per capita carbon dioxide emissions continue to rise in the developed and developing nations at current rates. There is no land use policy in place for this simulation, so current rates of deforestation and conversion to cropland continue unabated. Curve C is the same as Curve B, with the exception that deforestation has ceased globally by 2040 in addition to the policies introduced in Curve B. Note that if only these two policies are considered, stopping deforestation shifts the time to exceeding the policy ceiling by a little under 10 years. This is because the decrease in emissions from deforestation is small compared to the influence of the continuing rapid
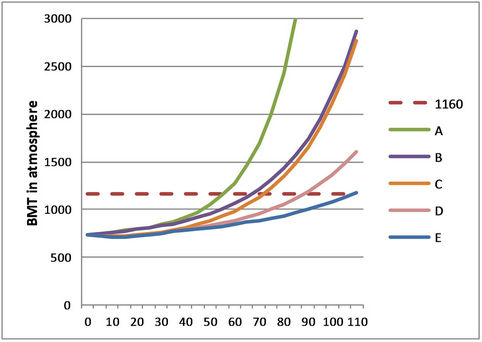
Figure 2. Estimates of the increase in atmospheric carbon (y-axis; units of billions of metric tons, or BMT) as a function of number of years since 1990 (x-axis) under the policy scenarios described in the text.
rise in per capita energy demand.
Curve D builds on Curve C, but now the carbon intensity of energy supplies for the economies of the developed nations decrease by 3% per year beginning in 2020, and the carbon intensity of the economies of the developing nations decrease by 1% per year beginning in 2020. Finally, Curve E is the same as Curve D, with the exception that the rates of decrease of the carbon intensity are 4% per year in the developed nations and 3% per year in the developing nations. Note that only in the case of Curve E does the atmospheric carbon remain below the policy target (red dashed line) out to 2100, although even this policy portfolio fails to prevent a doubling after 2100 (more on this later).
Figure 2 examines the cumulative effect of policies. We turn now to the sensitivity analysis for different policy measures, introduced one at a time. In each case, the measure of sensitivity is the number years by which the date of exceeding the red dashed line of Figure 2 is pushed back in time relative to the year 2045 in the baseline of Curve A in Figure 2. The “unit” of policy introduced is a 1% per year improvement in the affected variable in the model, where “improvement” means the variable is changed in the direction required to reduce the rate of growth of atmospheric carbon. Hence the policies simulated are:
• An X% per year slowing in the rate of population growth.
• An X% per year slowing in the rate of increase of per capita energy demand (baseline rate of growth is 2% per year in the developed nations and 4% per year in developing nations).
• An X% per year decrease in the carbon intensity of energy production (the carbon emissions factor in the model).
• An X% per year slowing in the rate of conversion of forest (with high NPP) to cropland (with lower NPP), which also decreases emissions from deforestation.
In all simulations, the year of application of a policy is 2020 (30 years after 1990). Once a policy is simulated, that aspect of the model is returned to the default values (generating Curve A in Figure 2) and the new policy simulated. Hence this study is a form of local sensitivity analysis, where the model output is affected by change in one variable at a time, rather global sensitivity analysis in which the contribution to variance is developed when all variables are adjusted simultaneously across their range [10].
Results are summarised below in six figures, one for each of the four sets of policies, with each figure having a curve for policies applied to the developed nations alone, and a curve for policies applied to the developing nations alone. The exceptions are for population growth and land use, where global policies are applied to all nations simultaneously in 2020. In all figures, the x-axis is the fraction change in the controlled variable (e.g. the rate of growth of per capita energy demand) and the y-axis is the number of years by which the point of exceeding 1160 BMT of atmospheric carbon has been extended, or pushed back in time.
For Figures 4-8, there are two curves displayed. The solid line is as described above, imposing one policy at a time. The dashed line displays the Years Extended when a policy of population control is applied prior to each of the policies, stabilising the global population by approximately 2040. Note the increase in Years Extended. There is only one curve for Figure 3 since that figure focuses on the control of population.
In Figures 3-8, the highest simulated fractional change per year is 0.1, which requires that a policy change the associated variable by 10% per year. Values above 0.1 are judged infeasible here as the rate of change would be too high and too economically disruptive for nations to implement.
These results are combined in Figure 9, which shows the cumulative impact of the different policies introduced into the model in sequence. The figure is therefore similar in nature to Figure 3, with the exception that here each policy has been introduced at its maximum simulated fractional change per year of 0.1. In Figure 9, Curve A is the Baseline, with no policies introduced; Curve B is with only population control introduced globally; Curve C is with policies reducing growth in per capita energy demand in the developed nations also introduced (on top of the population control of Curve B); Curve D is with policies reducing the carbon intensity of energy provision in the developed nations also introduced; Curve E is with policies reducing growth in per capita energy demand in the developing nations also introduced; Curve F is with policies reducing the carbon intensity of energy provision in the developing nations also introduced; and Curve G is with policies affecting land use introduced globally. As in Figure 2, the dashed red line is the global policy ceiling. Note that Curves C and D approximately overlap, as do Curves E and F. This is due to both acting on the same model component of per capita carbon emissions.
Figure 9 applies each policy at its maximum simulated value. At best, this might be feasible in the developed nations, but is highly unlikely in the developing nations as they continue movement forward on economic development. Hence, Figure 10 introduces a modification to Figure 9. First, land use is not shown separately due to its small impact relative to the other policy approaches out past 2050 (it is, however, introduced into the analysis immediately prior to introduction of policies in the developing nations). Next, both the fractional rates of reduction in per capita energy demand and in carbon intensity of energy provision in the developing nations are relaxed significantly. The aim was to locate a set of these two values (in the developing nations) that would just prevent reaching the policy ceiling or target at any time in the future. Hence, the time over which the simulation was performed was increased to 500 years. This aim was achieved with the fractional rate of reduction in per capita energy demand of 0.01, and a fractional rate of reduction in carbon intensity of energy production of 0.03.
The sensitivity of meeting the Target to changes in the year of introduction of policies is shown in Figure 11. In generating that figure, Curve E/F of Figure 10 was used as the baseline (shown as Curve A in Figure 11). Curve B is with the policies delayed until 2040 and Curve C is with policies delayed until 2040 or beyond (curves converge after a 2040 delayed date of introduction.
4. Conclusions and Discussion
The analyses performed here indicate that attainment of the international policy target or ceiling of a doubling of the pre-industrial revolution level of atmospheric carbon is significantly more sensitive to the magnitude of policies introduced in developing nations than in developed nations. This is due in large part to the significant growth in population and per capita energy demand in the developing nations as they continue down their paths of economic development. If one takes as the measure of sensitivity the extension in years required for atmospheric carbon to reach the policy ceiling of 1160 BMT, achieved at a policy that introduces a rate of change in the affected model variable of 0.05 per year (a 5% change per year, which is the midpoint of the range of values in Curves 3 - 8), then the policies in decreasing order of sensitivity are (the first number is with population stabilised, the second is without): Developing nations per capita growth (26, 17 years), Developing nations carbon intensity (26, 17 years), Population control (11 years—only this one value applies), Developed nations carbon intensity (7.8, 2.9 years), Developed nations per capita growth (7.5, 2.8 years) and Land use (2.3, 1.3 years). Note that these values are not additive. One can’t introduce two of the policies and have the Years Extended value equal to the sum of the two respective values for these policies. On the one hand, a set of policies (e.g. per capita energy demand reduction and carbon intensity) can act on the same term in the model, with the Years Extended value for the composite policies being essentially the same as for any one policy alone. On the other hand, as shown in Figures 9 and 10, a combination of policies can essentially extend the years-to-doubling out to infinity, preventing the policy ceiling from ever being exceeded.

Figure 3. The sensitivity of atmospheric carbon to the fractional rate of decrease in population growth, applied to all nations simultaneously.
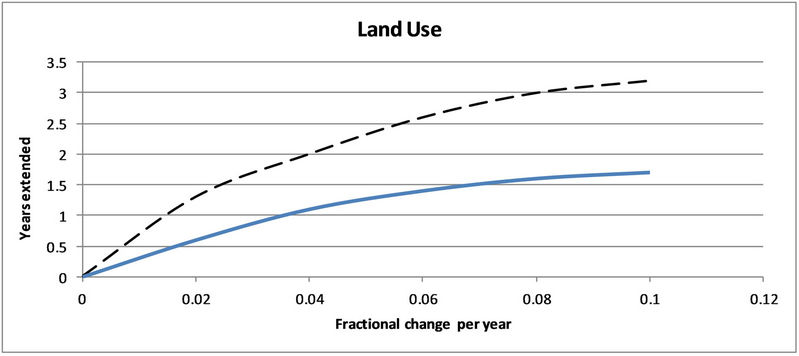
Figure 4. The sensitivity of atmospheric carbon to the fractional rate of decrease in deforestation and conversion of forest to cropland, applied to all land areas simultaneously. Dashed line is with population stabilised; solid line is without population stabilised.

Figure 5. The sensitivity of atmospheric carbon to the fractional rate of decrease in the rate of growth of per capita energy demand, applied to developed nations only. Dashed line is with population stabilised; solid line is without population stabilised.
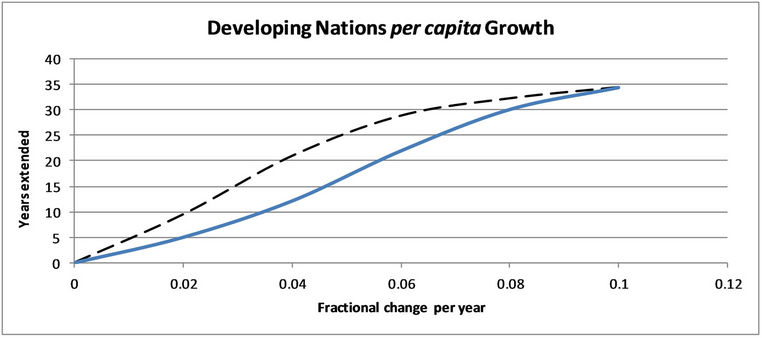
Figure 6. The sensitivity of atmospheric carbon to the fractional rate of decrease in the rate of growth of per capita energy demand, applied to developing nations only. Dashed line is with population stabilised; solid line is without population stabilised.
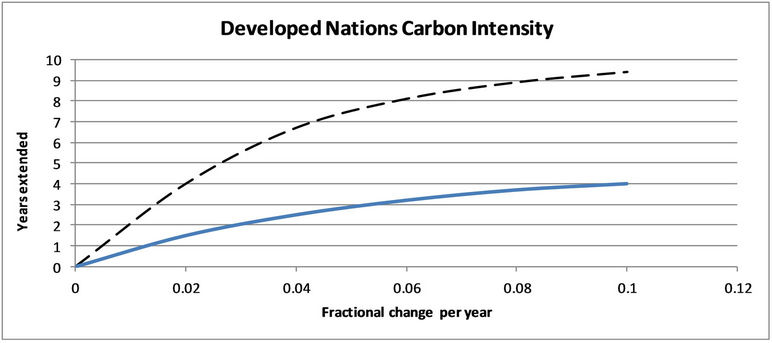
Figure 7. The sensitivity of atmospheric carbon to the fractional rate of decrease in the carbon intensity (tCO2/GWh) of energy provision, applied to developed nations only. Dashed line is with population stabilised; solid line is without population stabilised.
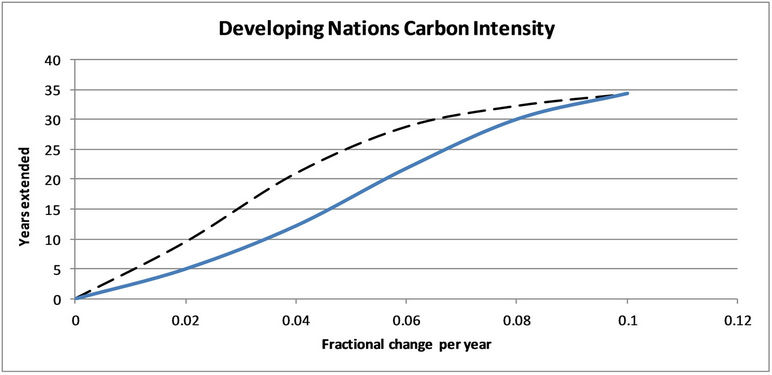
Figure 8. The sensitivity of atmospheric carbon to the fractional rate of decrease in the carbon intensity (tCO2/GWh) of energy provision, applied to developing nations only. Dashed line is with population stabilised; solid line is without population stabilised.
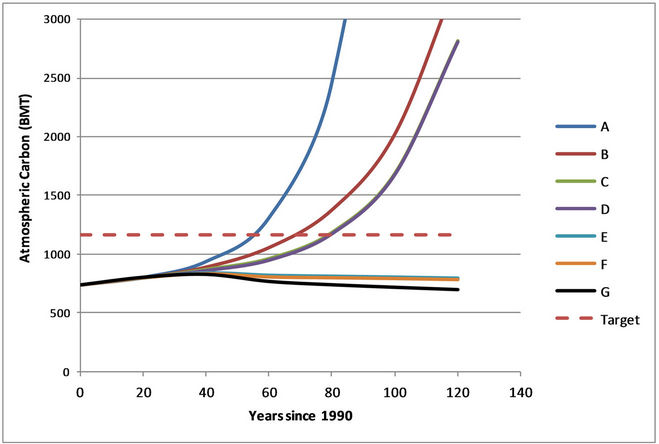
Figure 9. The response of atmospheric carbon to the cumulative introduction of policies, applied in the sequence described in the text.
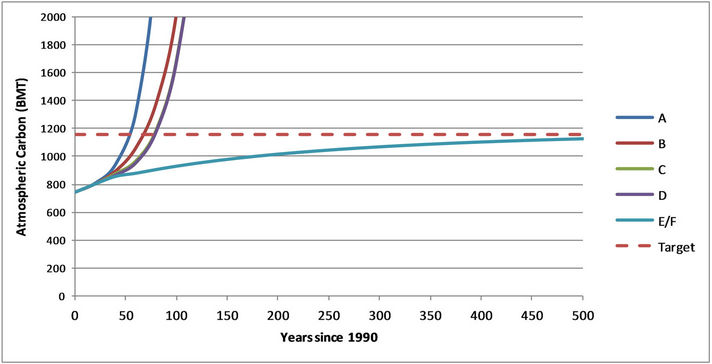
Figure 10. The response of atmospheric carbon to the cumulative introduction of policies, applied in the sequence described in the text. The figure is similar to Figure 9, with the exception that land use is not shown separately (although it is included in Curve E/F), and policies controlling per capita energy demand and carbon intensity of energy production in the developing nations have been set at significantly less restrictive values than in Figure 9. These less restrictive values still reach the policy aim, keeping atmospheric carbon below the ceiling or Target, peaking at approximately 500 years and then declining further below the policy ceiling after that year.
The most significant reductions in atmospheric carbon as the policy ceiling is approached are from policies that influence population growth globally, and the per capita energy demand and carbon intensity of energy production in the developing nations. The only sets of policy approaches that can achieve the international policy target are those significantly focused by 2020 on these three variables or policy approaches. This is not, however, to say that policies in the developed nations are irrelevant. Instead, one must ask how the per capita energy demand (largely through improved industrial and built environment efficiency) and carbon intensity of energy production reductions (through low carbon energy technologies) are to take place in the developing nations. Neither the technological innovations nor the finance required are likely to be produced internally by these nations, the possible exception being China, where advances are pronounced. This suggests that the role of the developed nations, after having decarbonised their own economies as a stimulus for global decarbonisation and to allow as much time as possible for the developing nations to experience economic growth, will
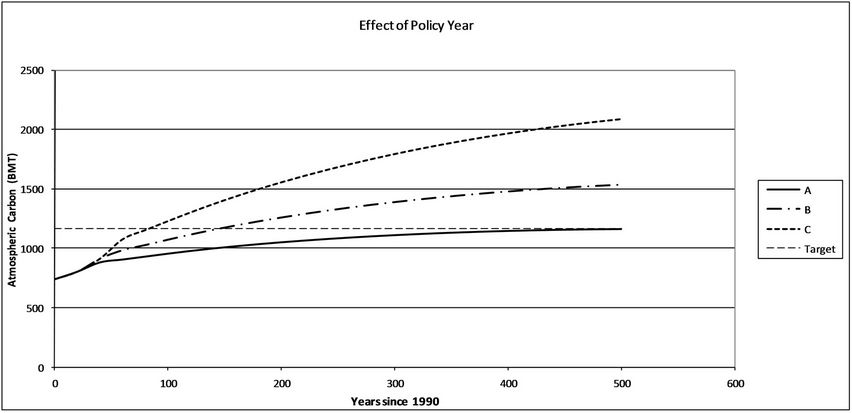
Figure 11. The response of atmospheric carbon to the date of introduction of policies, from 2020 (Curve A) to 2030 (Curve B) to 2040 and beyond (Curve C).
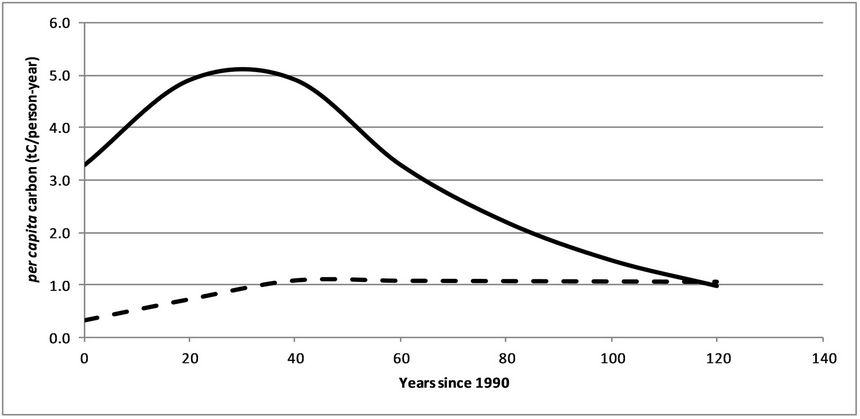
Figure 12. The per capita carbon emissions (tC/person-year) as a function of time since 1990 for the developed nations (solid line) and developing nations (dashed line). The two values converge to approximately 1 tC/person-year in 2100, with a slight decline after that.
be to transfer technology and knowledge to developing nations, and provide the financial capital to bring about low carbon practices in those nations. Absent this crucial role of the developed nations, implemented through enhancement of programmes such as the Clean Development Mechanism and its successors [11,12], it is unlikely the policies required in the developing nations will be implemented in the face of demand for economic development.
Land use changes, especially the conversion of forests to cropland with the subsequent reduction in carbon sequestration, play a relatively minor role in preventing the ceiling of atmospheric carbon being reached (the smallest sensitivity of the six policy approaches by at least a factor of 2). Policies focused on land use change such as REDD+ (Reducing Emissions from Deforestation and Forest Degradation) [13], may be relatively ineffective in reducing the risks of climate change, but they carry the added benefit of providing livelihoods for communities whose historical reliance on forest resources is under threat from economic development. There are significant challenges to be met in better defining the legal framework of land, forest and carbon rights in nations where land use change is most dramatic [14], but if these can be overcome there is significant global potential for REDD+ and related measures as a strategy to link climate change and economic development policies.
Lastly, we consider the issue of equity of emissions between nations, or the principle of “converge and contract” (in which per capita emissions become distributed uniformly around the world over time as an issue of individual rights). The question raised is whether any portfolio of policies can place the world onto the trajectory of Curve E/F of Figure 10, while simultaneously causing the per capita carbon emissions in the developed and developing nations to converge for equity of emissions by the end of this century. Figure 12 shows the results of a portfolio of policies in which the control on population is at 0.03 per year; control on developing nations per capita growth is 0.02 per year; control on developing nations carbon intensity is 0.021 per year (funded primarily through international finance); control on developed nations carbon intensity is 0.02 per year; control on developed nations per capita growth is 0.02 per year; and control on land use is 0.1 per year. The figure shows the projected per capita carbon emissions in the developed and developing nations out to 2100 (110 years after 1990).
5. Acknowledgements
The author acknowledges the Three Guineas Trust for providing significant support for the work reported here.
REFERENCES
- M. Meinshausen, N. Meinshausen, W. Hare, S. Raper, K. Frieler, R. Knutti, J. Frame and M. Allen, “GreenhouseGas Emission Targets for Limiting Global Warming to 2˚C,” Nature, Vol. 458, No. 7242, 2009, pp. 1158-1162. doi:10.1038/nature08017
- D. Crawford-Brown, “Scientific Models of Human Health Risk Analysis in Legal and Policy Decisions,” Law and Contemporary Problems, Vol. 64, No. 4, 2001, pp. 63-81. doi:10.2307/1192291
- A. Stanton, F. Ackerman and R. Bueno, “Reason, Empathy, and Fair Play: The Climate Policy Gap,” Department of Economic and Social Affairs Working Paper No. 113, 2012.
- United Nations Development Programme, “One Planet to Share: Sustaining Human Progress in a Changing Climate,” United Nations Development Programme AsiaPacific Human Development Report, Routledge, 2012.
- S. Sorrell and S. Dimitropoulos, “The rebound Effect: Microeconomic Definitions, Limitations and Extensions,” Ecological Economics, Vol. 65, No. 3, 2008, pp. 636-649. doi:10.1016/j.ecolecon.2007.08.013
- D. Crawford-Brown and S. LaRocca, “Teaching Systems Principles and Policy Applications Using a ReducedScale Global Warming Model,” Journal of Geoscience Education, Vol. 54, No. 3, 2006, pp. 101-120.
- Intergovernmental Panel on Climate Change, “IPCC Fourth Assessment Report: Climate Change,” 2007.
- J. Hansen, M. Sato, P. Kharecha, D. Beerling, R. Berner, V. Masson-Delmotte, M. Pagani, M. Raymo, D. Royer and J. Zachos, “Target Atmospheric CO2: Where Should Humanity Aim?” The Open Atmospheric Science Journal, Vol. 2, 2008, pp. 217-231. doi:10.2174/1874282300802010217
- W. Press, B. Flannery, S. Teukolsky and W. Vetterling, “Runge-Kutta Method, Numerical Recipes: The Art of Scientific Computing,” 3rd Edition, Cambridge University Press, Cambridge, 2007.
- A. Saltelli, M. Ratto, T. Andres, F. Campolongo, J, Cariboni, D. Gatelli, M. Saisana and S. Tarantola, “Global Sensitivity Analysis: The Primer,” John Wiley and Sons, Hoboken, 2008.
- “United Nations Framework Convention on Climate Change, The Kyoto Protocol Mechanisms: International Emissions Trading, Clean Development Mechanism, Joint Implementation,” UNFCCC Publications, 2007.
- M. Grubb, “The Economics of the Kyoto Protocol,” World Economics, Vol. 4, No. 3, 2003, pp. 143-189.
- C. Streck, “Rights and REDD+: Legal and regulatory considerations,” In: A. Angelsen, Ed., Realising REDD+: National Strategy and Policy Options, 2009. pp. 151-162.
- L. Cotula and J. Mayers, “Tenure in REDD: Start-Point or Afterthought?” International Institute for Environment and Development Natural Resource Issues, No. 15, 2009.