Journal of Environmental Protection
Vol.3 No.7(2012), Article ID:21109,6 pages DOI:10.4236/jep.2012.37067
A Situational Assessment of Socioeconomic Factors Affecting Solid Waste Generation and Composition in Freetown, Sierra Leone
![]()
1School of Management, Harbin Institute of Technology, Harbin, China; 2Port Loko Teachers College, Port Loko, Sierra Leone.
Email: fodaypinka2011@yahoo.com
Received April 6th, 2012; revised May 2nd, 2012; accepted May 31st, 2012
Keywords: Socioeconomic factors; Solid waste generation; Freetown; Family size
ABSTRACT
The generation of solid waste has become an increasing environmental and public health problem, especially in developing countries. These problems associated with the generation of solid waste are part of social changes where households play an important role. Invariably, these social changes influence the size, structure and characteristics of given households. This paper presents the findings of a study carried out in Freetown municipal area in Sierra Leone to assess socioeconomic factors affecting household solid waste generation and composition in Freetown, Sierra Leone. Structured questionnaires were administered with respect to these socioeconomic factors in four (4) selected constituencies of the city. These are the most populated constituencies that generated 70% of the total quantity of solid waste in the city. Therefore, they are suitable samples of the study area. The rate of waste generation was determined by using doorto-door approach in five (5) selected households from each constituency through sorting and weighing of solid wastes respectively. The dependent variables were solid waste generation and composition, and the independent variables were family size, education, income levels among others. The data obtained were subjected to statistical analysis to determine relationships between independent variables and dependent variables through correlation. The results showed that the solid waste generation and composition in Freetown was significantly affected by average family size, employment status, monthly income, and number of room(s) occupied by households. In general, the paper adequately suggests new insights concerning the role of socioeconomic factors in affecting the generation and composition of household solid waste.
1. Introduction
Freetown the study area was founded on the 11th March, 1792 and it is the capital city of Sierra Leone, a small country in West Africa. It is a major port city on the Atlantic Ocean located on 8.48˚ N and 13.23˚ W with a total area of 137.8 square miles (357 square kilometers) in the western area of the country. It has a population of 7,728,739 [1]. The city is the economic, financial and cultural center of Sierra Leone. The city’s economy revolves largely around its harbor-occupying a part of the estuary of the Sierra Leone River in one of the world’s largest natural harbor, Queen Elizabeth 11 Quay [2]. Queen Elizabeth II Quay is capable of receiving ocean going vessels and handles Sierra Leone’s main port. The city is politically divided into 8 constituencies: the East end of Freetown has east 1, east 2, and east 3; the Central Freetown has central 1 and central 2 while the West end of Freetown has west 1, west 2 and west 3 (Figure 1). Industries, commercial activities, health and educational institutions have duly increased the population of Freetown. The problem of increased population was further compounded in the mid 1990s when Freetown served as a safe haven for thousands of people from the provinces of Sierra Leone and neighboring Liberia when rebel wars broke out in these two countries. The city suffered a corresponding increase in the quantity of solid waste generation and composition which are heterogeneous. They vary according to socioeconomic status of Freetown inhabitants and change in the seasons of the year. Many previous studies have examined household solid waste generation and composition. [3-14] observed that in every human settlement, the microscopic unit of waste generation is the household. Due to societal changes, the household plays an important role in environmental problems associated with the generation of solid waste. These societal changes influence the charac-
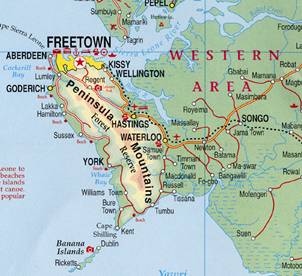
Figure 1. Map of freetown.
teristics of given households, including family size, societal status and wealth, residential location and community status. Various authors have described the correlation between household solid waste generation and composition and relevant socioeconomic factors [3,9,10, 15-20]. In addition, some studies were conducted using regression analysis to establish the relationship between waste generation and socioeconomic factors [21]. From an economic perspective, [22] analyzed the household behavior on waste in terms of changes in income, price of refuse service, site of refuse collection and packing. Household size, cultural patterns and personal attitudes [23,24] are said to influence solid waste generation as well. Economists also compared the composition and quantity of waste in terms of income level, household size and age structure of the household as these affect the quantity and composition of solid waste. [25] study shows that grass, yard wastes and newspaper are positively correlated with the level of income. [22,24,26] have also shown that the quantity of waste generated by a country is proportional to its population and the mean living standards of the people is related to the income levels of people hence individual household’s waste generation is correlated. But in a study conducted by [27] to analyze the factors that influence waste handling and generation using the variables income and population density, it was found out that income did not influence the total solid waste generated in a municipality.
However, [28] showed that there is a positive correlation between income and waste generation. [29] statistically analyzed the relationship between socioeconomic factors and waste generation and composition: that a clear waste difference existed between the more prosperous section in relation to the total and the individual components of the waste stream. Therefore, the objectives of the paper are to collect data on household waste generation and composition, correlate waste quantity and composition with relevant socioeconomic factors of households and provide details of data collection, data analysis and interpretation of results. Results from this study will provide inputs to the environmental and waste management planners in their decision making with regards to effective and sustainable solid waste management system in Freetown.
2. Materials and Methods
The study was conducted in four (4) different constituencies of Freetown, namely: East 1, East 2, Central 1, and West 1. The method involved the administration of structured questionnaires to one hundred and thirty (130) respondents in these constituencies. The questionnaire sought to obtain data ranging from the households personal and socioeconomic background to total waste generated. The questionnaire focused on the socioeconomic status of the households such as age, gender, marital status, family size, educational background, occupation, and income. Most of the questions were closed-ended. Of the one hundred and thirty (130) questionnaires administered one hundred and ten (110) were received given 85% response. Household door-to-door survey approach according to [30] and [31] in five (5) selected households from each constituency was used in determining the rate of solid wastes generated for two consecutive weeks. The rates were obtained by dividing the waste measured (in kilograms) by the number of people in the household. The average for the town was then obtained by adding individual rates for the different constituencies and dividing by the number of households used. Also, the one hundred and ten respondents were divided into five different socioeconomic groups on the basis of the monthly income of their households as follows:
1) Low socioeconomic income group (LSIG):
monthly income < 200,000.00 Leones;
2) Lower middle socioeconomic income group (LMSIG):
monthly income between 200,000.00 - 500,000.00 Leones;
3) Middle socioeconomic income group (MSIG):
monthly income between 500,000.00 - 700,000.00 Leones;
4) Upper socioeconomic income group (USIG):
monthly income between 700,000.00 - 900,000.00 Leones;
5) High socioeconomic income group (HSIG):
monthly income above 900,000.00 Leones.
Data analysis covered descriptive statistics which described the background information of the sample, and inferential statistics which analyzed the relationship between the household’s behavior and the quantity and composition of solid wastes generated. The [32] was used to run the analysis.
3. Results and Discussion
3.1. Socioeconomic Factors
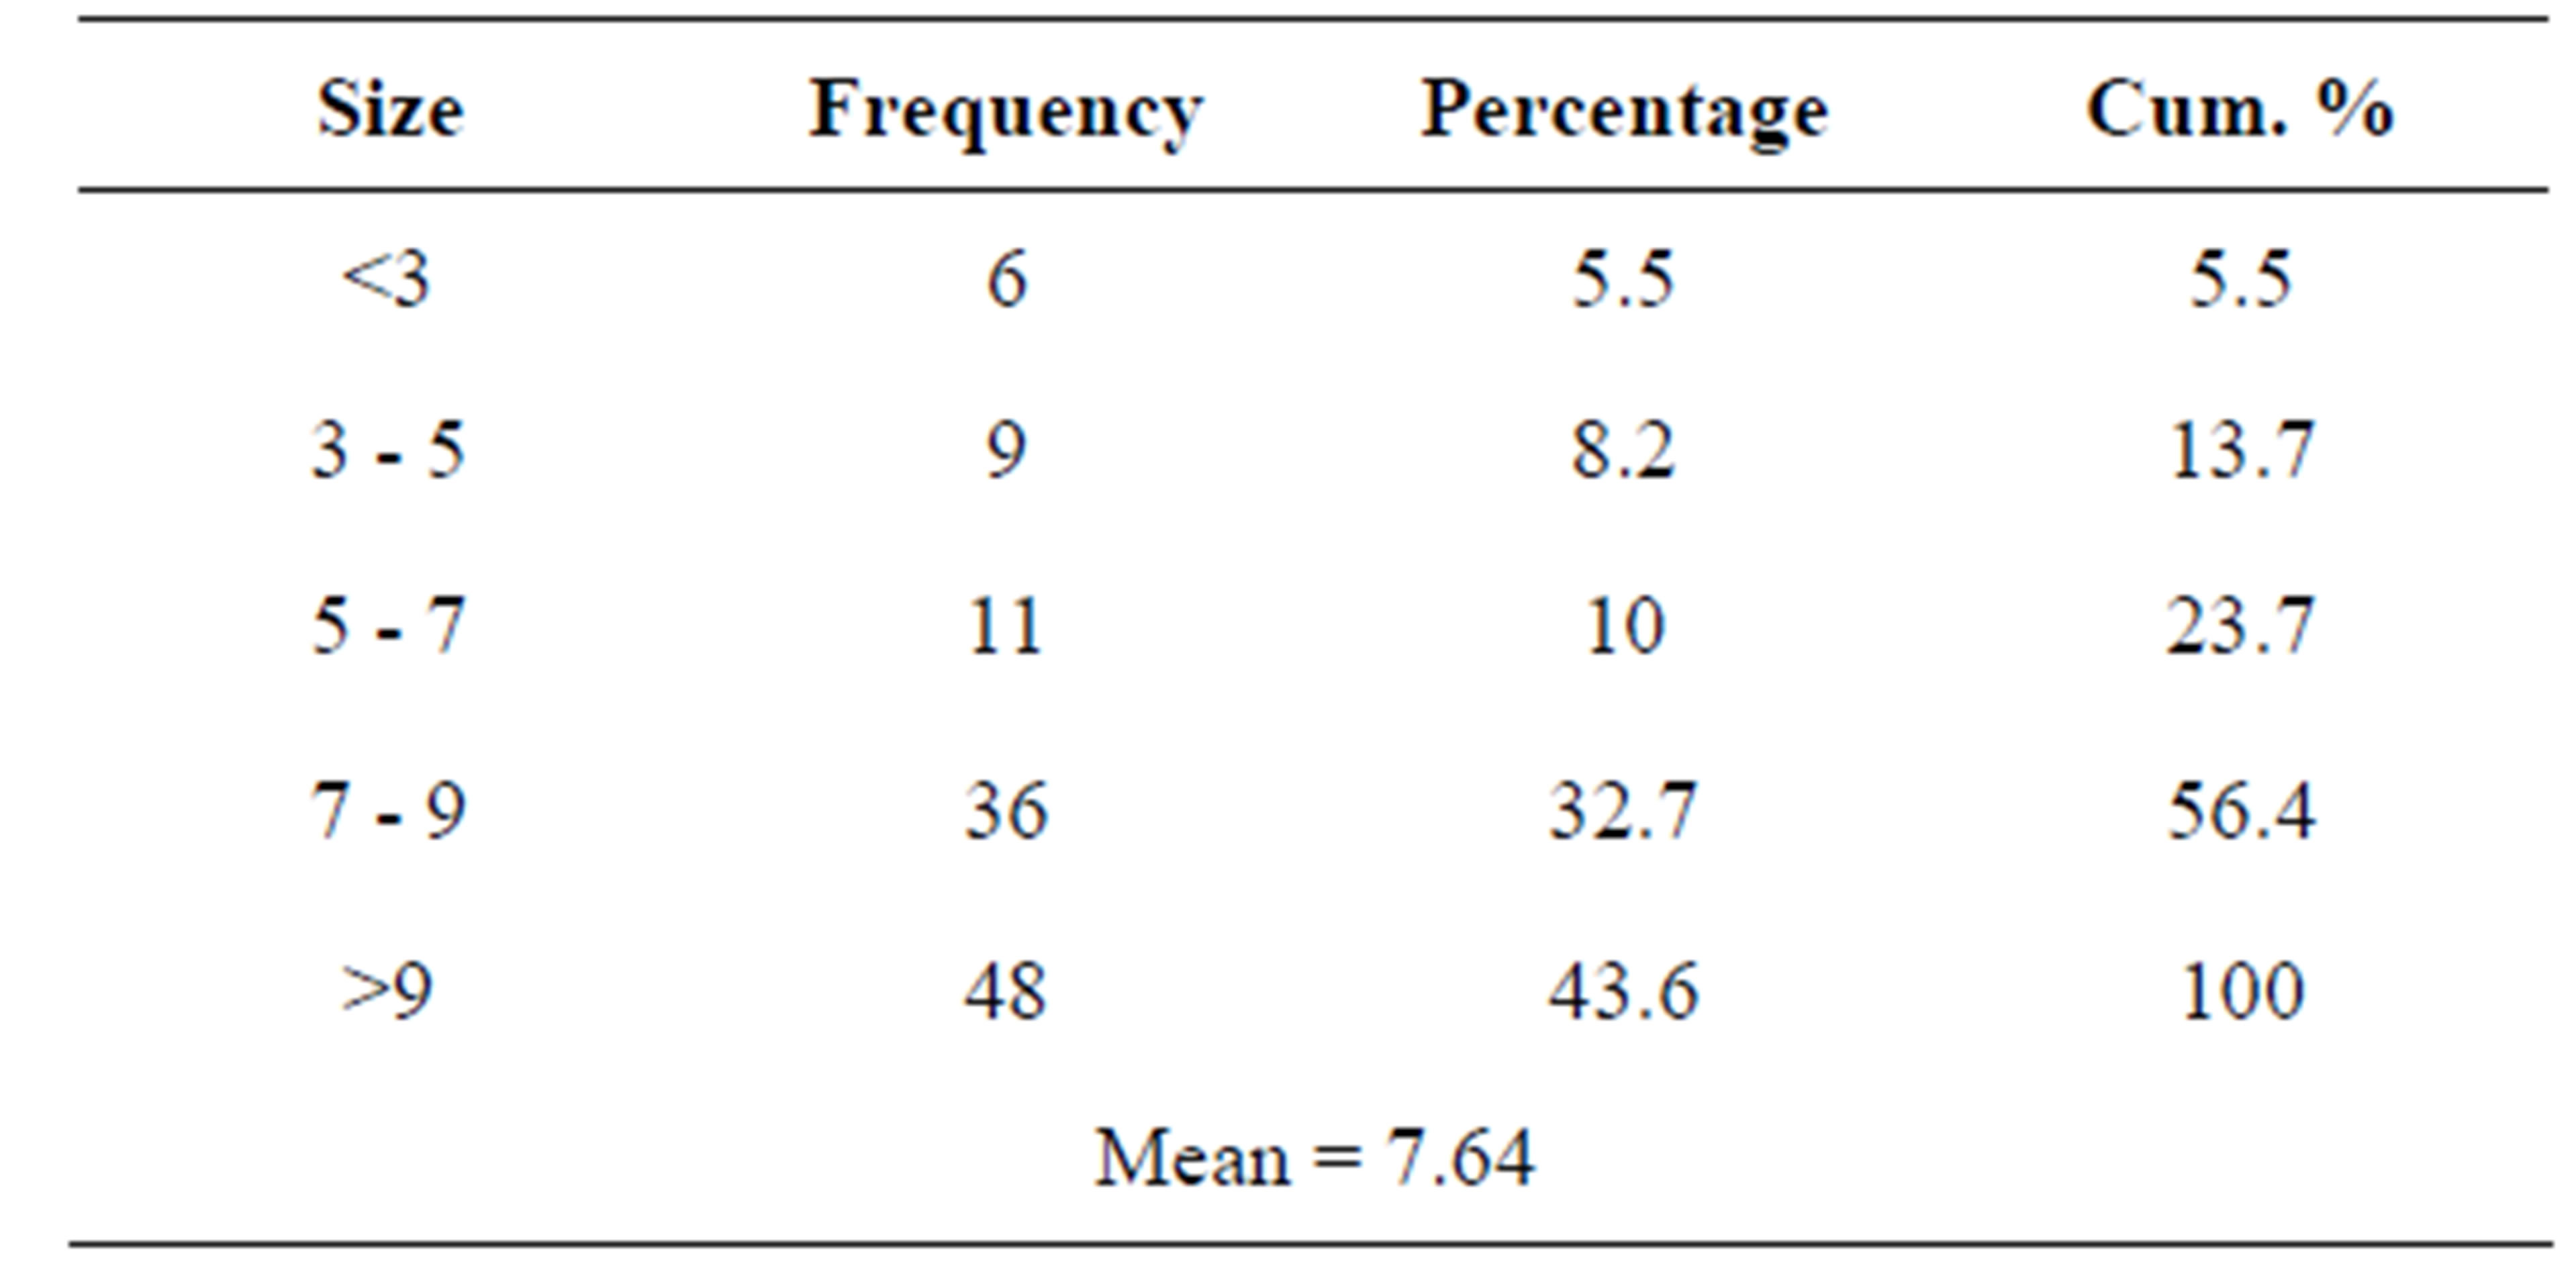
The frequencies, percentages, cumulative percentages and means of sample households’ socioeconomic factors considered in this study are shown in Table 1.
The data in table 1 shows that the average family size was 7.64 persons with 4.18 persons per room, the average age of the family was 36.5 years, employment status was 3.82 persons per household and the average monthly household income was Le 740454.
3.2. Relationship between Household Solid Waste Generation and Socioeconomic Factors
From table 2 the average rate of generation of solid waste was 5.98 kg per household per day and 1.66 kg per person per day.
Table 3 shows results of the statistical analysis conducted to determine the relationships between independent
 (a)
(a)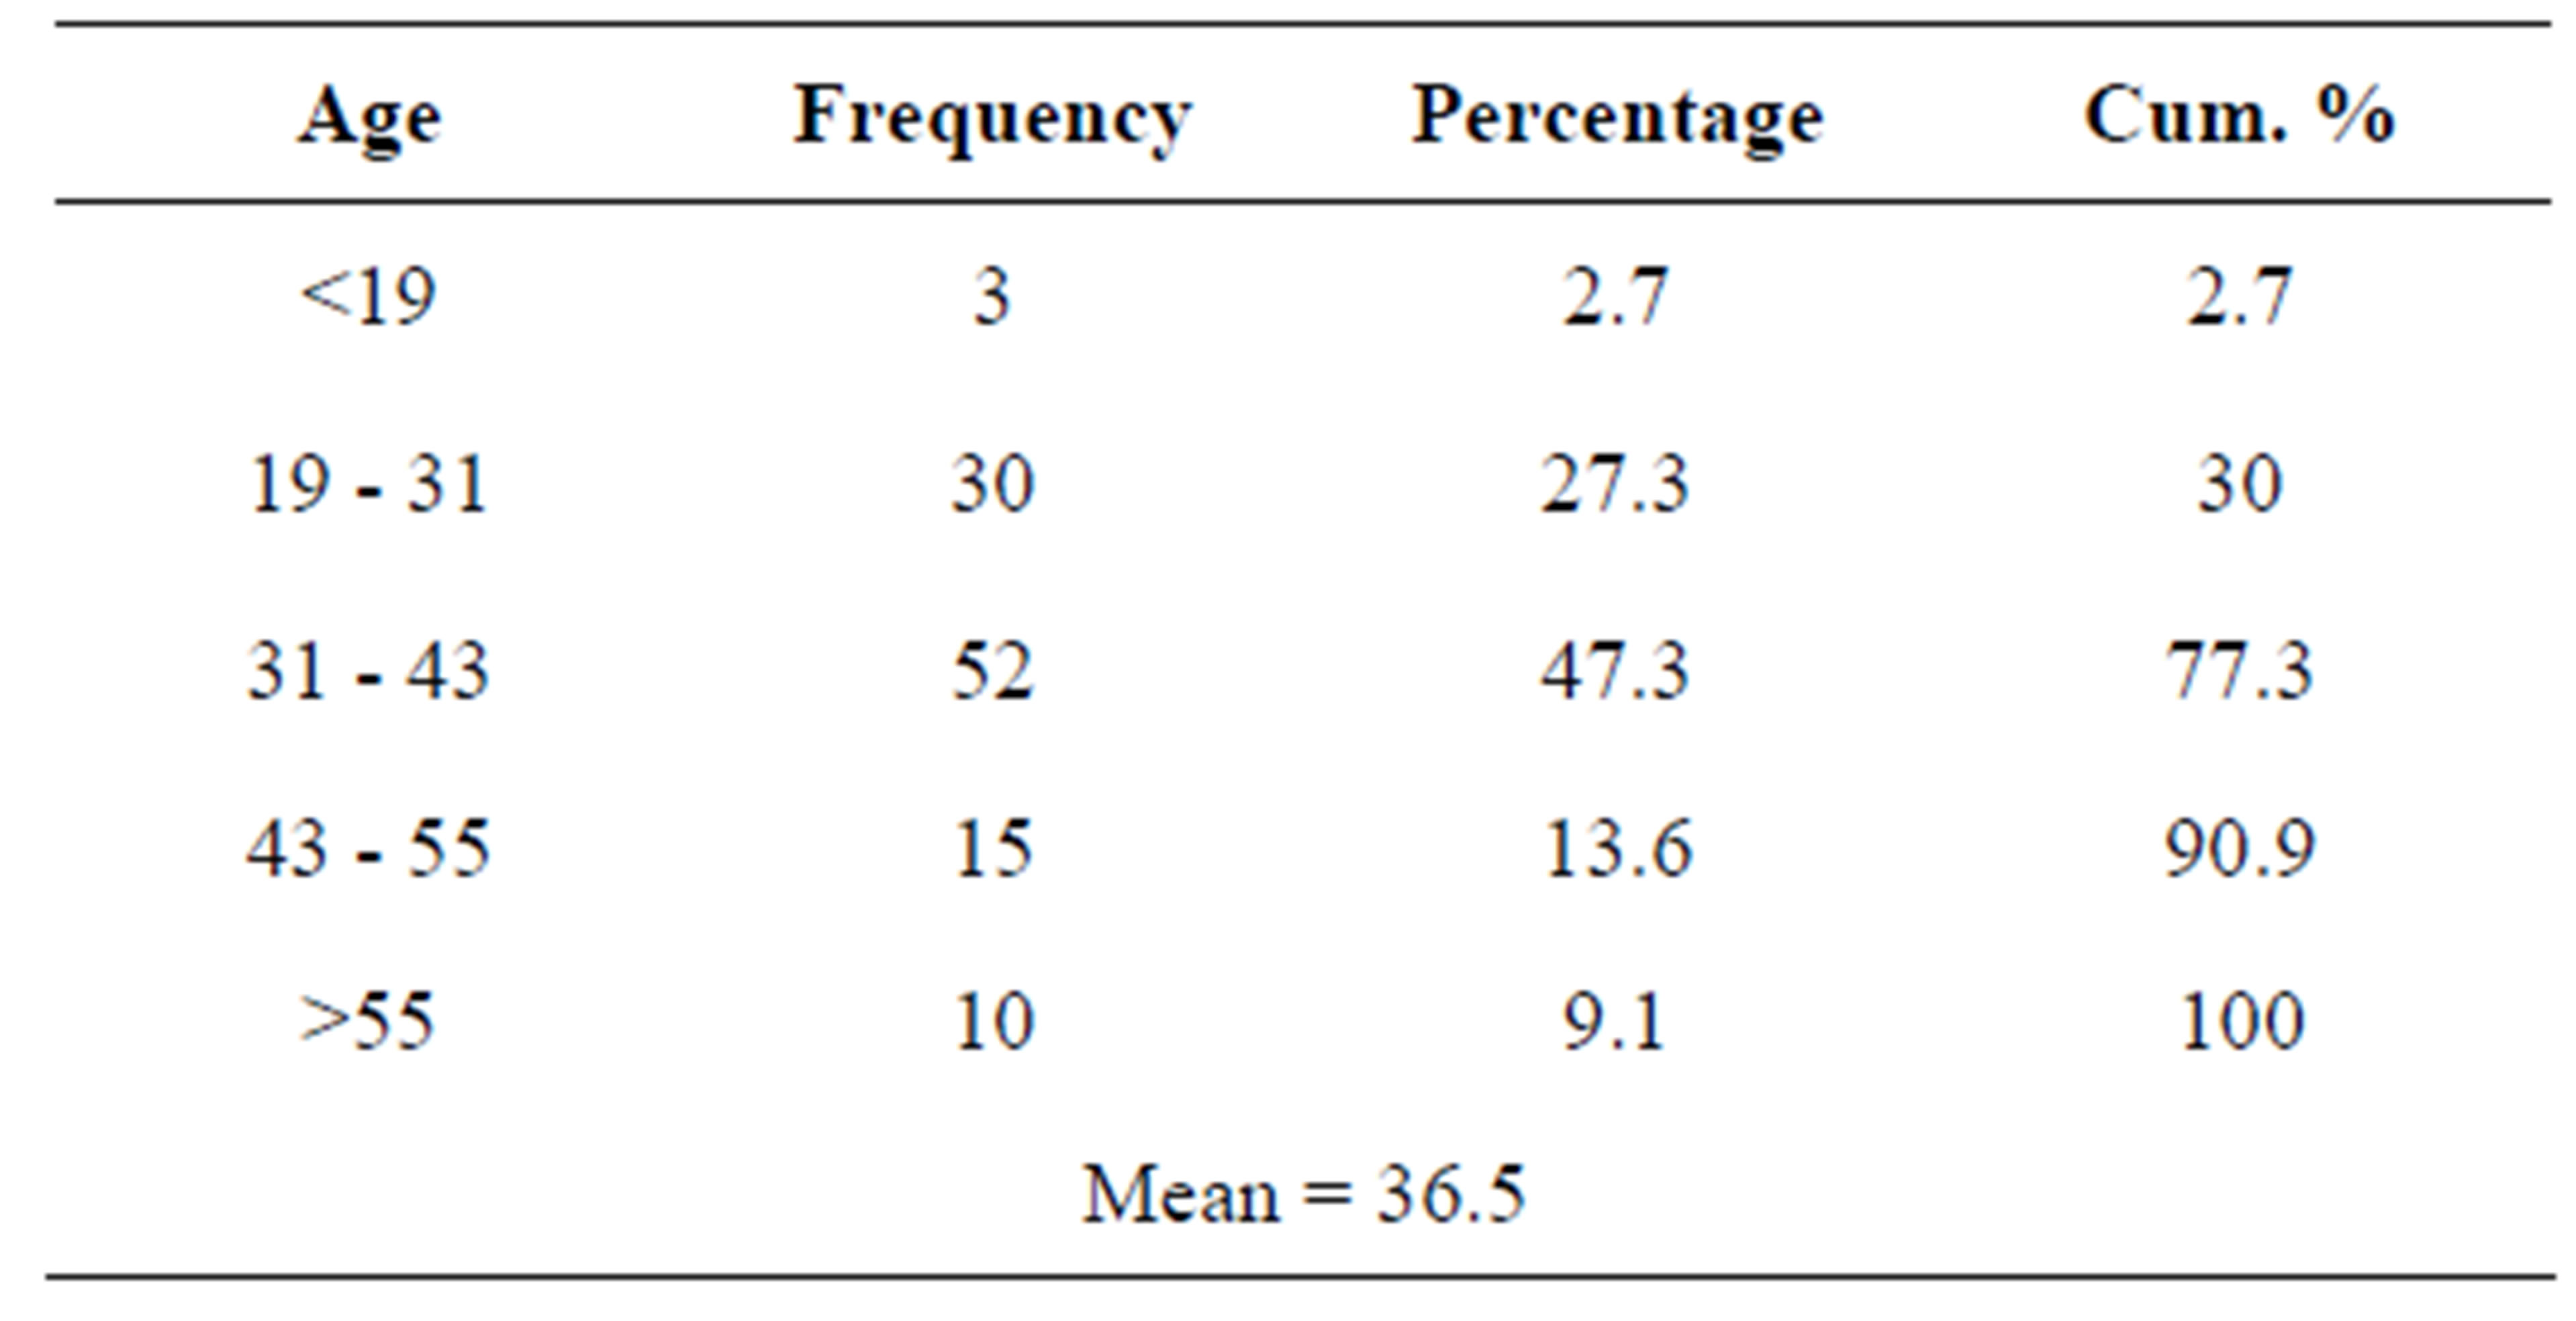 (b)
(b)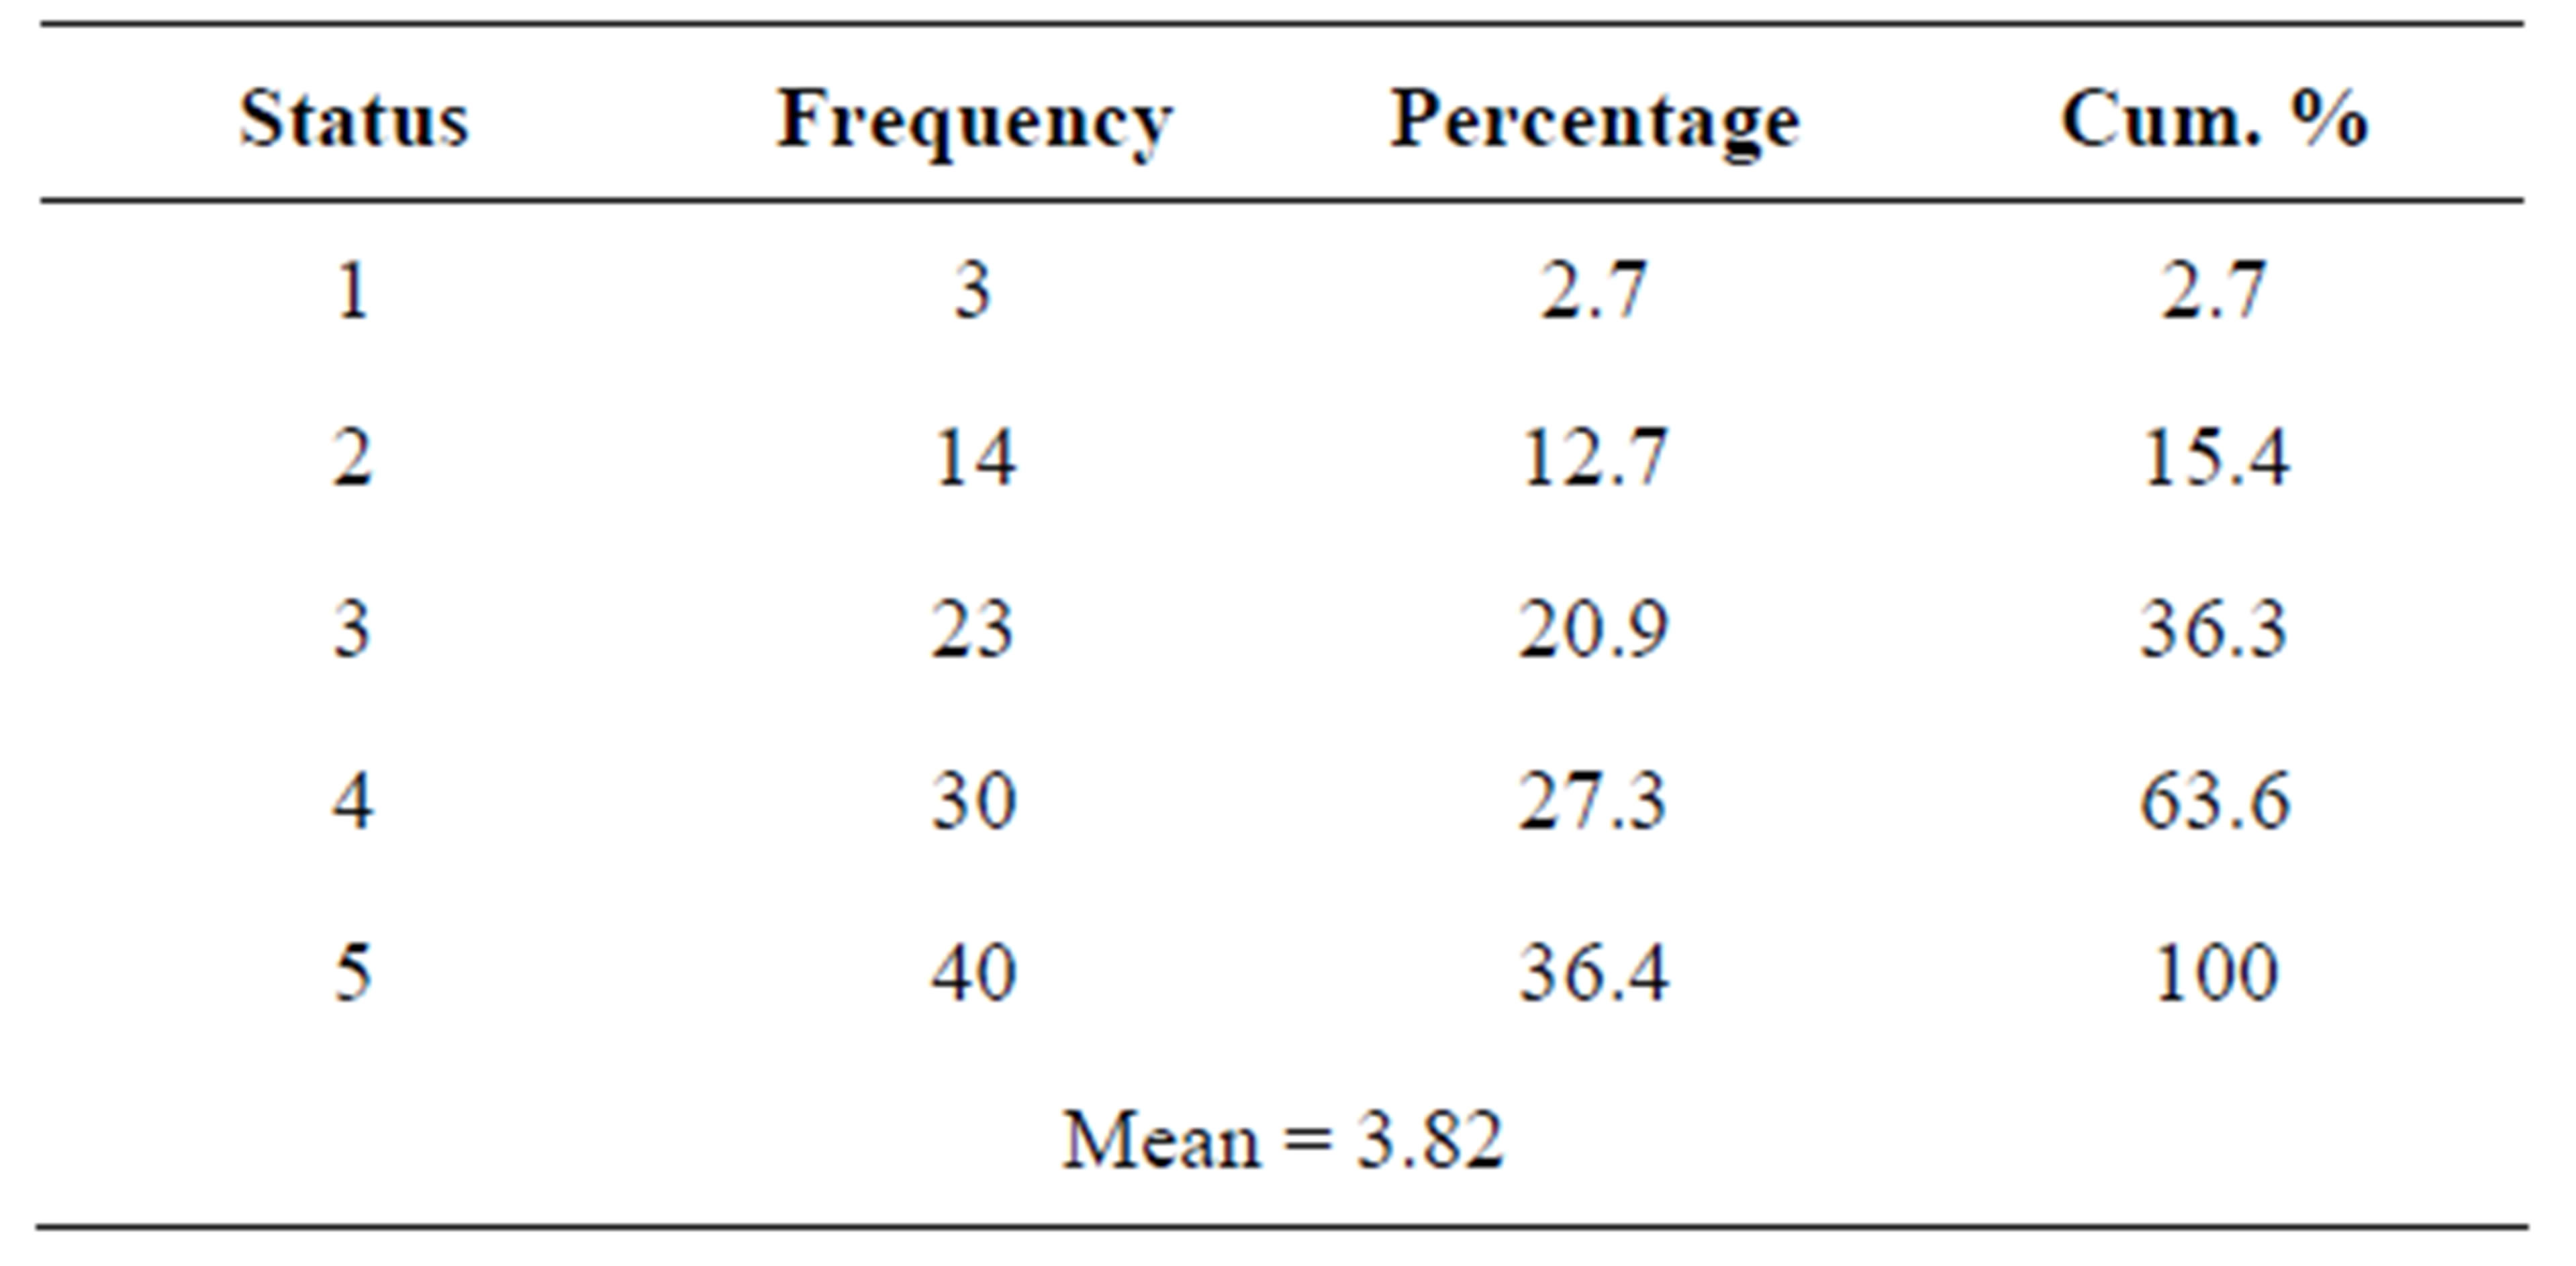 (c)
(c) (d)
(d)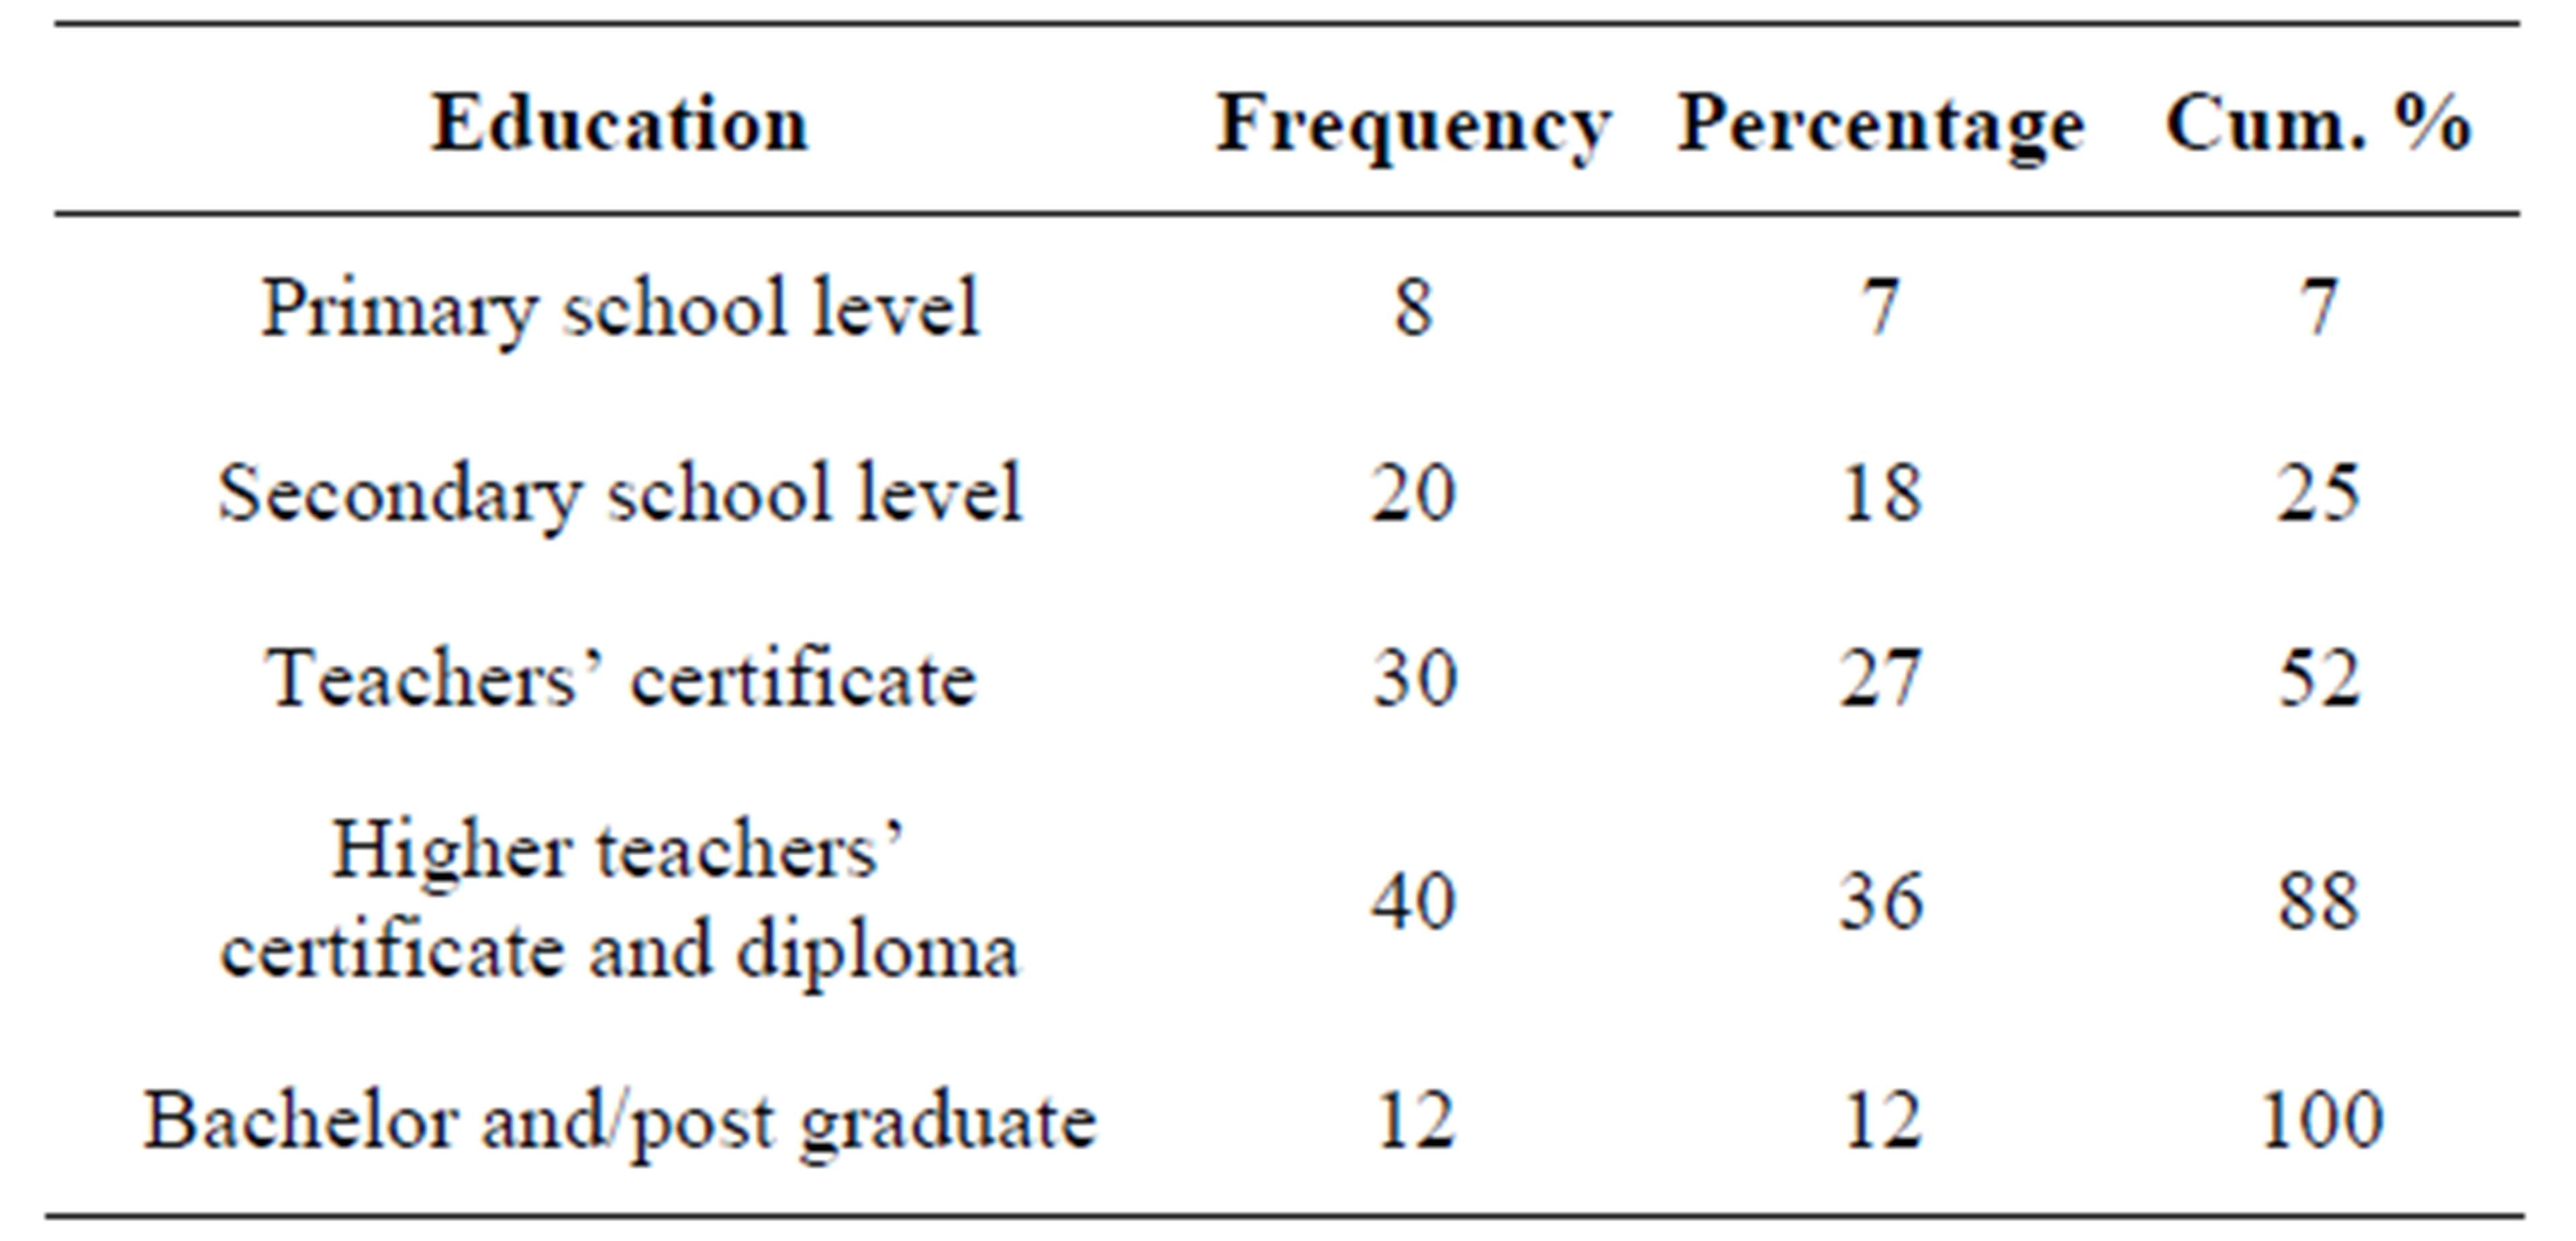 (e)
(e)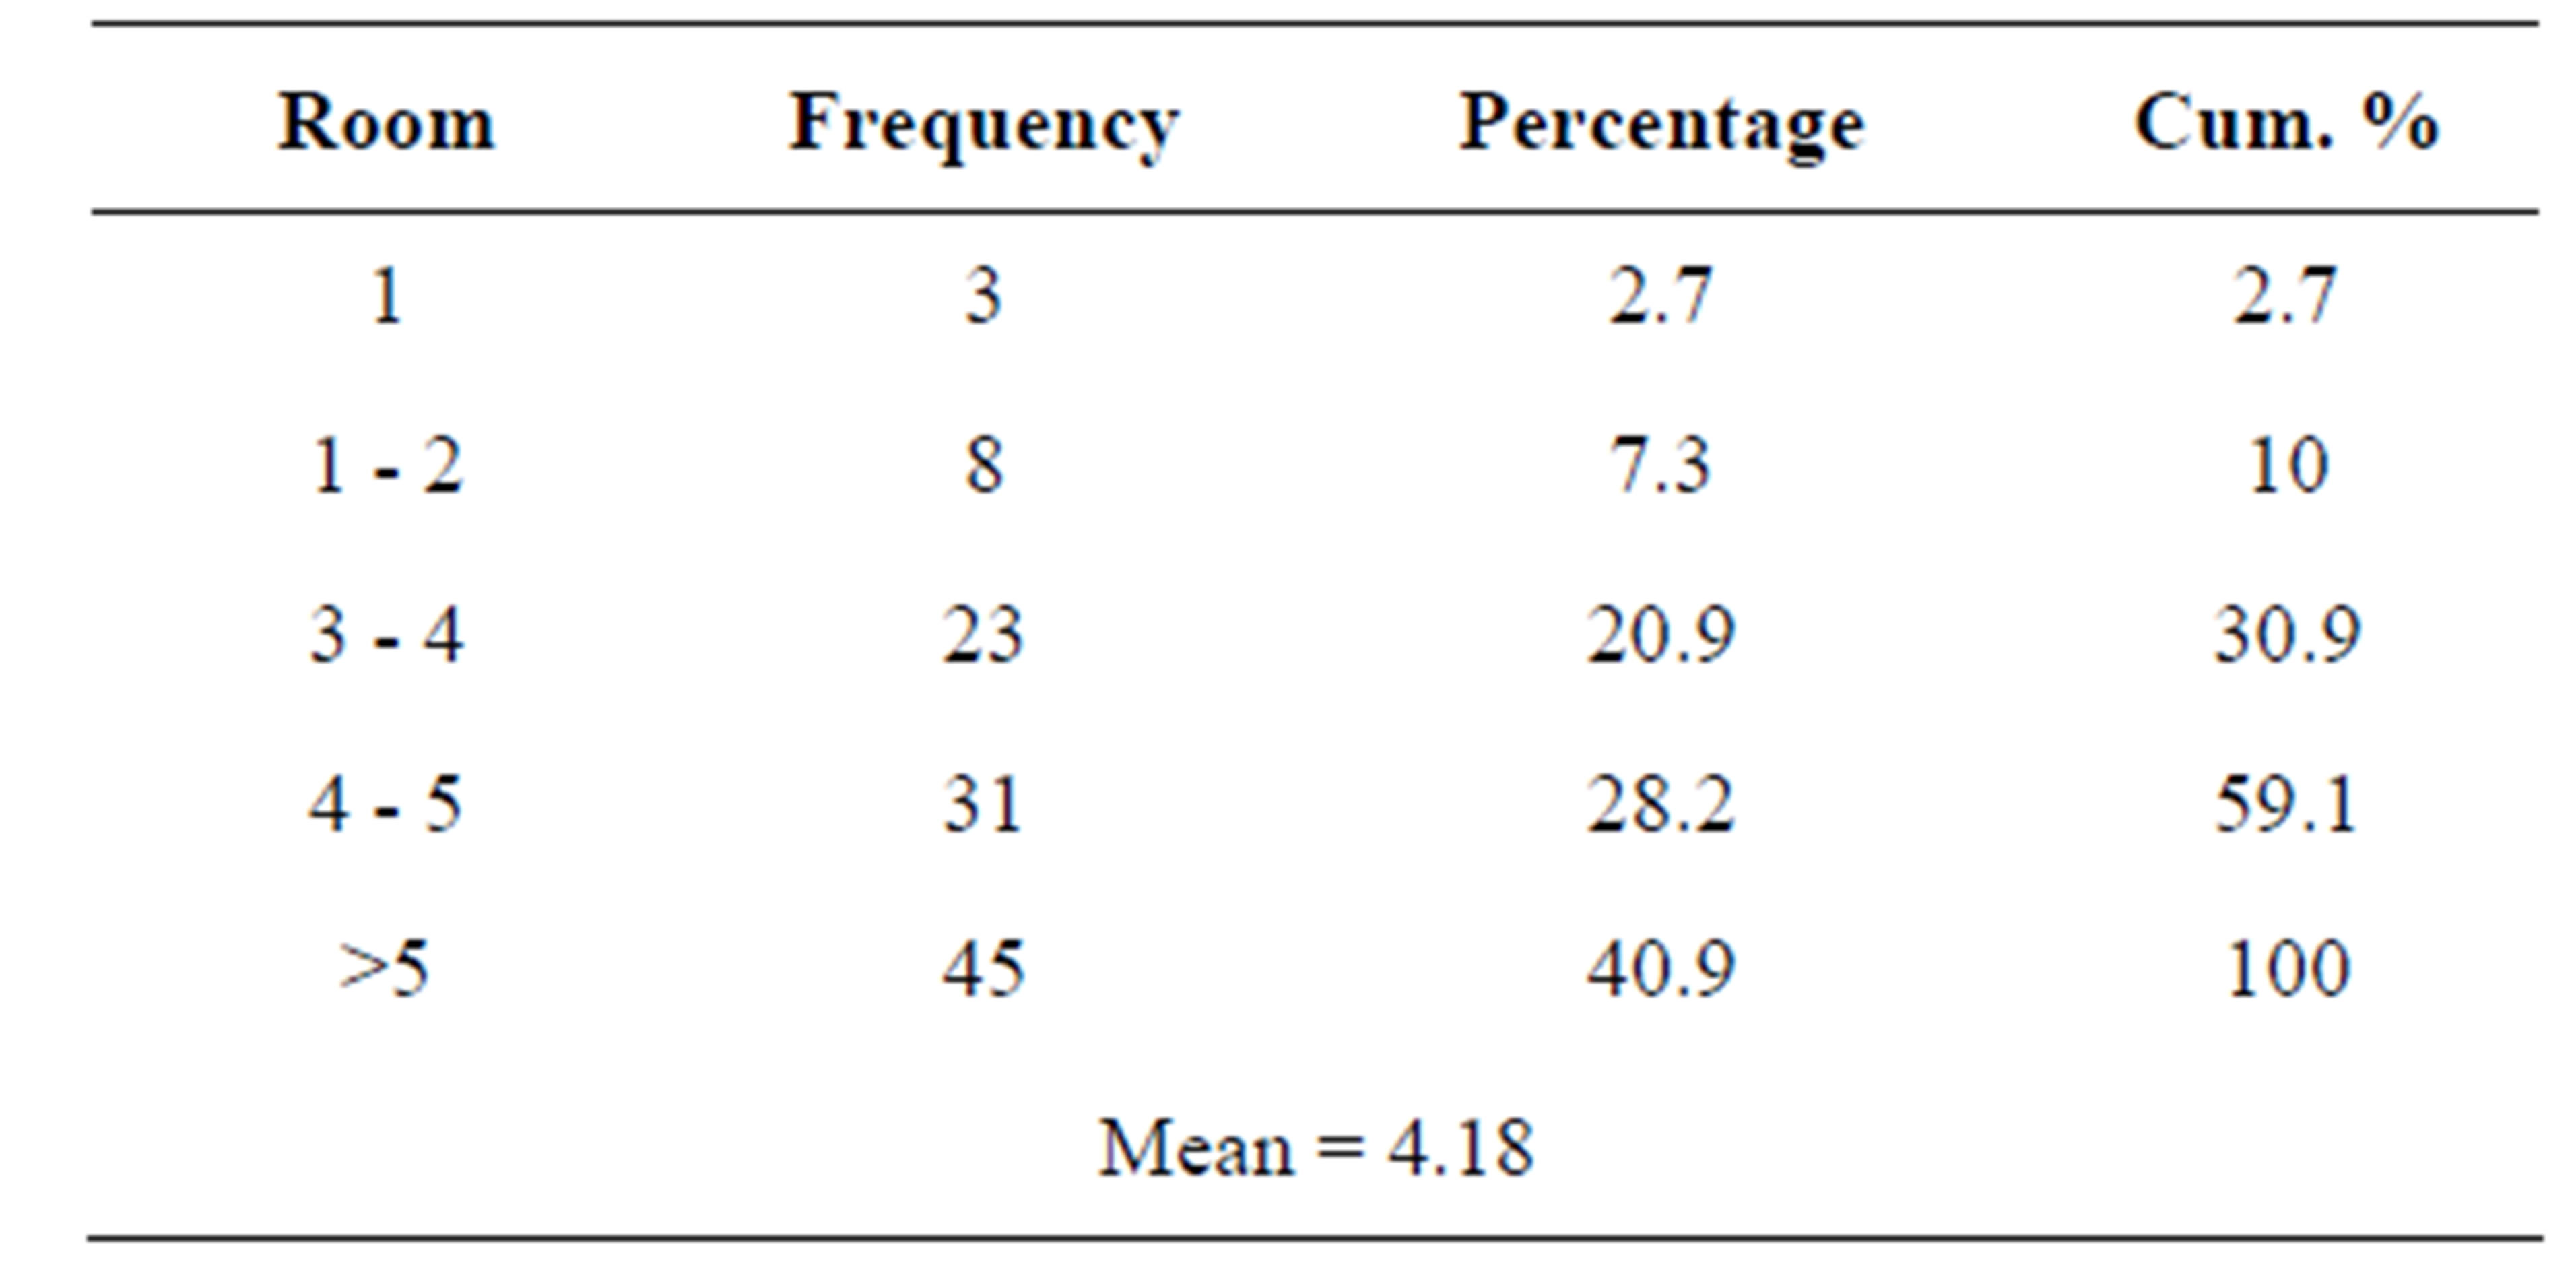 (f)
(f)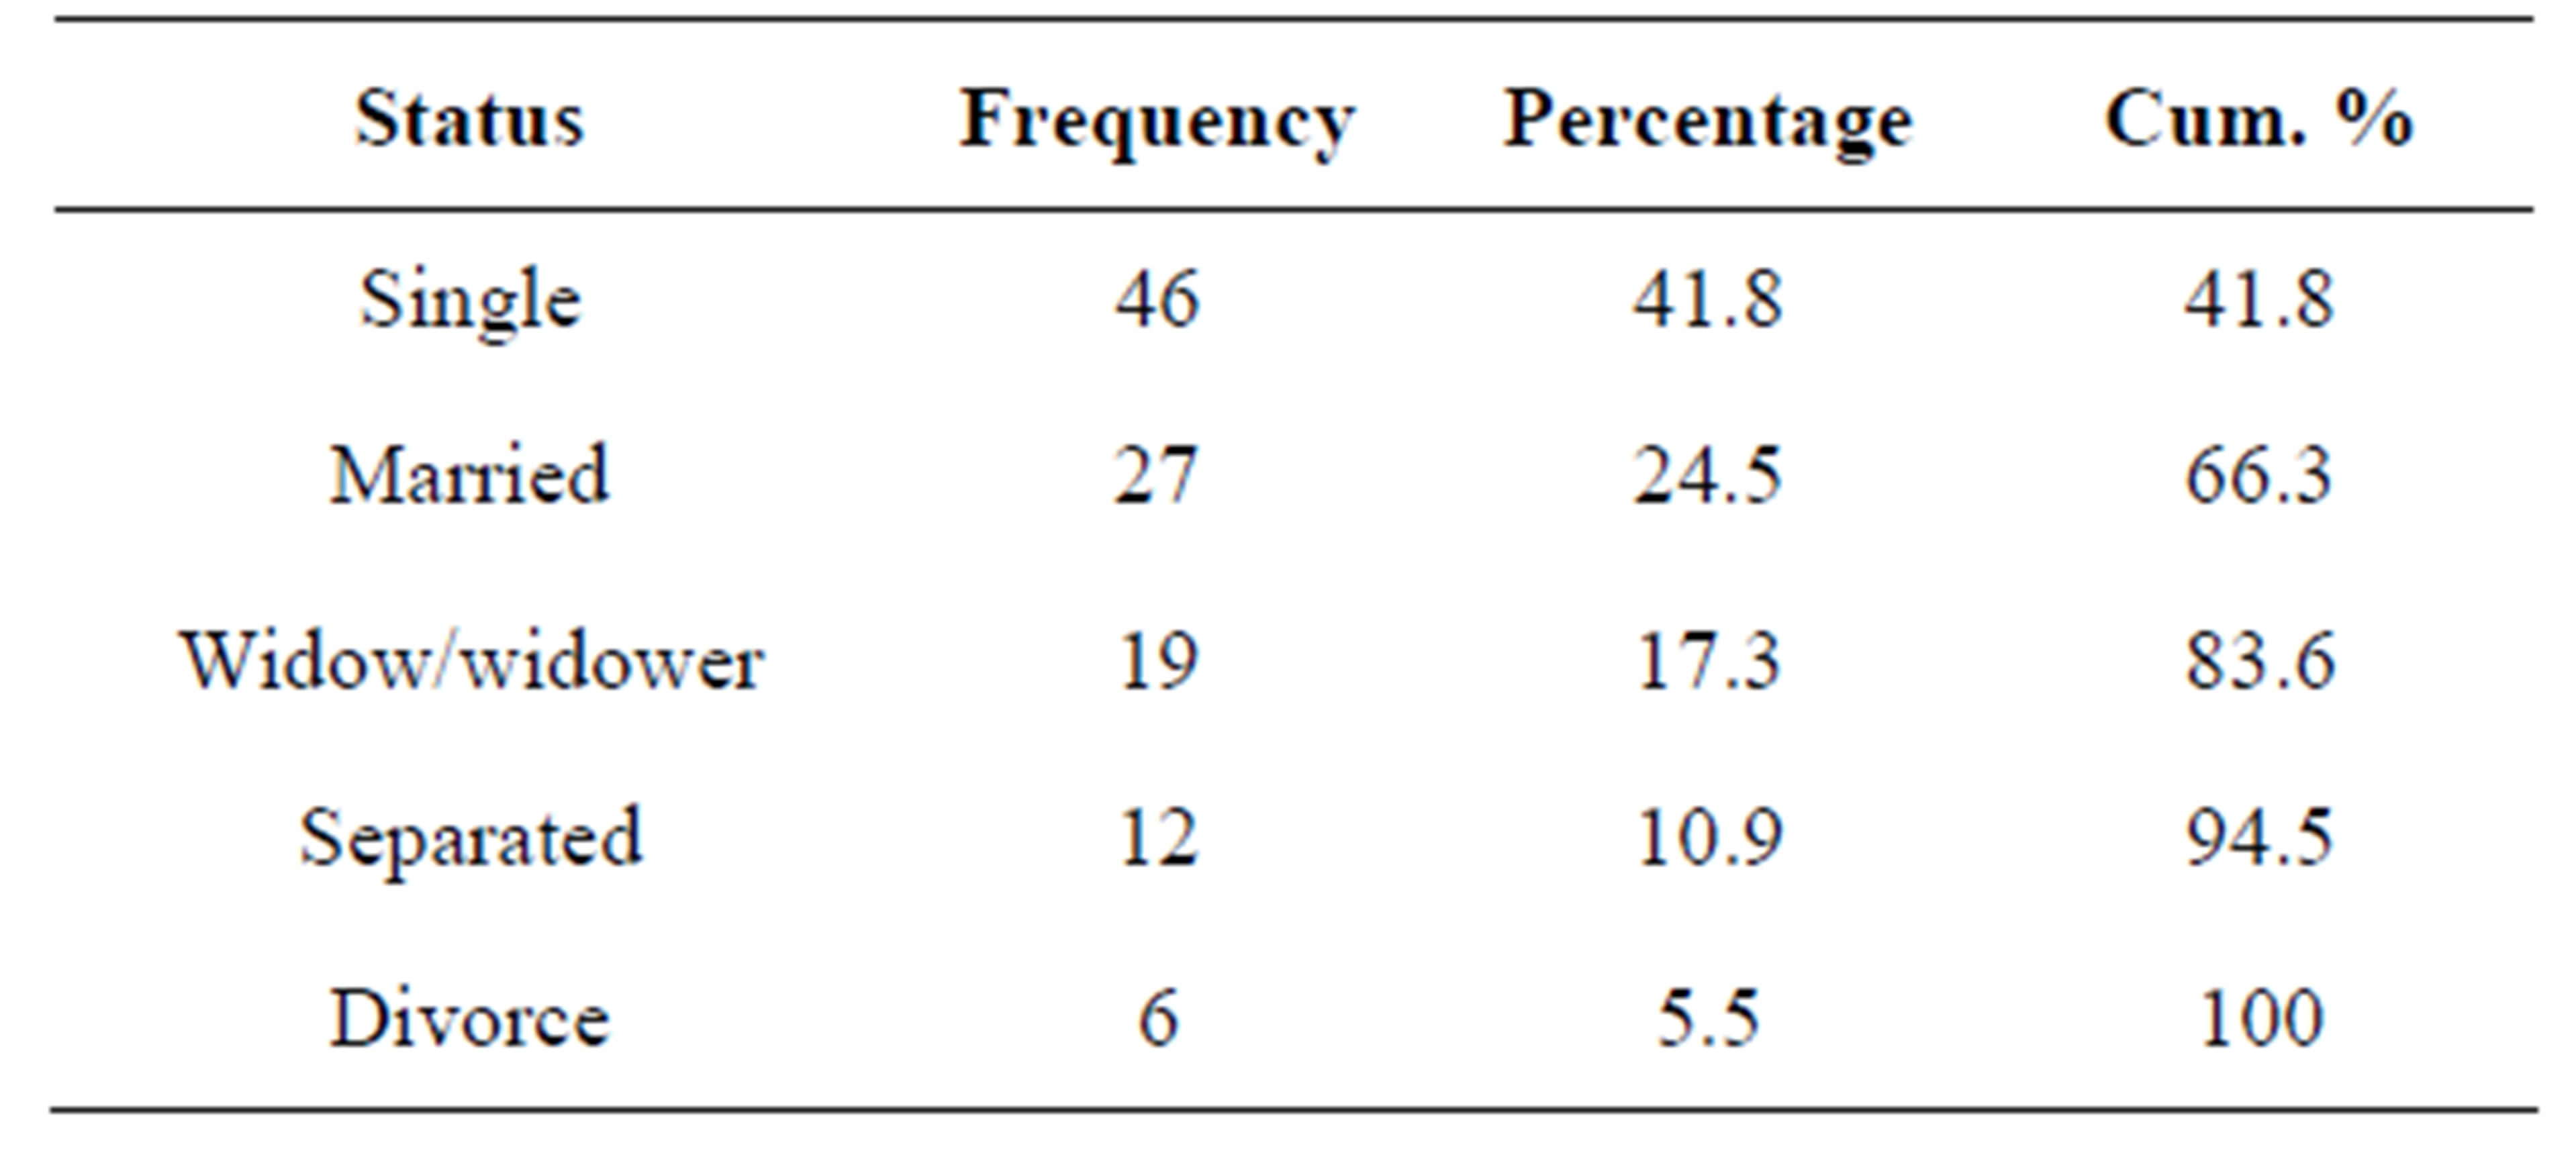 (g)
(g)
Table 1. frequencies, percentages, cumulative percentages and means of households’ socioeconomic factors. (a) Average family size (persons/hh); (b) Average age (years) of family size; (c) Employment status of household respondents; (d) Monthly income of respondents (in Leones); (e) Educational level of respondents.
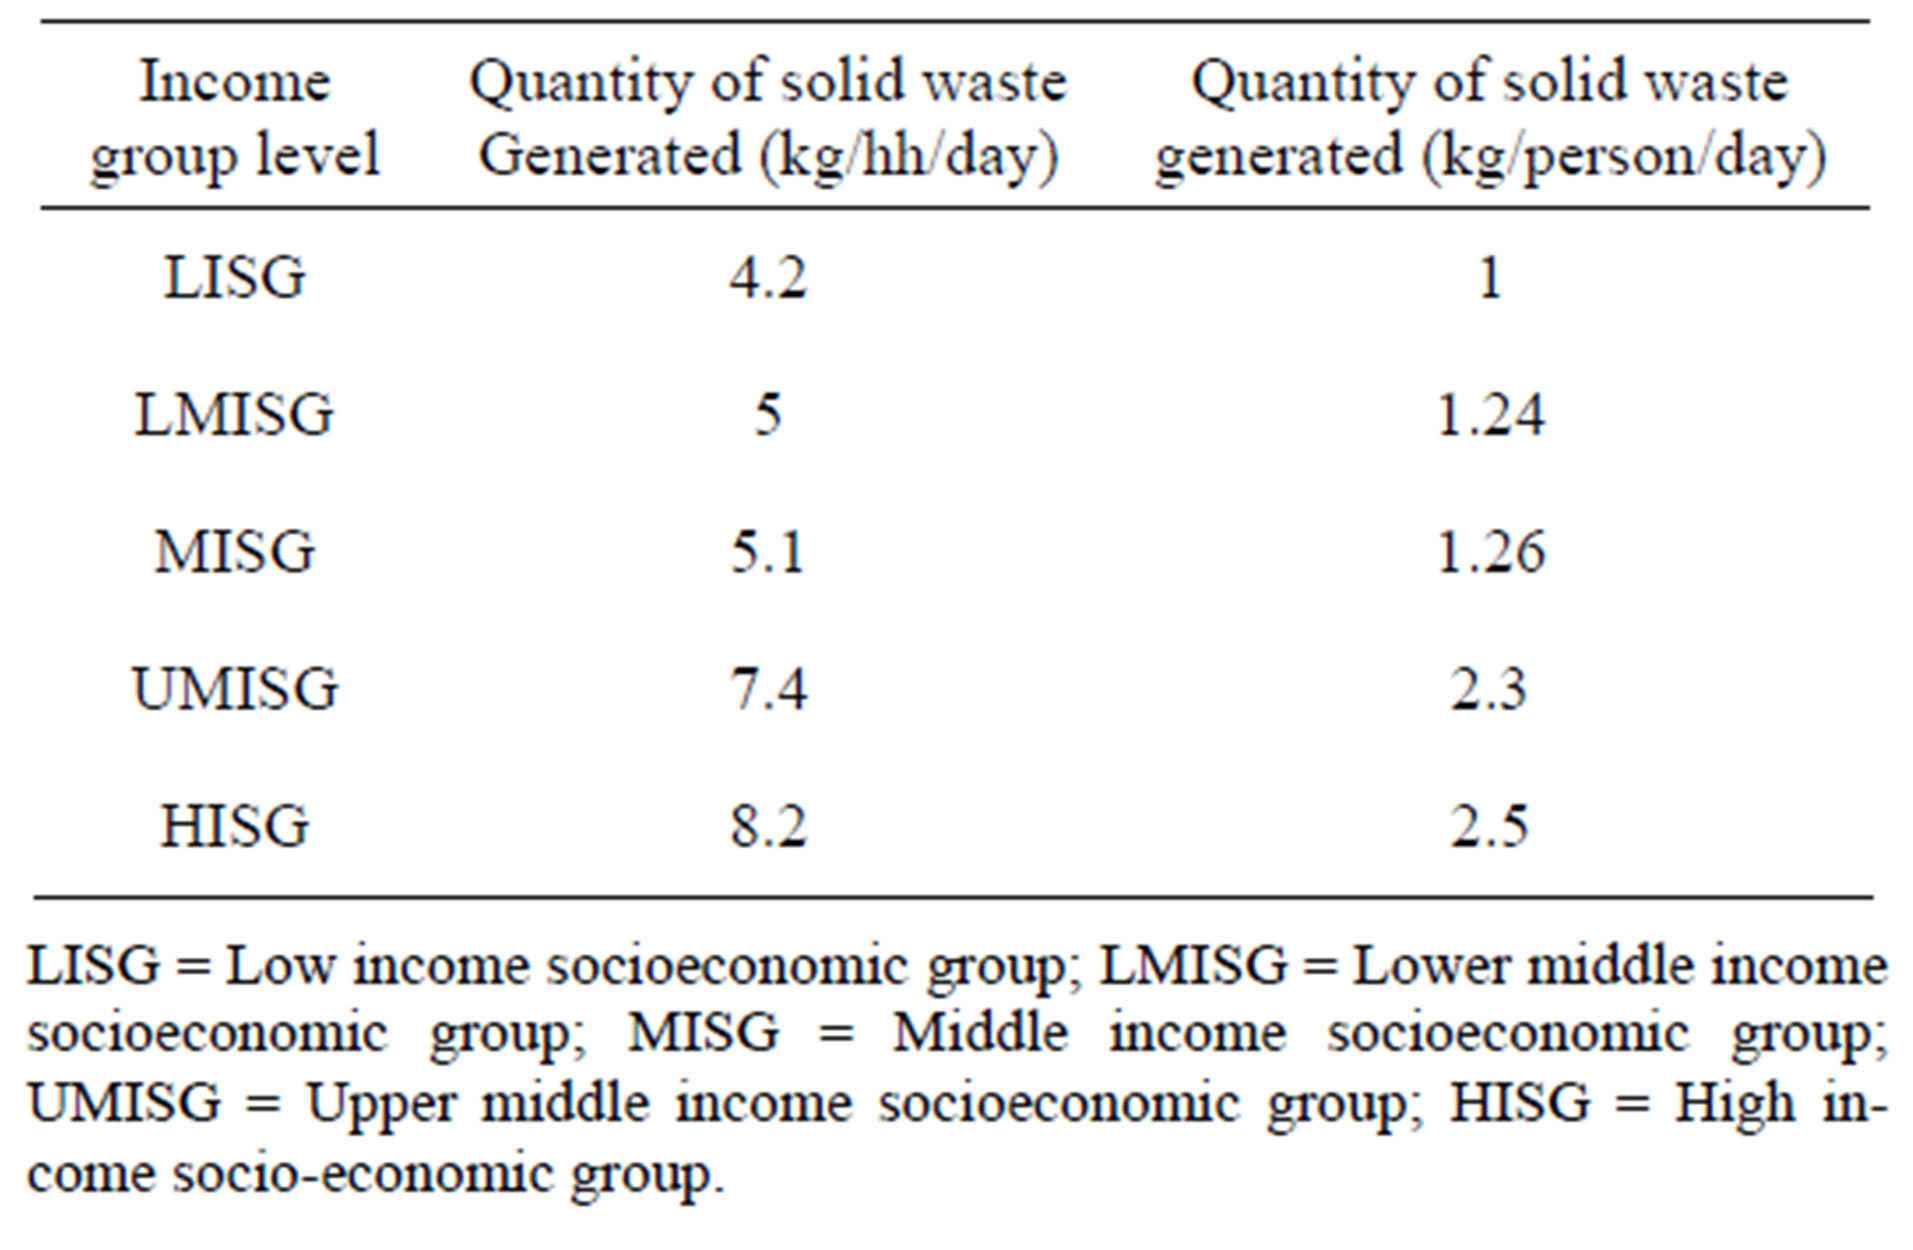
Table 2. Matching income groups with solid waste generation.
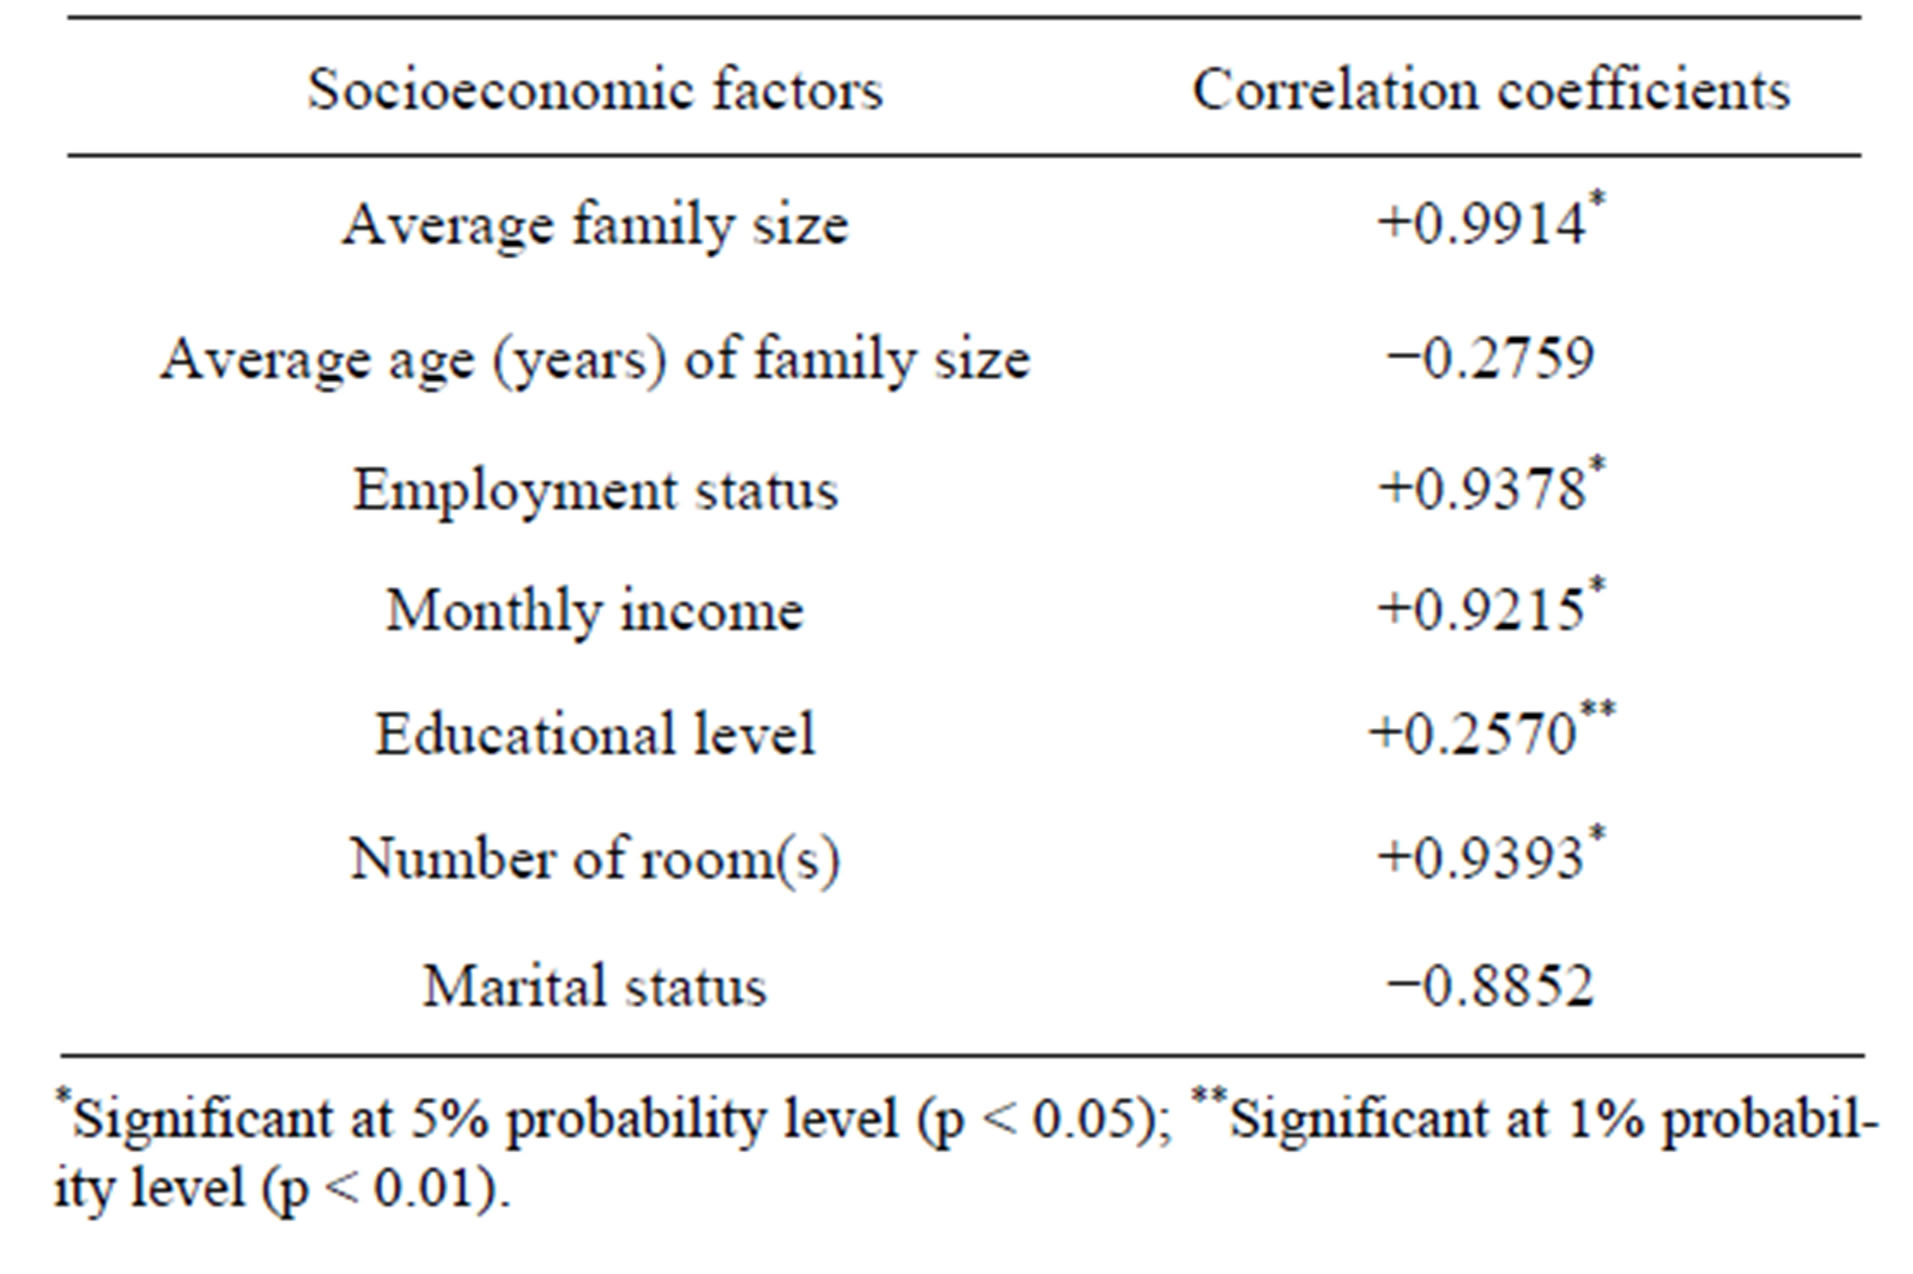
Table 3. correlation coefficients of socioeconomic factors.
variables (socioeconomic factors) and dependent variables (solid waste generation and composition).
The generation of household waste was found to be positively correlated with average family size, employment status, monthly income, educational level and number of room(s) occupied. This means that large quantities of solid waste were generated due to number of people in the family, number of people employed in the family, earning power of household members, their education, and the number of room(s) occupied by family members. Negative correlations were found between average age of family size and solid waste generation and between marital status and solid waste generation.
3.3. Relationship between Composition of Household Solid Waste and Socioeconomic Factors
A descriptive statistics on the composition of household solid waste and socioeconomic groups was shown in table 4. The data in this table indicates that garbage was the predominant component in the solid waste stream. This was because it consists of household refuse or rubbish and food waste of various components. Other types of solid waste are low in all households studied. This is in conformity with the study result of [33]—that food waste, a component of garbage dominates over the major portion of the solid waste generated in most developing countries.
The analysis shown in table 5 reveals that, education has positive correlation with plastics, wood, paper but a negative correlation with garbage; family size show a positive correlation with plastic, paper and wood but a negative correlation with garbage; income has a negative correlation with garbage; family employment has a negative correlation while marital status shows a positive correlation with garbage. Also, as the age of the family increases, the garbage waste decline (correlation −0.2393) while paper and plastic wastes increase.
4. Conclusions
The collected data on the relationship between socioeconomic factors (independent variables) and solid waste generation and composition (dependent variables) were presented and analyzed.
1) The study shows that household solid waste generation and composition varies from one household to another.
2) The correlation coefficient analysis on the various socioeconomic factors of the study indicates that monthly income, average family size, number of room(s) and employment status were the main influential factors in the
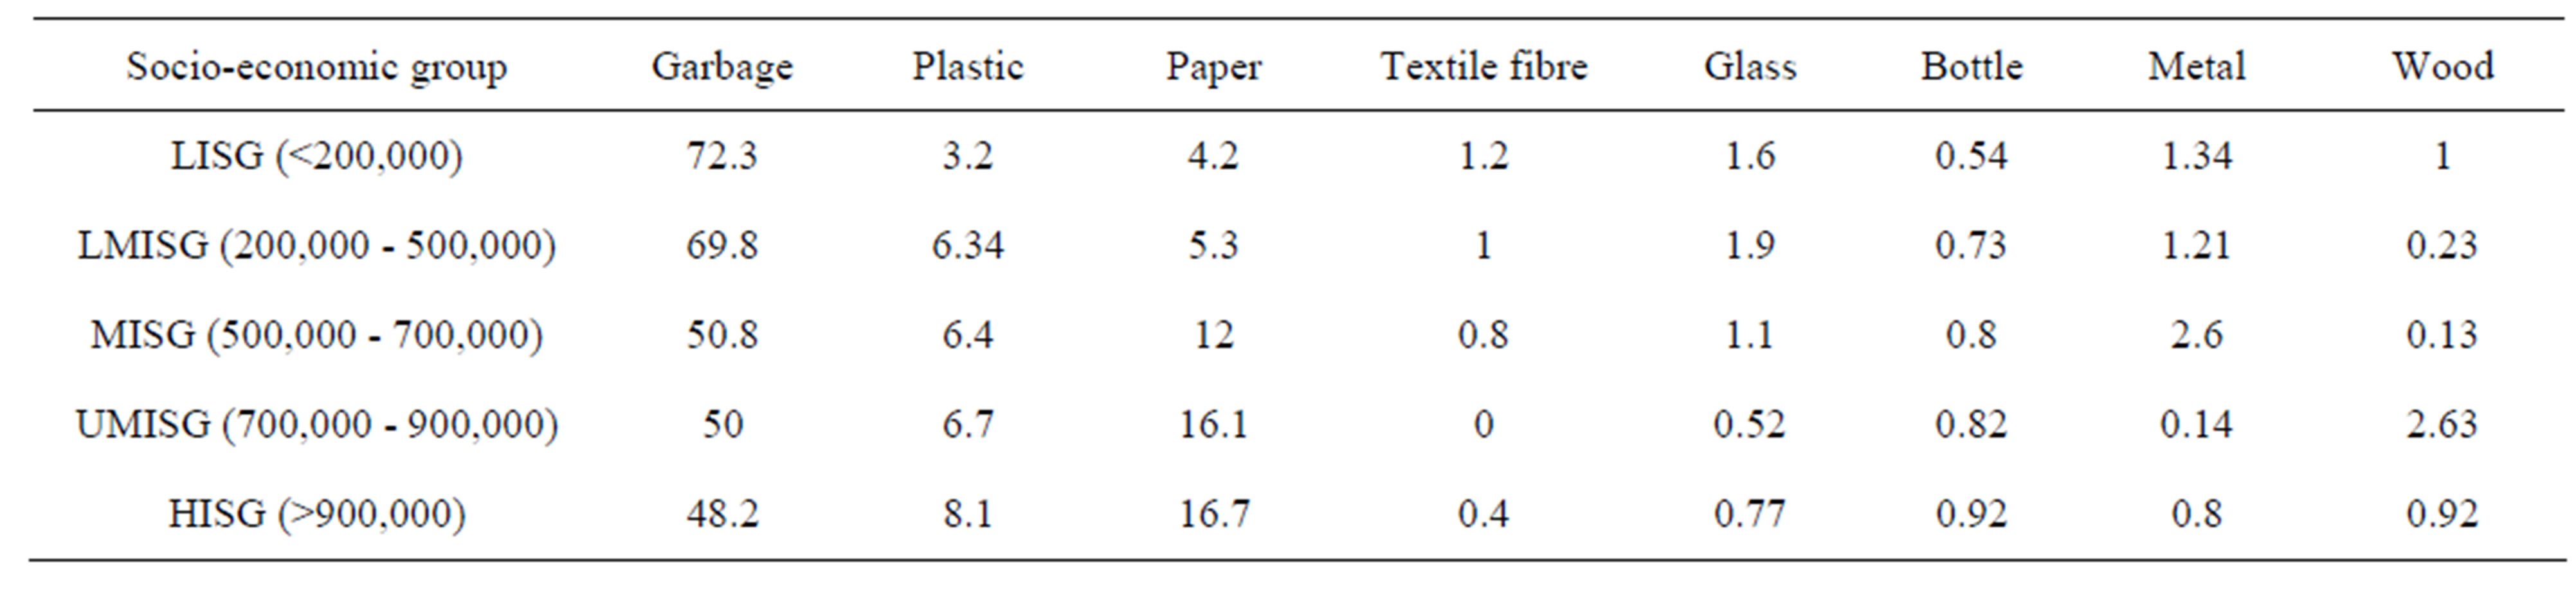
Table 4. Descriptive statistics on the socioeconomic groups and physical composition of household solid waste generated (as a percentage).
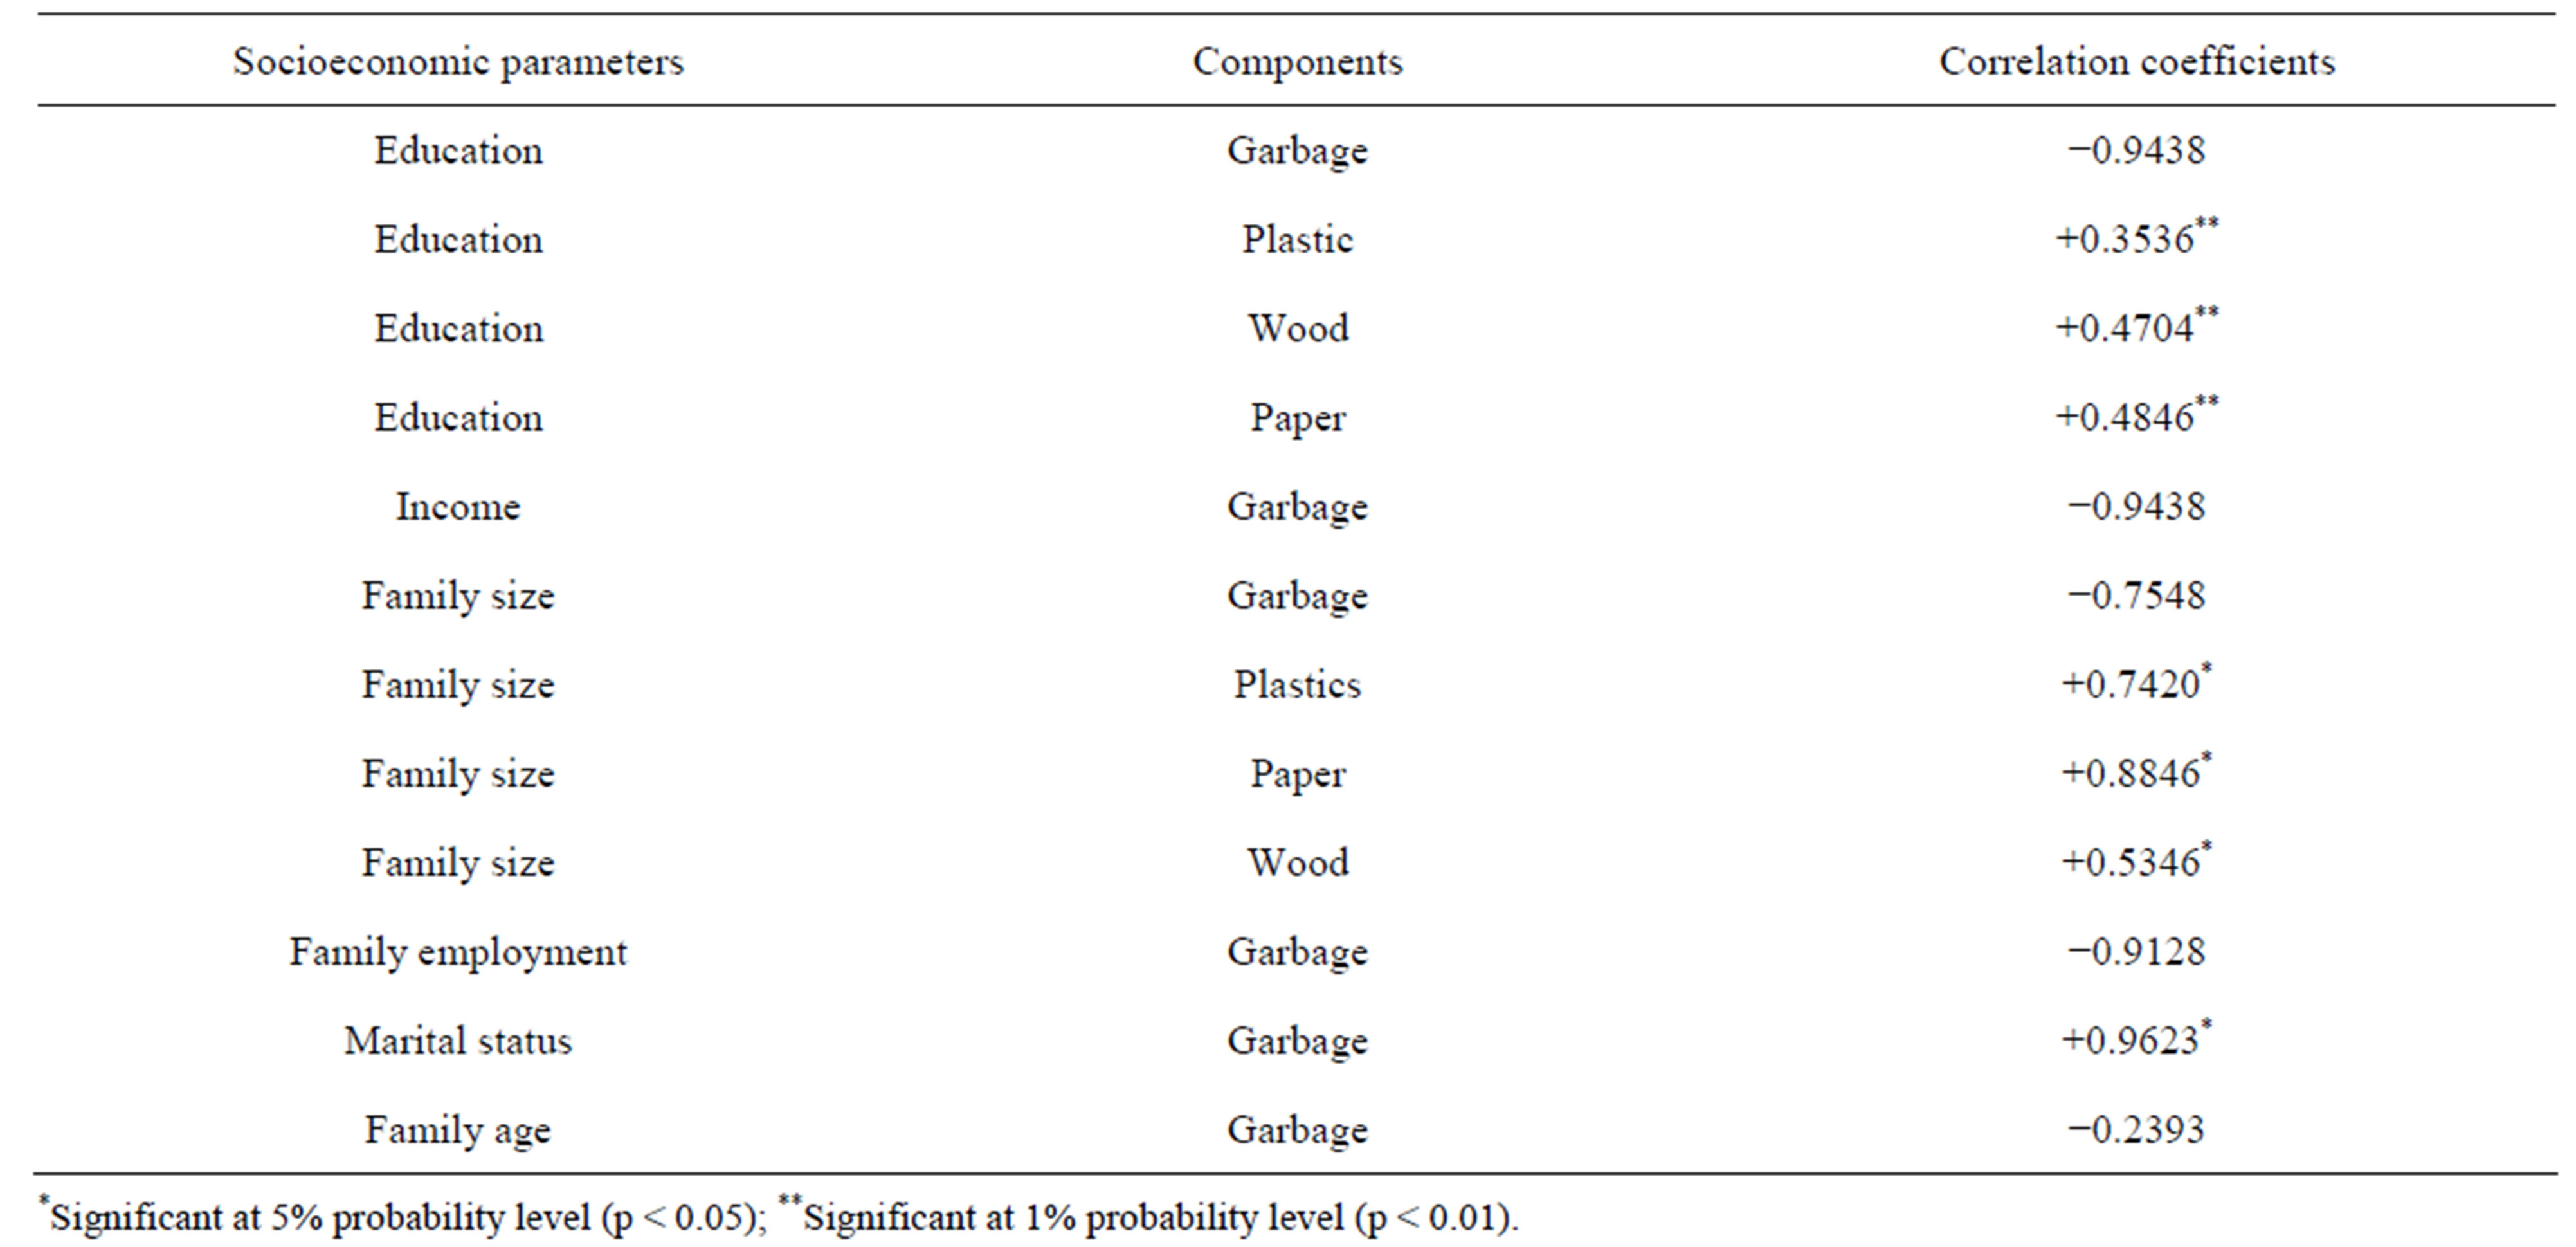
Table 5. Correlation coefficients among education, family employment, monthly income, family size and different types of solid waste generated.
reduction of both solid waste generation and composition in Freetown.
3) The quantity of solid waste generated and composition are two major important factors in designing the cost effectiveness and environmentally compatible solid waste management system in Freetown.
This study is the first in Freetown to assess the correlation of relevant socioeconomic factors affecting solid waste generation and composition. We therefore recommend further studies with a considerable range of households’ socioeconomic factors.
REFERENCES
- Population and Housing Census results, 2004. http://www.statistics.sl/
- M. B. Gleave, “Port Activities and the Special Structure of Cities: The East of Freetown,” Journal of transport geography, Vol.5, No. 4, 1997, pp. 257-275.
- W. Wang and Y. Wu, “Succession of Contemporary City Waste Policy and Necessity of Greeting the Waste Industry,” Ecological Economy, Vol. 10, 2001, pp. 34-37.
- O. Buenrostro and G. Bocco,”Solid Waste Management in Municipalities. In Mexco: Goals and Perspectives,” Resources, Conservation and Recycling, Vol. 39, No. 3, 2003, pp. 251-263. doi:10.1016/S0921-3449(03)00031-4
- D. Pokhrel and T. Viraraghan, “Municipal Solid Waste Management in Nepal: Practices and Challenges,” Waste Management, Vol. 25, No. 5, 2005, pp. 555-562. doi:10.1016/j.wasman.2005.01.020
- T. B. Yousuf, and M. Rahman, “Monitoring Quantity and Characteristics of Municipal Solid Waste in Dhaka City,” Environmental Monitoring Assessment, Vol. 135, No. 1-3, 2007, pp. 3-11. doi:10.1007/s10661-007-9710-6
- S. J. Burnley, “A Review of Municipal Solid Waste Composition in the United Kingdom,” Waste Management, Vol. 27, No. 10, 2007, pp. 1274-1285. doi:10.1016/j.wasman.2006.06.018
- S. S. Nas, and A. Bayram, “Municipal Solid Waste Characteristics and Management in Gumushane, Turkey,” Waste Management, Vol. 28, No. 12, 2008, pp. 2435- 2442. doi:10.1016/j.wasman.2007.09.039
- F. Philippe and M. Culot, “Household Solid Waste Generation and Characteristics in Cape Haitian City, Republic of Haiti,” Resources, Conservation and Recycling, Vol. 54, No. 2, 2009, pp. 73-78. doi:10.1016/j.resconrec.2009.06.009
- X. Qu, et al., “Survey of Composition and Generation Rate of Household Waste in Beijing, China,” Waste Management, Vol. 29, No. 10, 2009, pp. 2618-2624.
- N. P. Thanh., Y. Matsui and T. Fujiwara, “Household Solid Waste Generation and Characteristics in a Mekong Delta City Vietnam,” Journal of Environmental Management, Vol. 91, No. 11, 2010, pp. 2307-2321. doi:10.1016/j.jenvman.2010.06.016
- I. A. Al-Khatib, et al., “Solid Waste Characterization, Quantification and Management Practices in Developing Countries. A Case Study: Nablus District—Palestine,” Journal of Environmental Management, Vol. 91, No. 5, 2010, pp. 1131-1138. doi:10.1016/j.jenvman.2010.01.003
- A. Rafia, H. Keisuke and T. Rabbah, “The Role of Socioeconomic Factors on Household Waste Generation: A Study in a Waste Management Program in Dhaka City, Bangladesh,” Research Journal of Applied Sciences, Vol. 5, No. 3, 2010, pp. 183-190.
- F. F. Hudson and H. M. David, “Solid Waste Generation and Services Quality,” Journal of Environmental Engineering, Vol. 103, No. 2, 1997, pp. 935-946.
- M. Sujauddin, S. M. S. Huda and A. T. M. Rafiqul Hoque, “Household Solid Waste Characteristics and Management in Chittagong, Bangladesh,” Waste Management, Vol. 28, No. 9, 2008, pp. 1688-1695. doi:10.1016/j.wasman.2007.06.013
- M. O. Saeed, M. N. Hassan and M. A. Mujeebu, “Assessment of Municipal Solid Waste Generation and Recyclable Materials Potential in Kuala Lumpur, Malaysia,” Waste Management, Vol. 29, No. 7, 2009, pp. 2209-2213. doi:10.1016/j.wasman.2009.02.017
- G. Tchobanoglous, H. Theisen and S. Vigil, “Integrated Solid Waste Management,” McGraw-Hill, New York, 1993.
- P. A. Vesilind, W. Worrel and D. Reinhart, “Solid Waste Engineering,” Books/Cole Thomson Learning, Pacific Grove, 2002.
- S. Ojeda-Benitez, C. A. Vega and M. Y. Marquez-Montenegro, “Household Solid Waste Characterization by Family Socioeconomic Profile as Unit of Analysis,” Resources, Conservation and Recycling, Vol. 52, No. 7, 2008, pp. 992-999. doi:10.1016/j.resconrec.2008.03.004
- M. Y. Marquez, S. Ojeda and H. Hidalgo, “Identification of Behavior Patterns in Household Solid Waste Generation in Mexicali’s City: Study Case,” Resources, conservation and Recycling, Vol. 52, No. 11, 2008, pp. 1299- 1306.
- N. J. Bandara, J. P. Httiaratchi, S. C. Wirasingbe and S. Pilapiiya, “Relation of Waste Generation and Composition to Socioeconomic Factors: A Case Study,” Environmental Monitoring and Assessment, Vol. 135, No. 1-3, 2007, pp. 31-39. doi:10.1007/s10661-007-9705-3
- K. L. Wertz, “Economic Factors Influencing Household’s Production of Refuse,” Journal of Environmental Management and Economics, Vol. 2, No. 4, 1976, pp. 263- 272. doi:10.1016/S0095-0696(76)80004-6
- A. H. Al-momani, “Solid Waste Management: Sampling, Analysis and Assessment of Household Waste in the City of Amman,” International Journal of Environmental Health research, Vol. 4, No. 4, 1994, pp. 208-222. doi:10.1080/09603129409356820
- D. Grossmann, J. F. Hudson and D. H. Marks, “Waste Generation Models for Solid Waste Collection,” Journal of the Environmental Engineering Division, Vol. 100, 1974, pp. 1219-1230.
- R. A. Richardson and J. Havlicek Jr., “Economic Analysis of Composition of Household Solid Wastes,” Journal of Environmental Economics and Management, Vol. 5, No. 1, 1978, pp. 103-111. doi:10.1016/0095-0696(78)90007-4
- M. Medina, “The Effect of Income on Municipal Solid Waste Generation Rates for Countries of Varying Levels of Economic Development: A Model,” Journal of Resource Management and Technology, Vol. 24, No. 1, 1997, pp. 149-155.
- A. Bruvoll, “Factors Influencing a Solid Waste Generation and Management,” Journal of Solid Waste Technology and Management, Vol. 27, 2001, pp. 156-162.
- J. G. J. B. Nilanthi, J. A. H. Patrick, S. C. Wirasingbe and P. Smith, “Relation of Waste Generation and Composition to Socioeconomic Factors; A Case Study,” Environmental Monitoring and Assessment, Vol. 135, 2006, pp. 31-39.
- G. J. Dennison, V. A. Dodd and B. A. Whelan, “Socioeconomic Based Survey of Household Waste Characteristics in the City of Dublin Ireland 1,” Waste Composition. Resources, Conservation and Recycling, Vol. 17, No. 3, 1996, pp. 227-244. doi:10.1016/0921-3449(96)01070-1
- O. Buenrostro, G. Bocco and J. Vence, “Forecasting Generation of Urban Solid Waste in Developing Countries —A Case Study in Mexico,” Journal of Air and Water Management Association, Vol. 51, No. 1, 2001, pp. 86-93. doi:10.1080/10473289.2001.10464258
- D. V. Raje, P. D. Wakhare, A. W. Deshpande and A. D. Bhide, “An Approach to Assess Level of Satisfaction of the Residents in Relation to Solid Waste Management System,” Journal of Waste Management and Research, Vol. 19, No. 1, 2001, pp. 12-19. doi:10.1177/0734242X0101900103
- SPSS 16.0 (Computer Program), SPSS Inc., Chicago, 2005.
- C. Visvanathan, “Solid Waste Management in Asia perspectives,” Asian Institute of Technology, Bangkok, 2006.