Energy and Power Engineering
Vol.5 No.8(2013), Article ID:37364,8 pages DOI:10.4236/epe.2013.58054
Catastrophe of Power Transmission System
1Instituto Superior Técnico, Lisbon, Portugal
2University of Belgrade, Institute of Nuclear Sciences Vinča, Belgrade, Serbia
3University of Western Macedonia, Kozani, Greece
Email: *deki@vinca.rs
Copyright © 2013 Naim H. Afgan et al. This is an open access article distributed under the Creative Commons Attribution License, which permits unrestricted use, distribution, and reproduction in any medium, provided the original work is properly cited.
Received March 8, 2013; revised April 8, 2013; accepted April 15, 2013
Keywords: Power Transmission System; Catastrophe Event; Resilience Index; Resilience Capacity
ABSTRACT
Power systems are critical infrastructures in the same way as gas and oil networks, water networks, transportation networks, telecommunications systems and computer systems. These complex networked systems are increasingly interdependent on each other, as the digital society matures on a global scale. A typical example of a critical infrastructure vulnerability that undergoes rising vulnerability to catastrophic failure is the power transmission network. There are several reasons for such a situation to prevail. Firstly, as witnessed in developed countries, there has been a very slow expansion of the high voltage transmission grid during recent decades due to stringent regulations put forward in response to environmental concerns. Secondly, there are the profound structural reforms that the power industry has embarked on, which are geared toward the emergence and consolidation of competitive energy markets. In the evaluation of catastrophe of the power transmission system, the most important parameter to be taken into a consideration is resilience index of electro-magnet floury. In particular, it has been taken into consideration its effect on the different fields of human interest.
1. Introduction
Power systems are critical infrastructures in the same way as gas and oil networks, water networks, transportation networks, telecommunications systems and computer systems. These complex networked systems are increasingly interdependent on each other, as the digital society matures on a global scale.
Consequently, their vulnerability and security are raising major concerns worldwide. For instance, the normal operation of water and telecommunication systems is maintained only if there is a steady supply of electrical energy. On the other hand, the generation and delivery of electricity cannot be ensured without provision to the power plants and power networks of fuel, water and various telecommunications and computer services for data transfer and control purposes. These interdependencies are strengthening their grip as the usage of the internet, intranet and other wide area computer networks are becoming prevalent. The strong reliance of critical infrastructures on each other may turn a local disturbance in one of them into a large-scale failure via cascading effects, which may have a catastrophic impact on the whole of society. Unfortunately, the risk of such a disastrous domino effect is growing because of the current trend to operate critical infrastructure systems closer to their stability or capacity limits. One compelling reason for this practice is, of course, economics. Providing these infrastructures with some degree of robustness comes at a price, which entails the achievement of the required level of redundancy in the equipment [1].
A typical example of a critical infrastructure that undergoes rising vulnerability to catastrophic failure is the power transmission network. There are several reasons for such a situation to prevail. Firstly, as witnessed in developed countries, there has been a very slow expansion of the high voltage transmission grid during recent decades due to stringent regulations put forward in response to environmental concerns. Secondly, there are the profound structural reforms that the power industry has embarked on, which are geared towards the emergence and consolidation of competitive energy markets [2-6]. In Europe [3], South America [4], the Pacific [2], and now in North America [5,6], government institutions have issued new regulations to transform the vertically integrated utilities into independent generation, transmission, and distribution companies. In these emerging competitive electricity markets, the wholesale market is the first to flourish and expand at a rapid rate, boosted by transmission’s open access and the existence of a large variability in electricity prices between the US states. This price discrepancy has resulted in a growing amount of bulk power being transferred over long distances throughout the transmission grid, worsening a shortage of reserve margins in transmission that has prevailed since the mid 1980s. Consequently, blackouts and brownouts in the eastern and western parts of the country have been increasing in number at an alarming rate during recent years [7,8].
In bulk power transmission system planning and operation, the present practice is to carry out an N-1 contingency analysis [9]. Occasionally, an N-2 security analysis is employed in some stringent cases. However, it is implemented not via an exhaustive search but rather via a partial assessment of the system reserves over a small portion of the transmission network. An N-k security analysis for k > 1 is perceived as being impossible to achieve due to the huge number of cases that need to be investigated. In fact, under the assumption of independence between successive events, it would require checking the impact on the system reserve margins of the loss of every k out of N pieces of equipment, which yields a number of cases to be tested that grow exponentially with N. However, it is clear that this chain of contingencies is dependent on each other due to the protection-system interactions, either directly or indirectly via the changes in the distribution of power through the network or due to the possible multiple impacts of a triggering event, such as lightning or other natural hazards. Consequently, the probability of the occurrence of cascading failures is much higher than the probability of a random (i.e. independent) tripping of k out of N components of the system.
It is also the usual practice in reliability and security analysis to neglect the impact of the protection systems. As a result, cascading failures leading to blackouts or brownouts are not investigated. Until recently, large scale blackouts were considered to be sufficiently rare events to be disregarded from the analysis. However, at least in the USA, ideas are evolving in this respect, prompted by the increasing number of major incidents that have plagued the US power systems since the mid 1990s. The frequency of major blackouts, which was about one per decade until 1996, has started to grow at an alarming rate since then [7,8]. For example, in July 1996, a series of blackouts struck the western part of the USA, leaving 2.2 million customers without electricity. One month later, islanding and blackouts affected eleven US western states and two Canadian provinces.
In December 1998, the Bay area of San Francisco experienced a series of blackouts and in July 1999, it was the turn of New York City to suffer from the same type of cascading failures. More recently, California has been struck by rolling blackouts initiated by the utilities to overcome a severe shortage of generation during peak hours. An exhaustive account of these blackouts can be found in the report prepared for the Transmission Reliability Program of the Department of Energy [8]. Besides the causes of the degradation of the power system reliability listed previously, there is the detrimental role played by the protection systems during large disturbances. As revealed by the study undertaken by the NERC over the period from 1984 to 1988 [9-12], in 73.5% of the significant disturbances that were investigated, undetected failures of the protection systems, termed hidden failures (HFs), have aggravated the disturbance by tripping fault free system components and, thereby, helped the perturbation to propagate further. One peculiarity of hidden relay failures is that they cannot be detected a priority, that is, they cannot be exposed before the system is perturbed. In particular, routine maintenance testing may not detect them or, even worse, may induce them by damaging relay components, as was the case in the 1977 New York blackout. Another source of HFs is the bad setting of relays. The present practice favors dependability at the expense of security, in that it ensures the isolation of a fault by allowing the tripping of fault free devices from time to time.
This paper describes methodologies together with algorithms that assess the risk of catastrophic failures in power networks. It builds on the pioneer work carried out by Thorp, Phadke, Horowitz and Tamronglak [11,12]. A catastrophic failure is here defined as one that results in the outage of a sizable amount of load, say 10% of the peak load. It may be caused by dynamic instabilities in the system or exhaustion of the reserves in transmission due to a sequence of line tripping leading to voltage collapse. Only the latter case is being considered. The aim of these algorithms is to identify the weak links in the systems, which are defined as those branches of the network that tripping due to a fault lead to the highest probabilities of a catastrophic failure. Once the weak links are identified, they must be consolidated. To this end, a hidden failure monitoring and control system may be developed to supervise adaptive digital relays located in sensitive spots across the system. These relays may perform dynamic load shedding during an emergency state in conjunction with an adaptive splitting of the system that prevents the cascading failures from spreading throughout the network.
2. Resilience Metrics
The safety of an energy system is the immanent property to any system. It reflects the quantitative measure of degradation of the system. It may be seen as the potential property predicting total degradation of the system. It is commonly known that any degradation of the system proceeds with changes of the main properties of the system. Since the sustainability index is a complex property of the system, it will lead to the possibility to define those change rates, that may have different consequences [13].
The resilience of an energy system is defined as the capacity of an energy system to withstand perturbations from e.g. climatic, economic, technological and social causes and to rebuild and renew itself afterwards. In this respect, quantification of the resilience capacity can be used as the merit to withstand differing events leading to potential damaging consequences. So, the change of resilience of an energy system can be used in the assessment of the system behavior and the potential for its malfunction development. As the sustainability index definition we have used specific quality indicators reflecting corresponding criteria, it is possible to use the sustainability index as the resilience metric parameter. The change of the economic indicator is intrinsic to the specific characteristic to be measured in the time scale. The time change of the economic indicators is common to the classical evaluation of a system. Any crises of the economic system are preceded with corresponding changes in the economic indicators of the system. Qualitative measurement of the indicator changes may lead to the forecast of the economic crises, which is only one element of the potential disastrous changes of the system affecting its safety [14].
The mutual interaction between the system and its surrounding is imminent for any system. The changes in interaction rate will affect the safety of the system. If these processes are in steady state, it can be considered that the system is safe. As good example for this type of changes of indicator is the interaction of system and its surrounding in the case of radioactive leaks from nuclear facilities, which may lead to hazardous consequences.
The change of social element of complexity of the system is a property of the complex system. The social aspect of the system includes the risk of changes as health hazards and may have to deal with a compounding of complexity at different levels. It is of interest to notice that some of the social changes are an inherent characteristic of the system. As an example we can take any strike, which is the result of the economic changes of the system. A similar example can be seen if there is a sudden change in the environment, which will lead to social disturbances.
3. Mathematical Formulation of Sustainability Index
Before you if it is assumed that the Sustainability index is a linear agglomeration function of products between indicators and corresponding weighting coefficients, we can write the aggregation function, which is presented in the form of an additive convolution. If it is adapted, which means that each of the criteria is weighted by the respective factor, the sum of the criteria multiplied with the corresponding factor will lead to the Sustainability Index [15].
For the case under consideration, the sum of specific indicator multiplied with the corresponding weight coefficient will lead to the Sustainability Index, Q(t), with the following mathematical formulation
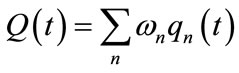 (1)
(1)
where
ωn—weighting coefficient for the n-th specific indicator;
qn—n-th criterion for sustainability assessment.
4. Resilience Index for Energy System
Resilience index, presented in Figure 1, is graphical presentation of the sudden sustainability index change in time and its recovery to the initial state of the system. The integral value of the sustainability index recovery after a sudden change leads to the definition of resilience index.
The resilience index is integral of the sustainability index between the time of the sudden change in the respective indicator and the time when it resumes a steady state value. The resilience index for an energy system is composed of the following elements: economic, environmental, technological and social.
Resilience index is the variable immanent to the specific potential hazard. This means that resilience index as the parameter which quantifying the potential probability for the malfunction of the system. Resilience index is expressed with following mathematical formulation:

Figure 1. Graphical presentation of resilience index.
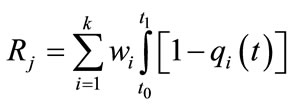 (2)
(2)
where
Rj—resilience index;
qi—indicator;
wi—weight coefficient.
In this definition it is anticipated that there is time independent constant for every indicator.
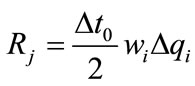
The resilience index is composed of sub-indicators. In the same way the economic, environmental, technological and social resilience element could be obtained, as follows. Under the assumption that the sudden indicator change resumes is a linear function of time, then we can write:

If it is assumed that the time interval for resuming starting state is equal for all indicators than the resilience index for the individual case is:
The total resilience index is an additive function of all resilience indexes as follows:
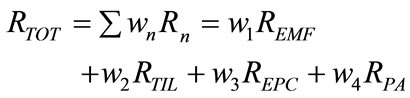
where
RTOT—total resilience index;
REMF—electro-magnetic flux;
RTIL—thickness of ice layer on electric wiring;
REPC—electric power consumption;
RPA—public awareness of the potential blackout;
wn—weighting factor.
Generic flow chart for the resilience index monitoring is shown in Figure 2.
The resilience index of a power transmission system is the parameter which comprises capacity of the system to withstand the change of the selected indicators defined by the individual indicators [14-20]. For the power transmission system set of indicators is used to define system capacity reflecting the change of indicators. Among the indicators effecting resilience index are a following sudden change of indicators: electro-magnetic flux, thickness of ice layer on electric wiring, voltage of the power transmission system, electric power consumption, and public awareness of the potential blackout.
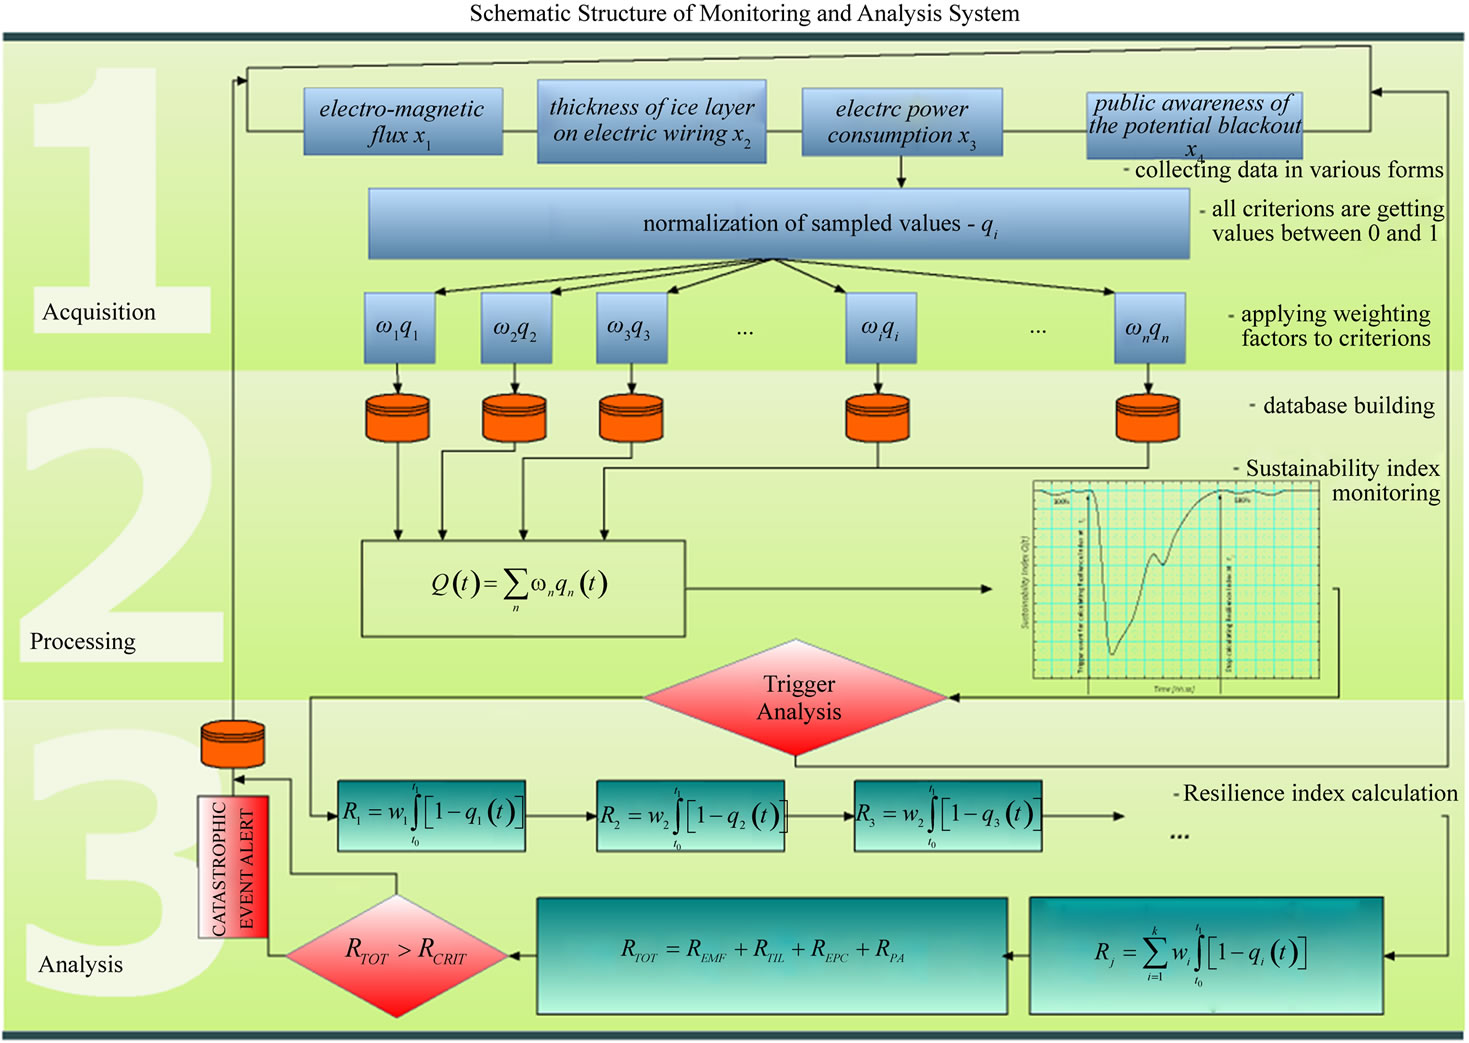
Figure 2. Monitoring and analysis of resilience index of a power transmission system.
5. Resilience Index Verification
In the evaluation of the Power Transmission System the following indicators are taken into consideration.
5.1. Graphical Presentation of Electro-Magnetic Flux Indicator
Electromagnetic pulses damage electrical and electronic circuits by inducing voltages and currents that they are not designed to withstand. To understand how this occurs, it is necessary to understand both the characteristics of electromagnetic pulses and the circuits they offend. An electromagnetic pulse is defined by its rise time (measured in volts/second), its electrical field strength (measured in volts/meter (v/m)), and its frequency content (measured in Hertz [Hz]).These factors combine to determine the threat electromagnetic pulses pose to a given system.
It is anticipated that the sudden change electro-magnetic flux indicator is at the time t0 and will be recovered at the time t2 (Figure 3).
5.2. Graphical Presentation of Thickness of Ice Layer on Electric Wiring Indicator
It is common that the weather storm with snow is accompanied with the formation of icy layer on the power wiring. This leads to the overweighting of the wiring system. It is usually noticed that the wiring prolongation is visible as the deflection from the primary wiring. The wiring disruption is often notified as the result of snow overweight.
It is appropriate to use as the indicator for thickness of ice layer on electric power wiring the wire prolongation. At the time t0 wire prolongation start and at the time at the time t1 it ends, following wire recovery t0 time t2. Figure 4 shows resilience index change in time scale.
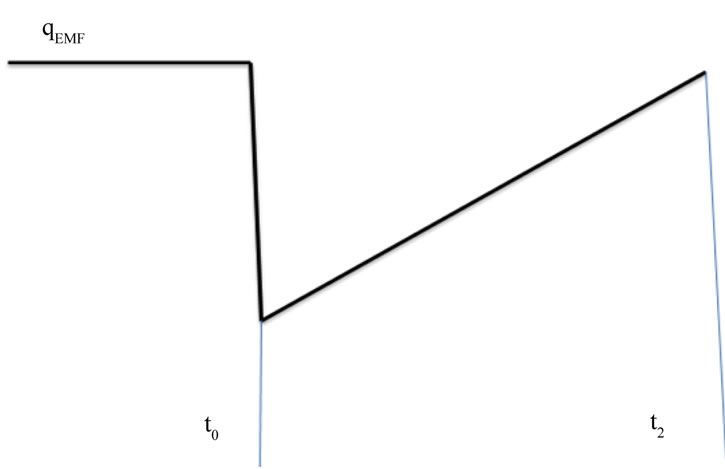
Figure 3. Graphical presentation of the electro-magnetic flux indicator. Where qEMF—electro-magnetic flux indicator; t0—time of sudden change; t2—recovery time for sudden change.
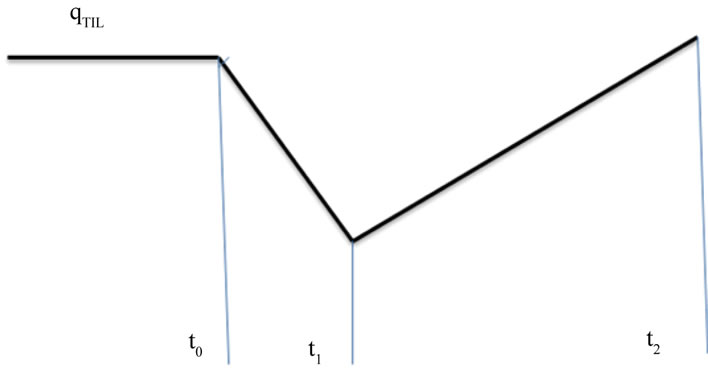
Figure 4. Graphical presentation of the thickness of icy layer indicator. Where qTIL—thickness of icy layer indicator; t0—start time of voltage change; t1—end of voltage change; t2—recovery time for voltage change.
5.3. Graphic Presentation of Power Consumption Indicator
The power consumption indicator is a measuring parameter of the amount of energy. It reflects the potential change of the electric power consumption. The change of this indicator gives us possibility to determine the resilience index of the power consumption. It is anticipated that the power consumption change start at time t0 and ends at t1. It will be recovered at the time t3 as shown in Figure 5.
5.4. Graphical Presentation of Public Awareness of the Potential Blackout Indicator
The social indicator for the resilience index to be used for the public awareness assessment is the public awareness of the potential blackout. It is assumed that at the time t0 starts the change of the indicator while it ends at time t6. It will be recovered at time t7. The resilience index for the public awareness of the potential blackout is shown on Figure 6, while graphical presentation of the resilience index for power transmission system can be seen on Figure 7.
6. Catastrophe Event Assessment with Resilience Index
The capacity of the system to withstand catastrophe event is measured with the resilience index of the system. If the system is subject to the respective change of indicators, the resilience index is the measuring parameter for the assessment of the potential catastrophe of the system.
The impact of GMDs on the grid, Figure 8, is aptly described by the North American Electric Reliability Corporation (NERC) as a “high impact, low frequency” event. The “high impact” term is relevant because a significant GMD impacts on a very large area (that is, a band of potential impact around the earth) and can thus impact a large population of utility devices simultane-
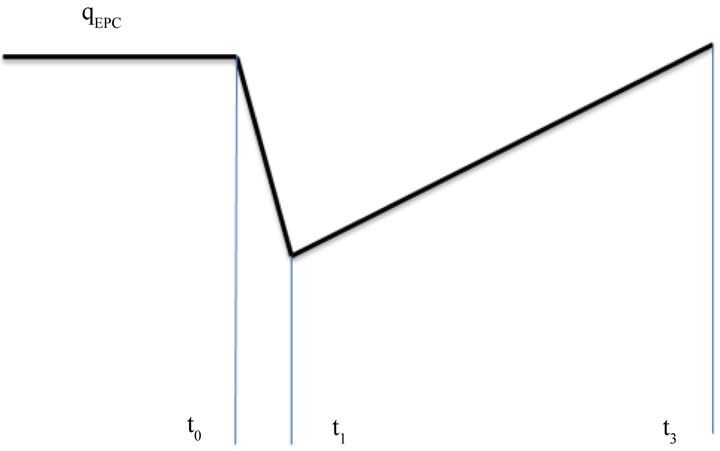
Figure 5. Graphical presentation of the electric power consumption indicator. Where qEPC—Electric power consumption indicator; t0—start time of voltage change; t1—end of voltage change; t3—recovery time for voltage change.
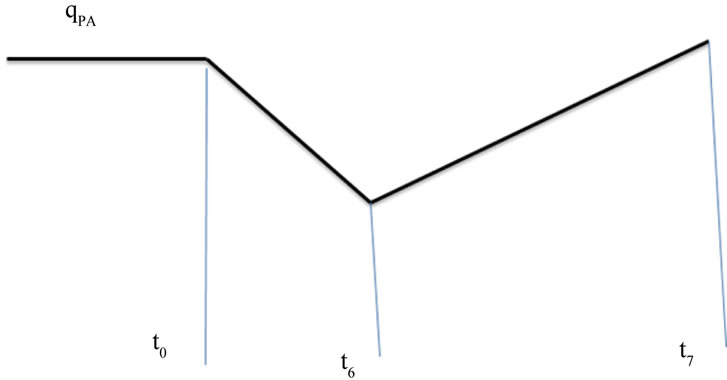
Figure 6. Graphical presentation of the public awareness indicator. Where qPA—public awareness indicator; t0—start time of indicator change; t6—end of indicator change; t7— recovery time indicator change.
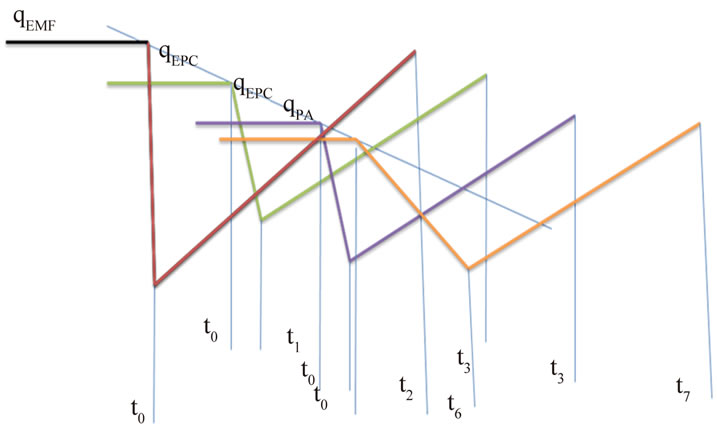
Figure 7. Graphical presentation of the resilience index for power transmission system.
ously. The “low frequency” term is relevant because large GMD events are much less frequent when compared to other utility impacts, such as terrestrial storms. Any utility response to GMDs should thus be taken in the context of both the impact and the probability. An important research goal is thus to develop a risk assessment and mitigation methodology for GMDs which provides a balanced and systematic approach to forecast GMDs, cost-effective hardening of critical assets and quick system restoration.
7. Agglomeration of the Resilience Index
The total residence index for the evaluation of power transmission systems is a linear function of the resilience indicators for the change of individual indicators.
The critical resilience index for the power system is defined the limiting value for resilience index before the catastrophe event will occur. It means that

It is of special interest, in the evaluation of the catastrophe events, to specify the contribution of the individual resilience index to validate the contribution of the specific resilience indexes. In this respect, it is of special interested value to justify the contribution of the specific resilience index to the agglomerated value of the resilience index.
In the evaluation of the catastrophe of the power transmission system, the most important parameter to be taken into a consideration is the resilience index of electro-magnetic floury. In particular, it has been taken into a consideration, its effect on the different fields of human interest.
8. Solar Flare Effect on the Power Transmission System
Warning events in 1859, 1921, 1989, and 2003 showed the danger that solar activity can pose to power and distribution systems. Now as we move into another solar maximum, with increased vulnerabilities built into our electrical grid, the danger again looms large.
The greatest danger is to the high-voltage transformers located at power substations along the routes of major transmission lines. An eruptive event on the Sun, known as a coronal mass ejection, sends a powerful flux of charged particles, protons and electrons, into the surrounding space. If the Earth is on a line with the eruption, the charged particles interact with the Earth’s radiation belts and geomagnetic field to produce currents in the ionosphere. The power lines which make up the electrical transmission grid act as antennae, to couple these ionospheric currents to the installed transformers which step up the voltage for long-distance transmission.
The ionospheric or auroral currents produced by a powerful solar storm induce strong fluctuating direct currents in the power lines. Known as geomagnetically induced currents (GIC), when they reach the transformers, they piggyback on to the strong alternating current already flowing and cause the iron cores of the transformers to saturate and overheat from hysteresis and reactive resonance effects in the transmission line. This can
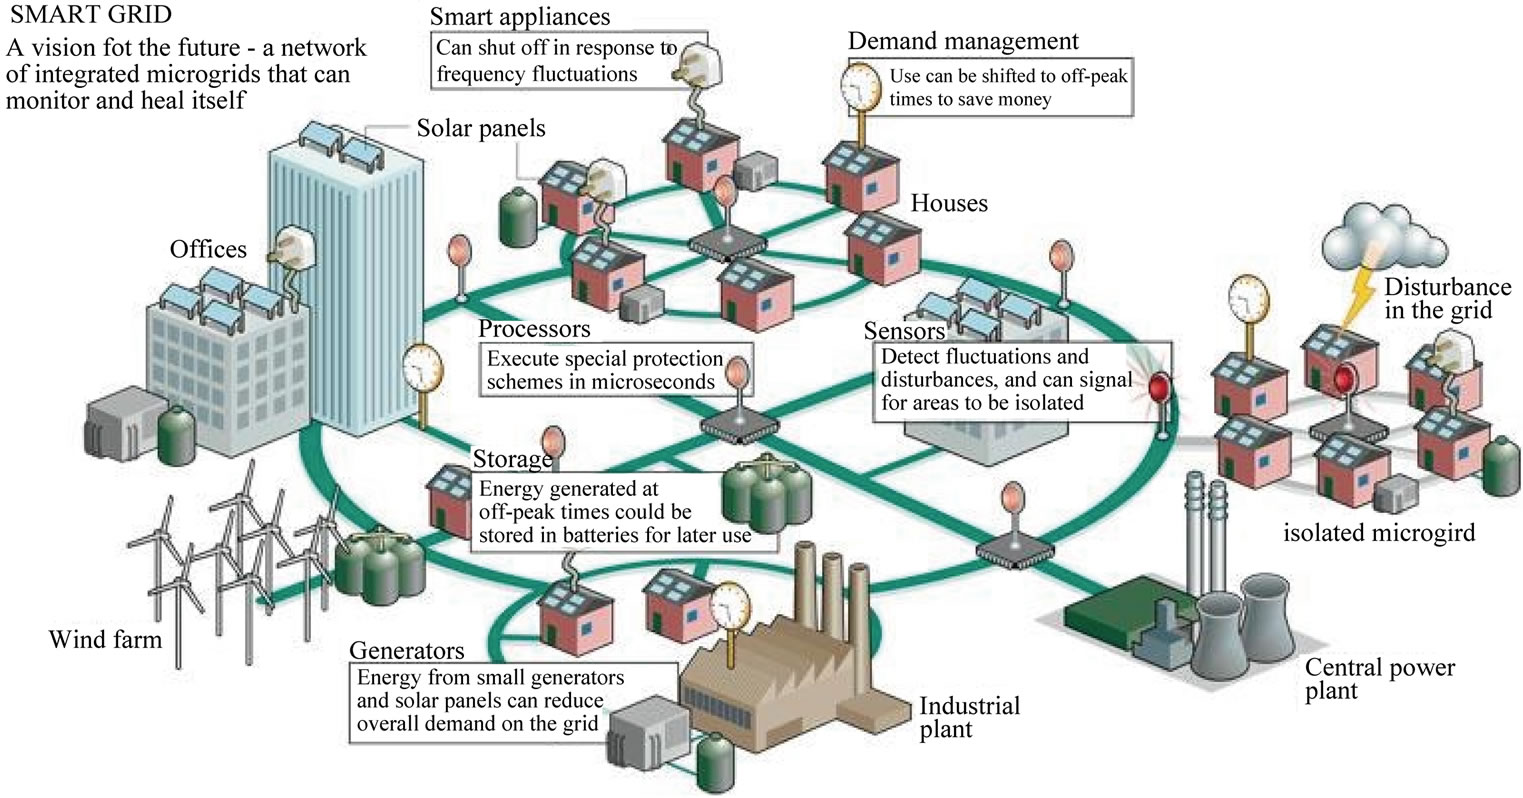
Figure 8. Smart grid.
cause network-wide voltage regulation problems leading to blackouts, or complete transformer burnout.
Because the solar storm threat is greatest to the lowresistance power lines carrying the highest current densities, some of the most vulnerable areas are those of highest population concentration. Metatech estimates that more than 130 million people in the USA are at high risk for such an event. The highest risk areas are the northern states from the Atlantic seaboard to the Mississippi, coastal states as far south as Georgia, and the northwestern states of Washington, Oregon, and Idaho.
A prolonged lack of electricity in any of these areas would reduce the population to dark age-like conditions. Drinking water supply would break down for lack of pumping, and sewage service would cease shortly thereafter. For lack of refrigeration, the food chain would collapse, and medical supplies would be lost. Fuel could not be pumped, and thus transportation would break down. Heating and air conditioning systems would cease functioning. Communication would be crippled by the lack of electricity as well as from the direct damage to satellites and sensitive electronics which a solar storm produces— perhaps no Internet and no cell phones.
9. Conclusions
With the appropriate selection of indicators and formation of the respective resilience indexes, it is possible to verify the mail functions of the electricity transmission system. In this respect the verification of potential hazard events is imminent for the prevention of catastrophe event.
The electricity transmission system catastrophe is strongly linked with the respective change of the resilience indexes of the system. The agglomeration of resilience indexes of the sudden change of indicators is parameter which can be used for the determination of critical resilience index for the catastrophe event.
In this exercise four resilience indexes are used for the verification of critical resilience index determining the catastrophic event for the electricity transmission system. In particular, attention is focused on the solar flare effect on the power transmission system. In the evaluation of catastrophe of the power transmission system, the most important parameter to be taken into a consideration is resilience index of electro-magnetic floury.
10. Acknowledgements
This paper publishing is partly supported by Ministry of Education and Science of Republic of Serbia (III42010 and TR33050).
REFERENCES
- S. Rahman, “Development of the Smart Grid the Challenges and Best Practices,” 2013. http://www.ari.vt.edu/publications/development-of-the-smart-grid-the-challenges-and-best-practices
- M. Einhorn and R. Siddiqi, “Electricity Transmission Pricing and Technology,” Kluwer Academic Publishers, Berlin, 1996.
- R. T. Tabors, “Lessons from the UK and Norway,” IEEE Spectrum, Vol. 33, No. 8, 1996, pp. 45-49. http://dx.doi.org/10.1109/6.511740
- H. Rudnick, “Pioneering Electricity Reform in South America,” IEEE Spectrum, Vol. 33, No. 8, 1996, pp. 38- 44. http://dx.doi.org/10.1109/6.511739
- M. Ilic, F. Galiana and L. Fink, “Power Systems Restructuring: Engineering and Economics,” Kluwer Academic Publishers, Berlin, 1998. http://dx.doi.org/10.1007/978-1-4757-2883-5
- L. Milli, Q. Qui and A. G. Phadke, “Risk Assessment of Catastrophic Failure in Electric Power System,” International Journal of Critical Infrastructures, Vol. 1, No. 1, 2004, pp. 38-63.
- M. Amin, “Toward Self-Healing Infrastructure Systems,” IEEE Computer Magazine, Vol. 33, No. 8, 2000, pp. 44- 53.
- J. Hauer and J. E. Dagle, “Consortium for Electric Reliability Technology Solutions Grid of the Future White Paper on Review of Recent Reliability Issues and system Events,” Office of Power Technologies, Assistant Secretary for Energy Efficiency and Renewable Energy, US Department of Energy, Washington DC, 1999.
- H. G. Stoll, “Leat-Cost Electric Utility Planning,” John Wiley, Hoboken, 1989.
- NERC Disturbance Reports, “North American Electric Reliability Council, New Jersey, 1984-1988,” 2013. http://www.nerc.com/pa/CI/CIPOutreach/Pages/Reports.aspx
- J. S. Thorp, A. G. Phadke, S. H. Horowitz and S. Tamronglak, “Anatomy of Power System Disturbances: Importance Sampling,” Electrical Power & Energy Systems, Vol. 20, No. 2, 1998, pp. 147-152. http://dx.doi.org/10.1016/S0142-0615(97)00034-3
- J. S. Thorp and A. G. Phadke, “Protecting Power Systems in the Post-Restructuring Era,” IEEE Computer Applications in Power, Vol. 12, No. 1, 1999, pp. 33-37. http://dx.doi.org/10.1109/67.738316
- J. Baran, “Statistics for Long-Memory Processes,” Chapmann & Hall, London, 1994.
- Board of Review, “First Phase Report: System Blackout and System Restoration,” ConEdison, New York, 1997.
- Board of Review, “Second Phase Report: System Blackout and System Restoration,” ConEdison, New York, 1997.
- G. L. Wilson and P. Zarakas, “Anatomy of a Blackout,” IEEE Spectrum, Vol. 15, No. 2, 1978, pp. 39-49. http://dx.doi.org/10.1109/MSPEC.1978.6369414
- N. Afgan and D. Cvetinovic, “Resilience of High Voltage Transmission System, Energy and Power Engineering,” 2011. http://www.SciRP.org/journal/epe
- N. Afgan and M. G. Carvalho, “Quality, Sustainability and Indicators, Energy System,” Begell House Publisher, New York, 2008.
- N. Afgan, “Sustainable Resilience of Energy Systems,” Nova Publisher, New York, 2010.
- N. Afgan and D. Cvetinovic, “Wind Power Plant Resilience,” Thermal Science, Vol. 14, No. 2, 2010, pp. 533- 540. http://dx.doi.org/10.2298/TSCI1002533A
NOTES
*Corresponding author.