Green and Sustainable Chemistry
Vol.4 No.1(2014), Article ID:42852,8 pages DOI:10.4236/gsc.2014.41002
Parametric Response Evaluation for Xanthosoma spp. Induced Coag-Flocculation of Brewery Effluent
1Chemical Engineering Department, Michael Okpara University of Agriculture, Umudike, Nigeria
2Chemical Engineering Department, Nnamdi Azikiwe University, Awka, Nigeria
Email: *cmenkiti@yahoo.com
Copyright (c) 2014 Bernard Ibezimako Okolo et al. This is an open access article distributed under the Creative Commons Attribution License, which permits unrestricted use, distribution, and reproduction in any medium, provided the original work is properly cited. In accordance of the Creative Commons Attribution License all Copyrights (c) 2014 are reserved for SCIRP and the owner of the intellectual property Bernard Ibezimako Okolo et al. All Copyright (c) 2014 are guarded by law and by SCIRP as a guardian.
Received January 3, 2014; revised February 3, 2014; accepted February 10, 2014
Keywords: Cocoyam; Brewery Effluent; Coag-Flocculation; Xanthosoma spp.; Perikinetic
ABSTRACT
This paper presents the kinetic and functional parametric behavior of cocoyam coagulant (CYC) in respect of pH and time variation in brewery effluent at room temperature. The study employed standard nephelometric jar test while CYC production was based on method reported by Ndabigengesere. Coag-flocculation parameter such as order of reaction α, rate constant K, coagulation period, τ1/2 etc. were determined. Maximum parameter values are recorded at K of 6 × 10⁻¹ L/mgomin; dosage of 200 mg/L, pH 8 and τ1/2 of 0.00146 min while the minimum values are recorded at 3 × 10⁻⁷ L/mg, dosage of 100 mg/L, pH 10 and τ1/2 of 20.4 min. The maximum coag-floc- culation efficiency E (%) obtained was 92.28, thus establishing CYC as a potential effective coag-flocculaant.
1. Introduction
With increased industrial growth and urbanization, the volume of domestic and industrial effluent is in the increase. In developed nations, these wastes are disposed off in accordance with regulatory standard. However, in some developing nations, there is no strict compliance to the laws governing the disposal of these wastes.
Globally, lager beer production has been on the increase with accompanied large wastewater generation. The effluent from brewery contains suspended solid in the range of 1000 - 1500 mg/L, COD in the range of 1800 - 3000 mg/L and nitrogen in the range of 30 - 100 mg/L [1]. Brewery effluent is of great environmental concern due to its potential harm to public health and the environment.
The treatment methods of wastewater include: activated carbon adsorption, oxidation, chemical coagulation/flocculation, electro-chemical methods, using various electrodes and electrolytes, nano-flitration and different combinations of these methods [2-4 ].
Coagulation/flocculation is a commonly used process in water and wastewater treatment in which compounds such as alum, ferric chloride and/or polymer are added to wastewater in order to destabilize the colloidal materials and hence cause the small particles to agglomerate into large settle able flocs. Several studies have reported the application of this process for the treatment of industrial wastewater produced from textile, dye and beverages industries using inorganic chemicals [5,6]. While the effectiveness of these chemical as coagulant is well-recognized, there are nonetheless disadvantages associated with usage of these coagulants. These include ineffectiveness in low-temperature water, relatively high procurement costs, detrimental effects on human health, production of large sludge volumes and the fact that they significantly affect the pH of treated water. It is therefore desirable to replace these chemical coagulants with plants and animal based coagulant to minimize the challenges [7,8].
A part of possible solution to these problems might be the development of new bio coagulants which are eco/ health friendly. In recent years, there has been intense interest in the application of plant based coagulants [9,10].
In this work, therefore, the potentials of cocoyam (Xanthosoma) tuber as a coagulant for the removal of particles from brewery effluent had been studied. According to Enwere [11], the flour of cocoyam is used traditionally as soup thickener. From the composition of cocoyam, shown in Table 1, it is of view that this property could be extended to coagulation process.
The purpose of this work is, therefore, to study the coagulation/flocculation behavior of cocoyam in brewery effluent, for the removal of both total suspended and dissolved particles. Also, it studied the effects of variation of dosage, settling time, pH etc., during coagulation.
2. Theoretical Principles
The Kinetics of Brownian coagulation can be descried by [12-14]:
 (1)
(1)
where Kij is a second order coagulation rate constant, t is the time, and Nn is the total particle concentration of n-fold clusters.
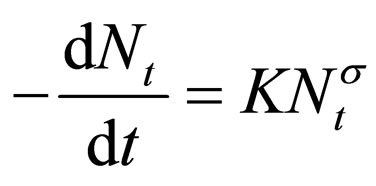
However, for the kinetic of Brownian coagulation of mono-dispersed particles at the early stage is describe generally by [12,14,15]:
 (2)
(2)
where K = coagulation rate constant; α = order of coagulation reaction; Nt = concentration of the particles (TDSP) at time t.
Linear form of Equation (2) gives
 (3)
(3)
From Equation (3),  and K could be determined.
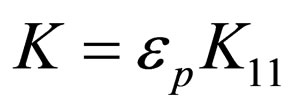
This rate constant K is a product of collision efficiency εp, and the Smoluchowski rate constant for rapid coagulation K11
 (4)
(4)
where εp = collision efficiency K11 = Von Smoluchowski rate constant for rapid coagulation [12].
But Smoluchowski rate constant for rapid coagulation is given by
 (5)
(5)
 (6)
(6)
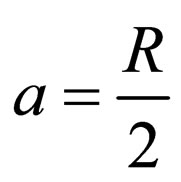
where a = particle radius; D1 = particle diffusion coefficient
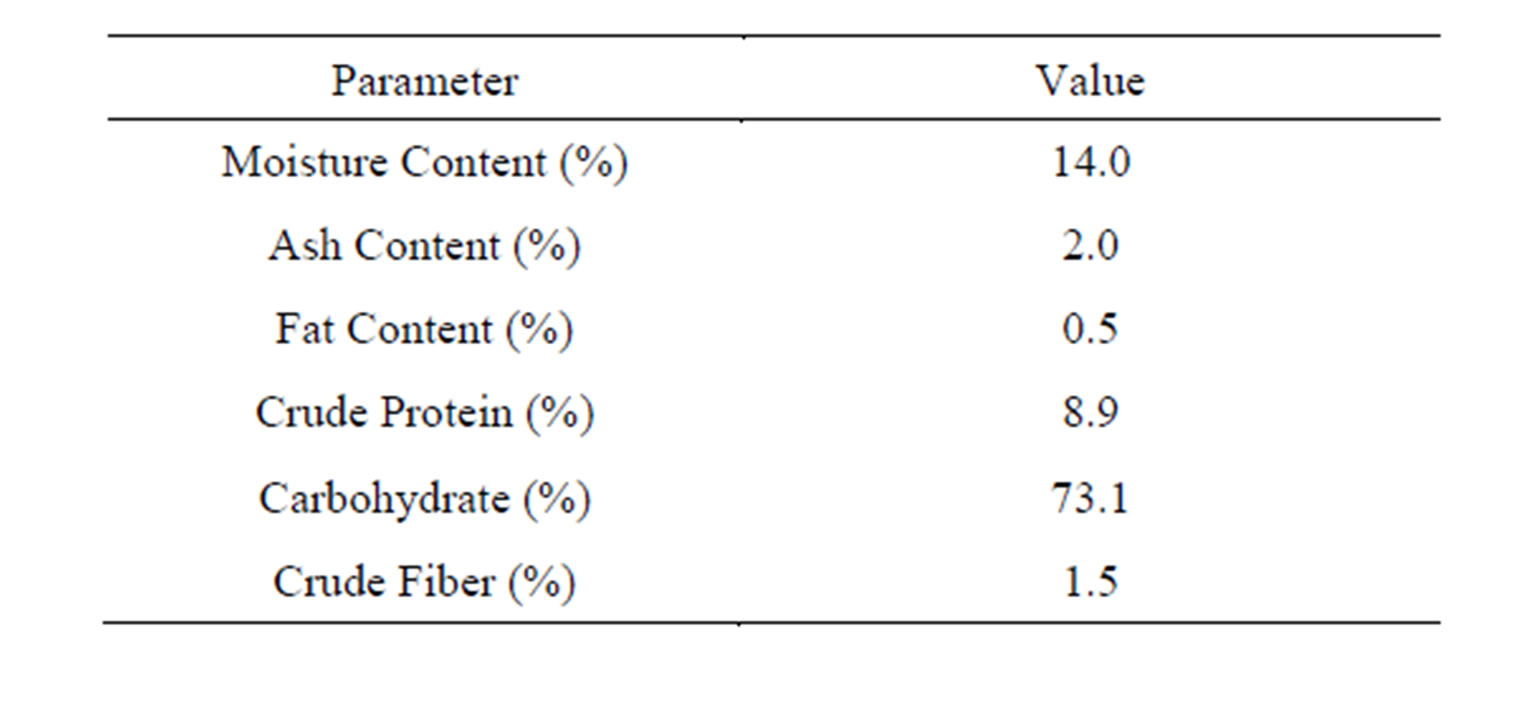
Table 1. Characteristics of cocoyam (CYC precursor).
From Einstein’s Equation
 (7)
(7)
From Stokes relation,
 (8)
(8)
 (9)
(9)
where KB = Boltzman’s constant (molar gas constant per particle); B = friction factor

T = absolute temperature (K)
Putting Equation (9) into (8) yields
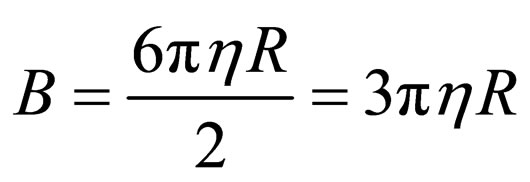 (10)
(10)
Also, putting Equation (10) into (7)
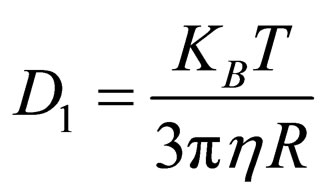 (11)
(11)
Putting Equation (11) into (5), produces
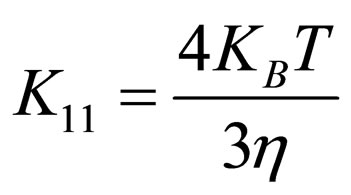 (12)
(12)
Also, putting (12) into (4), yields
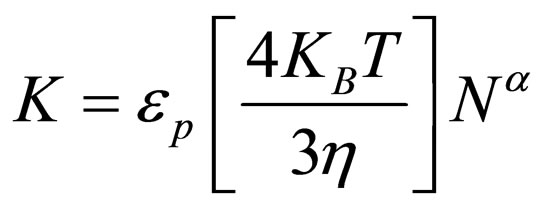 (13)
(13)
Hence substituting (13) into (2)
 (14)
(14)
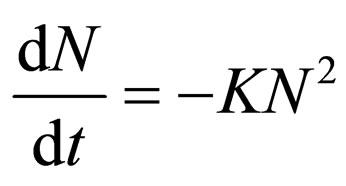
WST [16] and Menkiti [15] reported that in real practice, 1 ≤ α ≤ 2. Based on this, what is required to evaluate K is to determine the line of better fit between α = 1 and 2, while the experimental data are fitted into linearized form of Equation (2).
For α = 2, Equation (2) yields
 (15)
(15)
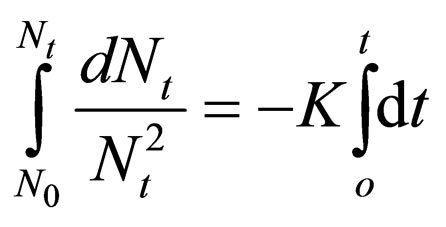
Hence:
 (16)
(16)
 (17)
(17)
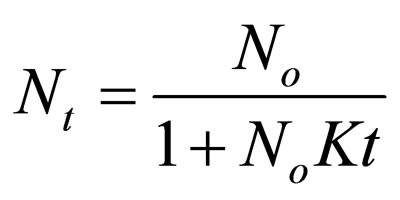
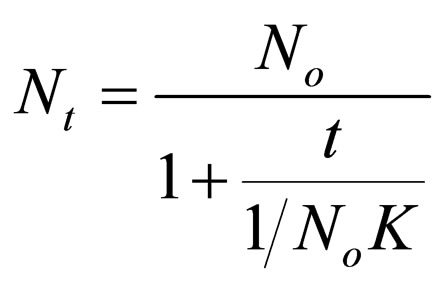
Making Nt the subject.
 (18)
(18)
 (19)
(19)
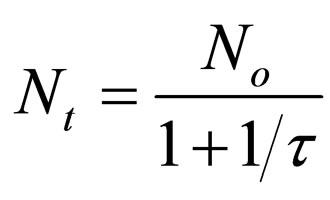
Let
 (20)
(20)
Hence
 (21)
(21)
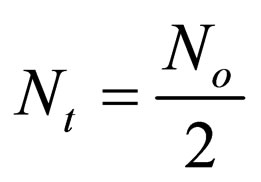
when t = τ, Equation (21) becomes
 (22)
(22)
Therefore as 
Hence
 (23)
(23)
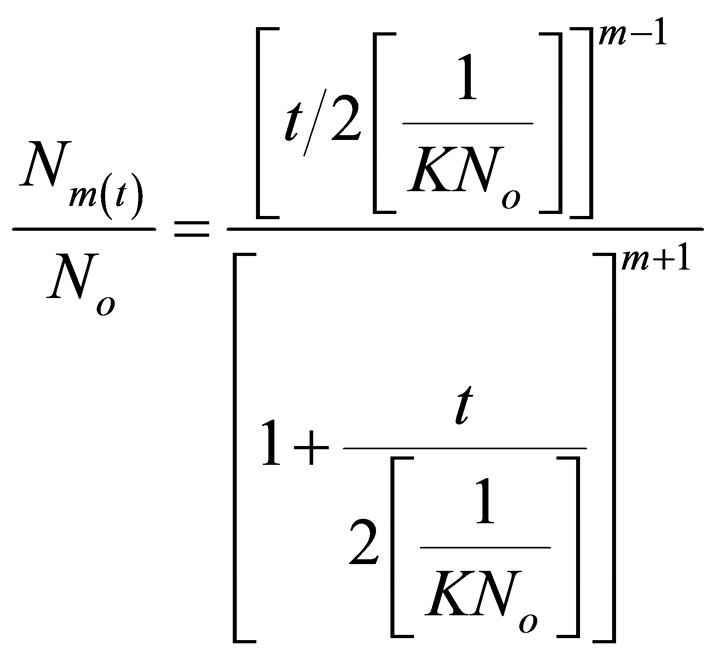
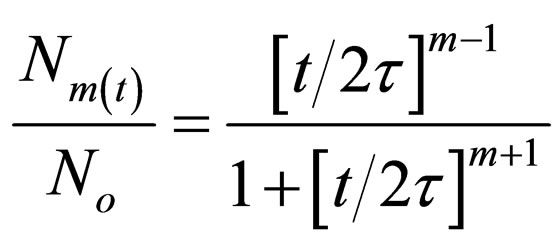
For Brownian aggregation at early stages (≤30 minutes), Equation (1) can be solved exactly, resulting in the expression [17,18].
 (24)
(24)
where 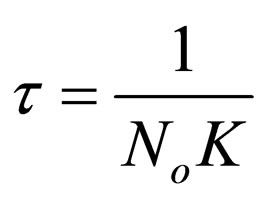
Therefore
 (25)
(25)
 (26)
(26)
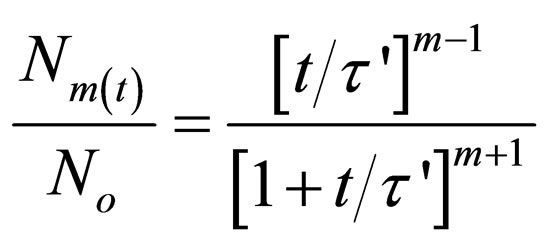
Substitute Equation (26) in (25), gives
 (27)
(27)
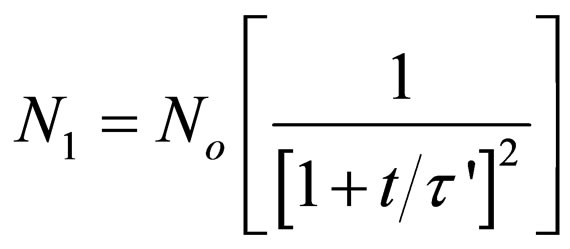
Equation (27) gives a generic expression for particle of m-order.
HenceFor Singlets (m = 1)
 (28)
(28)
For doublets (m = 2)
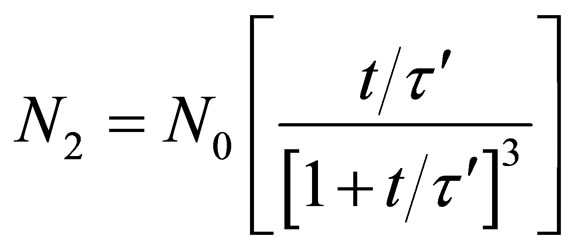 (29)
(29)
For triplets (m = 3)
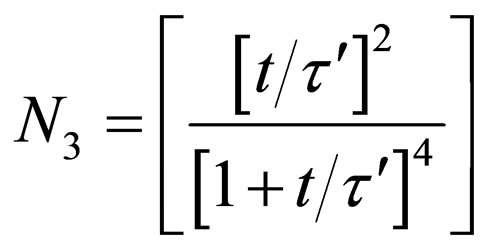 (30)
(30)
Turbidity (NTU) can be converted to TSS (mg/L) using Equation (31) [19].
 (31)
(31)
where T = Turbidity (NTU); (TSSf) = Conversion factor to TSS.
Evaluation of coagulation-flocculation efficiency is given as
 (32)
(32)
3. Materials and Methods
3.1. Wastewater Sampling
The brewery effluent collected from brewery plant located in Enugu, were characterized and the analyses are given in Table 2. The samples were stored in black plastic container to avoid photo reaction
3.2. Preparation of Stock Solution of Natural Coagulant
The cocoyam (Xanthosoma spp.) used in this work was purchased from Ogbette Market, Enugu State Nigeria and stored at room temperature. The cocoyam was peeled, washed and sliced into chips. The chips were sun dried enough to break sharply between hands. The chips were ground to powder of approximately 600 µm using a kitchen blender to ensure solubilization of active ingredients in the tuber. The characteristics of the sample on the bases of AOAC [20] standard method are presented in Table 1.
2% suspension (2 g of powdered cocoyam in 100 mL tap water) of the powder was prepared and vigorously shaken for 30 min using magnetic stirrer (APP No 688644A Gulenhamp) to promote water extraction of the coagulating agent. The suspension was filtered using Whatman No 1 filter paper. The filtered solution (stock solution) was termed CYC. Fresh solution was prepared daily and kept refrigerated to prevent any ageing effects
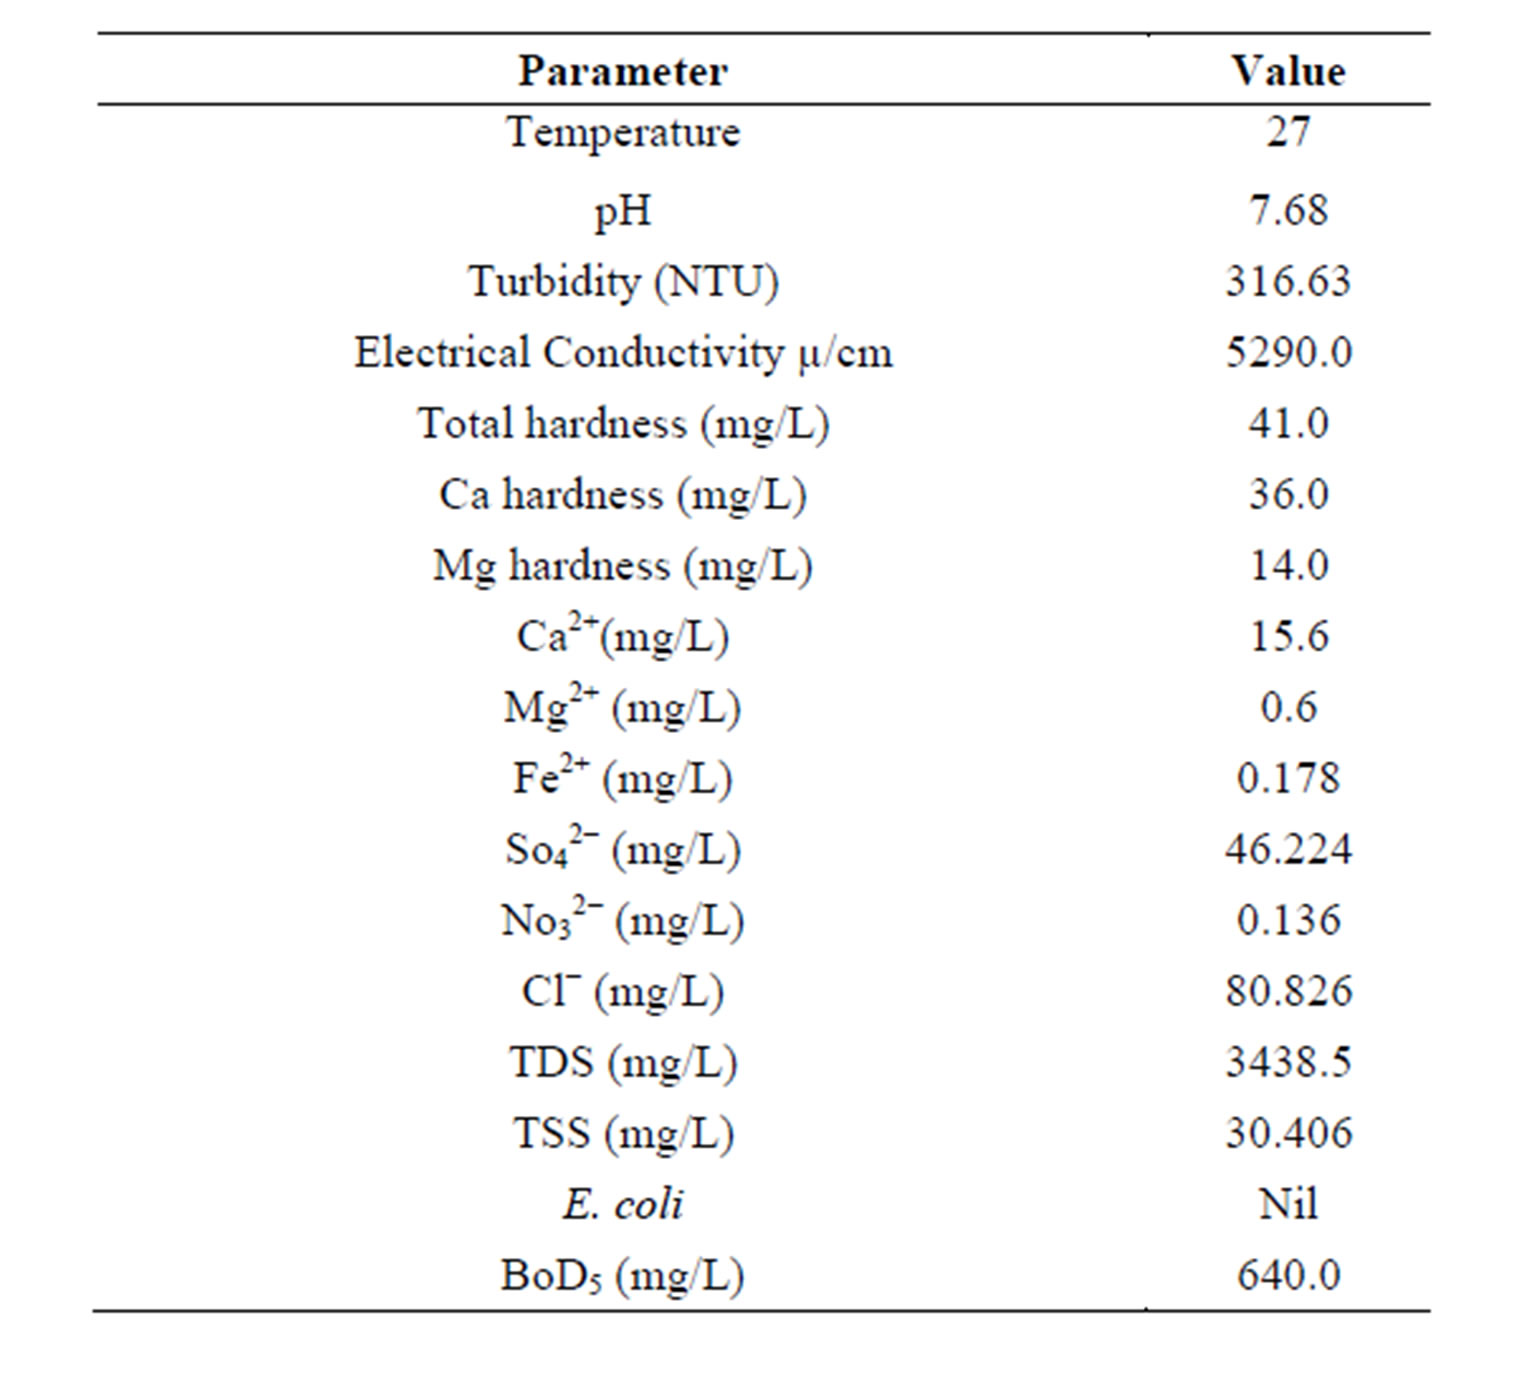
Table 2. Characteristics of brewery effluent.
(such as change in pH, viscosity and coagulation activity). CYC was shaken vigorously before use.
A conventional jar test apparatus was used in this experiment. 100 - 500 mg/L range of CYC dosage was prepared in a standard 1000 mL beaker containing 300 mL of the effluent. The suspension, tuned to pH range 2 - 10 by addition of 0.1 M H2SO4/0.1 M NaOH was subjected to 2 min of rapid mixing (200 rpm), 20 min of slow mixing (30 rpm) using a magnetic stirrer. After agitation, the suspension was transferred into a 250 mL cylinder of height, 34 cm, diameter, 4 cm and the suspension height, 29 cm. During settling, 10 mL of the supernatant was withdrawn from 2 cm depth and changes in TDSP (mg/L) measured for kinetic analysis (using WZS-185 MC Turbidimeter) at various intervals of 3, 5, 10, 15, 20, 25 and 30 min. The procedure was carried out at room temperature. The data obtained were subsequently fitted to appropriate kinetic models.
4. Results and Discussion
4.1. Kinetic Analyses
The Kinetic analyses were performed for a sample of Brewery effluent (BRE) with an initial TDSP of 728.249 mg/L. The CYC dosage used was in the range of 100 - 500 mg/l and pH was 2 - 10. From Table 2, the pH of the Brewery effluent was 7.68 indicating that the effluent was slightly alkaline. The high value for turbidity, TDS and TSS shows that the effluent has high pollution potentials and as a result, treatment is required before discharged to the environment. Table 1 also indicates that quantity of polysaccharides or proteins available in the powder shows the potential of the CYC to be applied to water treatment. Similar result has been obtained [11]. The results obtained from the analyses were evaluated as the coag-flocculation functional parameters which are presented in Tables 3-7.
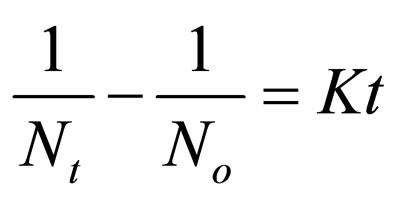
Solving Equation (15), by integration method (taking α = 2), yields 17, from which K could be determined from slope of (1/N) Vs t plot. Representative plots of (1/N) vs t is depicted in Figure 1.
Linear regression coefficient (R2) was employed in evaluation of the accuracy of fit of the experimental data on the main model expressed as Equation (17). For all cases of dosages and pH, the value of α is 2. With the exception of few, the corresponding value of R2 is generally >0.9. The high values of R2 indicate a high measure of agreement that the reaction follows a second order kinetic model. This means that the rate of reaction is proportional to (N2) and K as described by Equation (15). The highest value of K of 6 × 10⁻¹ L/mg·min is recorded at pH 8, and 200mg/L CYC. The least K of 3 × 10⁻⁷ L/mg·min is recorded at pH 10, and 100 mg/L. Observation from the results shows that coagulation/flocculation with low dosage is more favored in alkaline medium.
τ1/2 indicates the time taken for the initial concentration of TDSP to reduce by half, and is evaluated from Equation (23). In this study, it is observed that lowest τ1/2 (0.00416min) is recorded at K 6 × 10⁻¹ L/mg·min. From Equation 23, τ1/2 is a function of initial TDSP (No) concentration and rate constant K. From Equation (23), the higher the No, the lesser the τ1/2. This explains the prevalent high rate of settling in high turbidity water. εp, which is particle collision efficiency relates proportionally to the kinetic energy acquired by the colliding particles. It has been reported that by Hunter [14] that low period is necessary for efficient system.
4.2. Variation of Coag-Flocculation Efficiency as a Function of Time, pH and Dosage
The variation of coag-flocculation efficiency of CYC with time, pH and dosage is obtained based on the evaluation of Equation (32). The plots of the results presented in Figures 2-6, are obtained at 100, 200, 300, 400 and 500 mg/L CYC for pH 2, 4, 6, 8, 10. The general observable coag-flocculation behavior shows that efficiency increases with time, but the magnitude varies for different pH and dosage. The efficiency at 3 min was generally between 36% and 61.5% at pH 2 and 4, respectively. At end of 30 min of coag-flocculation, the efficiency removal reached 70% to 92.28% for pH 2 and 4, respectively. But the best performance was achieved at pH4 of 100 mg/L and at pH 2 of 500 mg/L dosage at 88.64% and 92.28%, respectively. The high level performance for these biomaterials are in line with previous results [7,13,18].
4.3. Microscopic Particle Distribution Behavior
The particle distribution plots are obtained based on the

Table 3. Coag-flocculation kinetic parameter of CYC in BRE at varying pH and 100 mg/L dosage.

Table 4. Coag-flocculation kinetic parameter of CYC in BRE at varying pH and 200 mg/L.

Table 5. Coag-flocculation kinetic parameter of CYC in BRE at varying pH and 300 mg/L.

Table 6. Coag-flocculation kinetic parameter of CYC in BRE at varying pH and 400 mg/L.

Table 7. Coag-flocculation kinetic parameter of CYC in BRE at varying pH and 500 mg/L.
evaluation of Equations (28) - (30). The microscopic particles aggregation behavior were evaluated and presented in Figures 7 and 8. From the graphical illustration, it shows that the number of total particles m, singlets, doublets and triplets decreased as a function of time.
Minimum τ1/2 value was recorded at 0.00416 min, corresponding to the period of rapid coagulation, which indicated that there are greater forces of attraction than
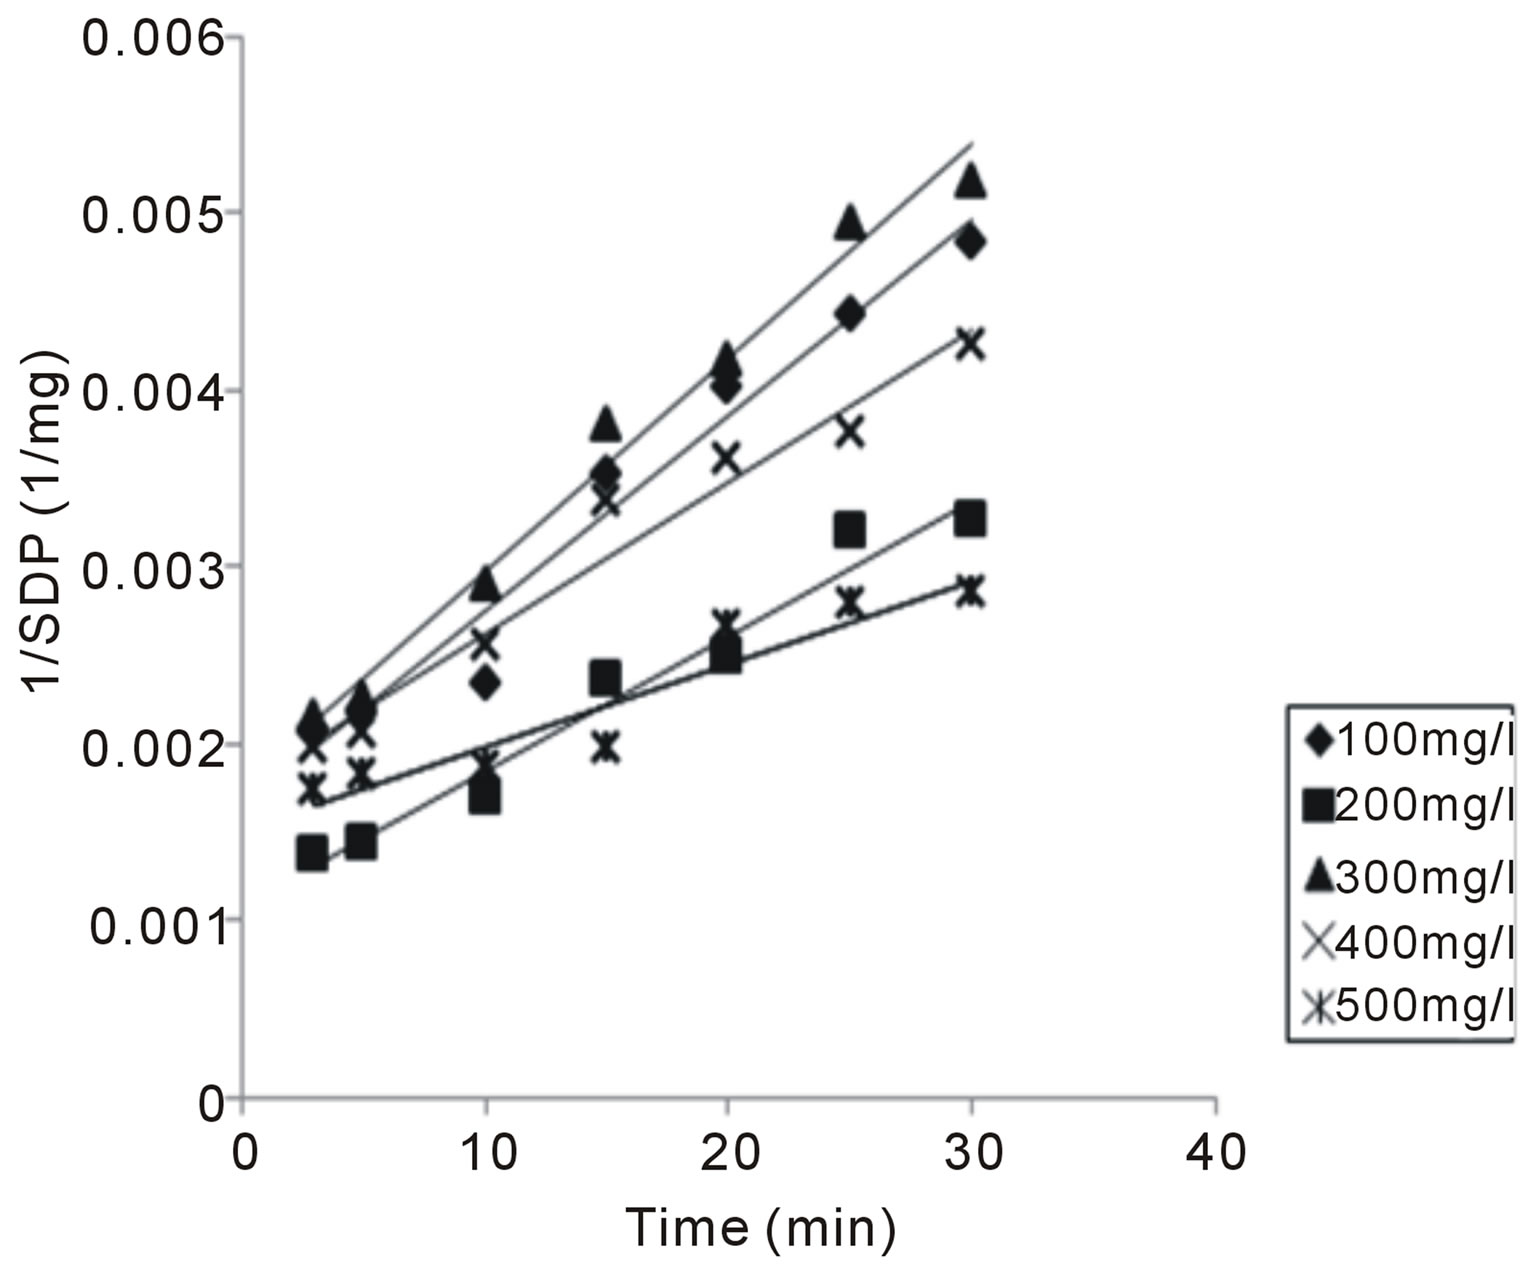
Figure 1. Representative plot of 1/SDP as a function of time for 100 mg/L CYC.
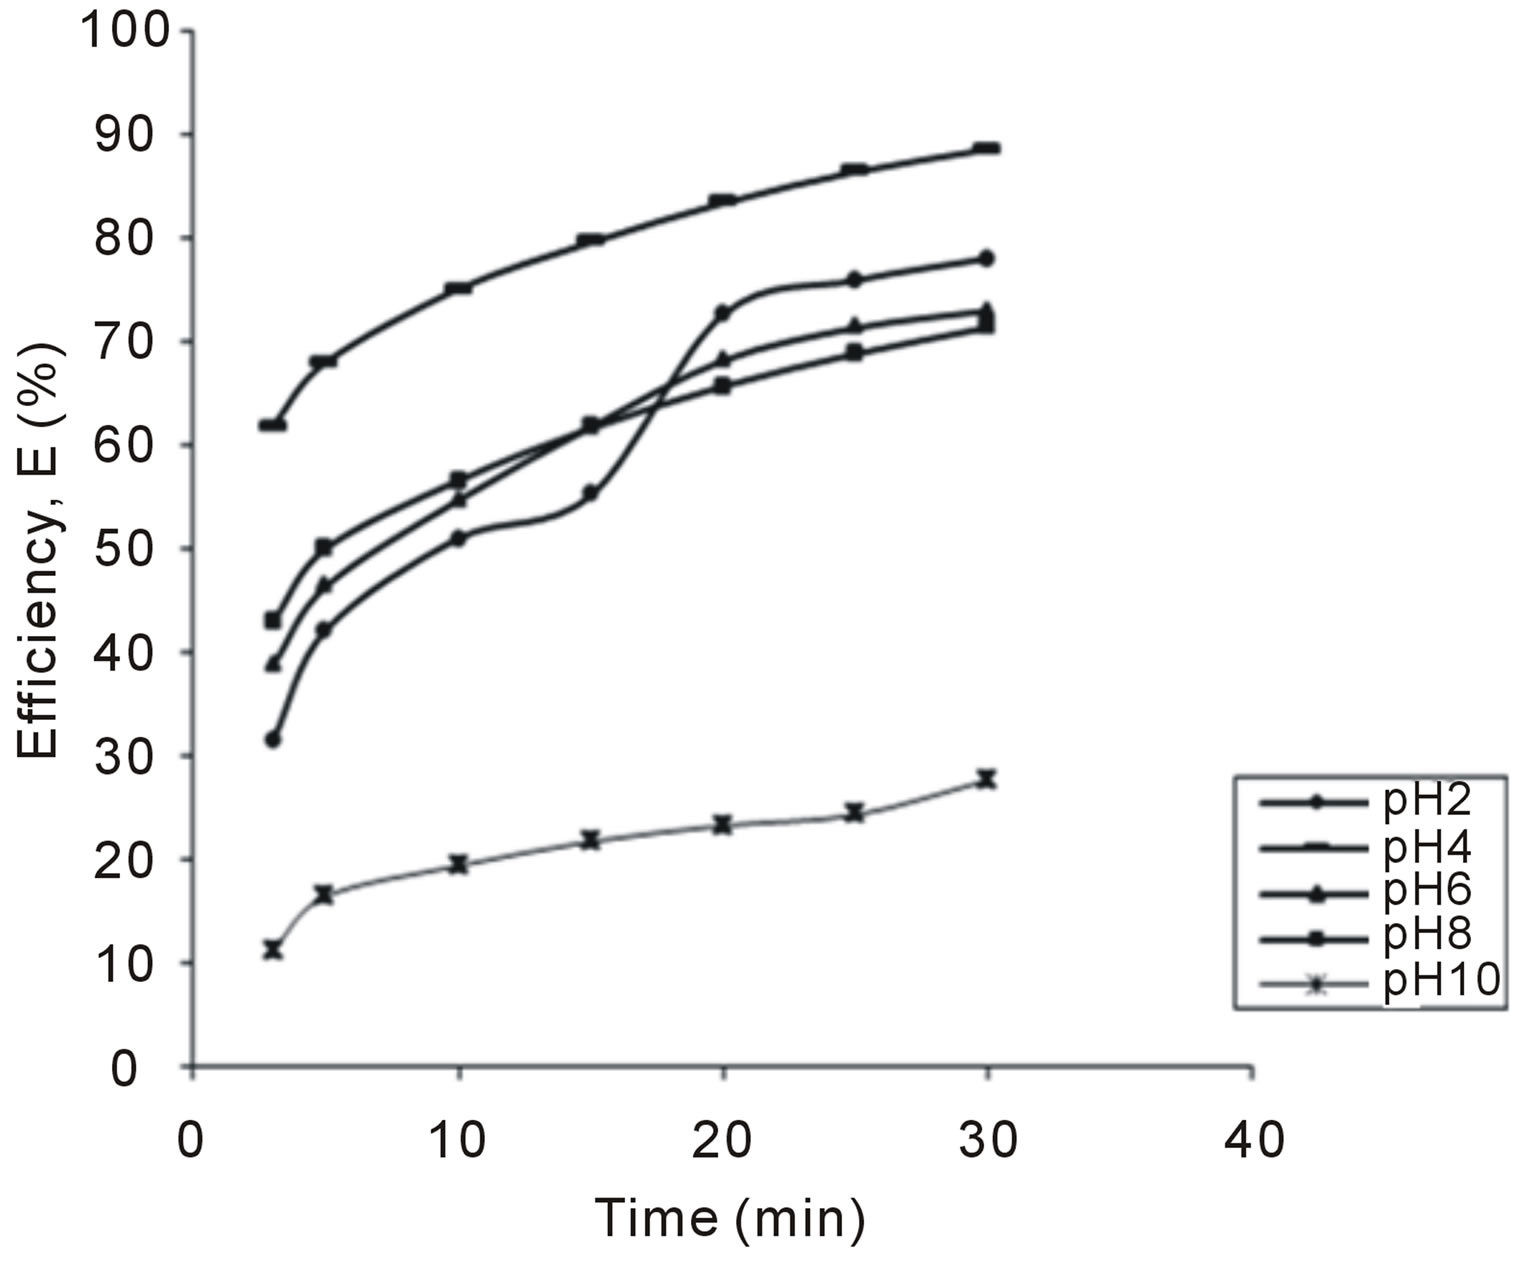
Figure 2. Selected plot of E (%) vs time for 100 mg/L.
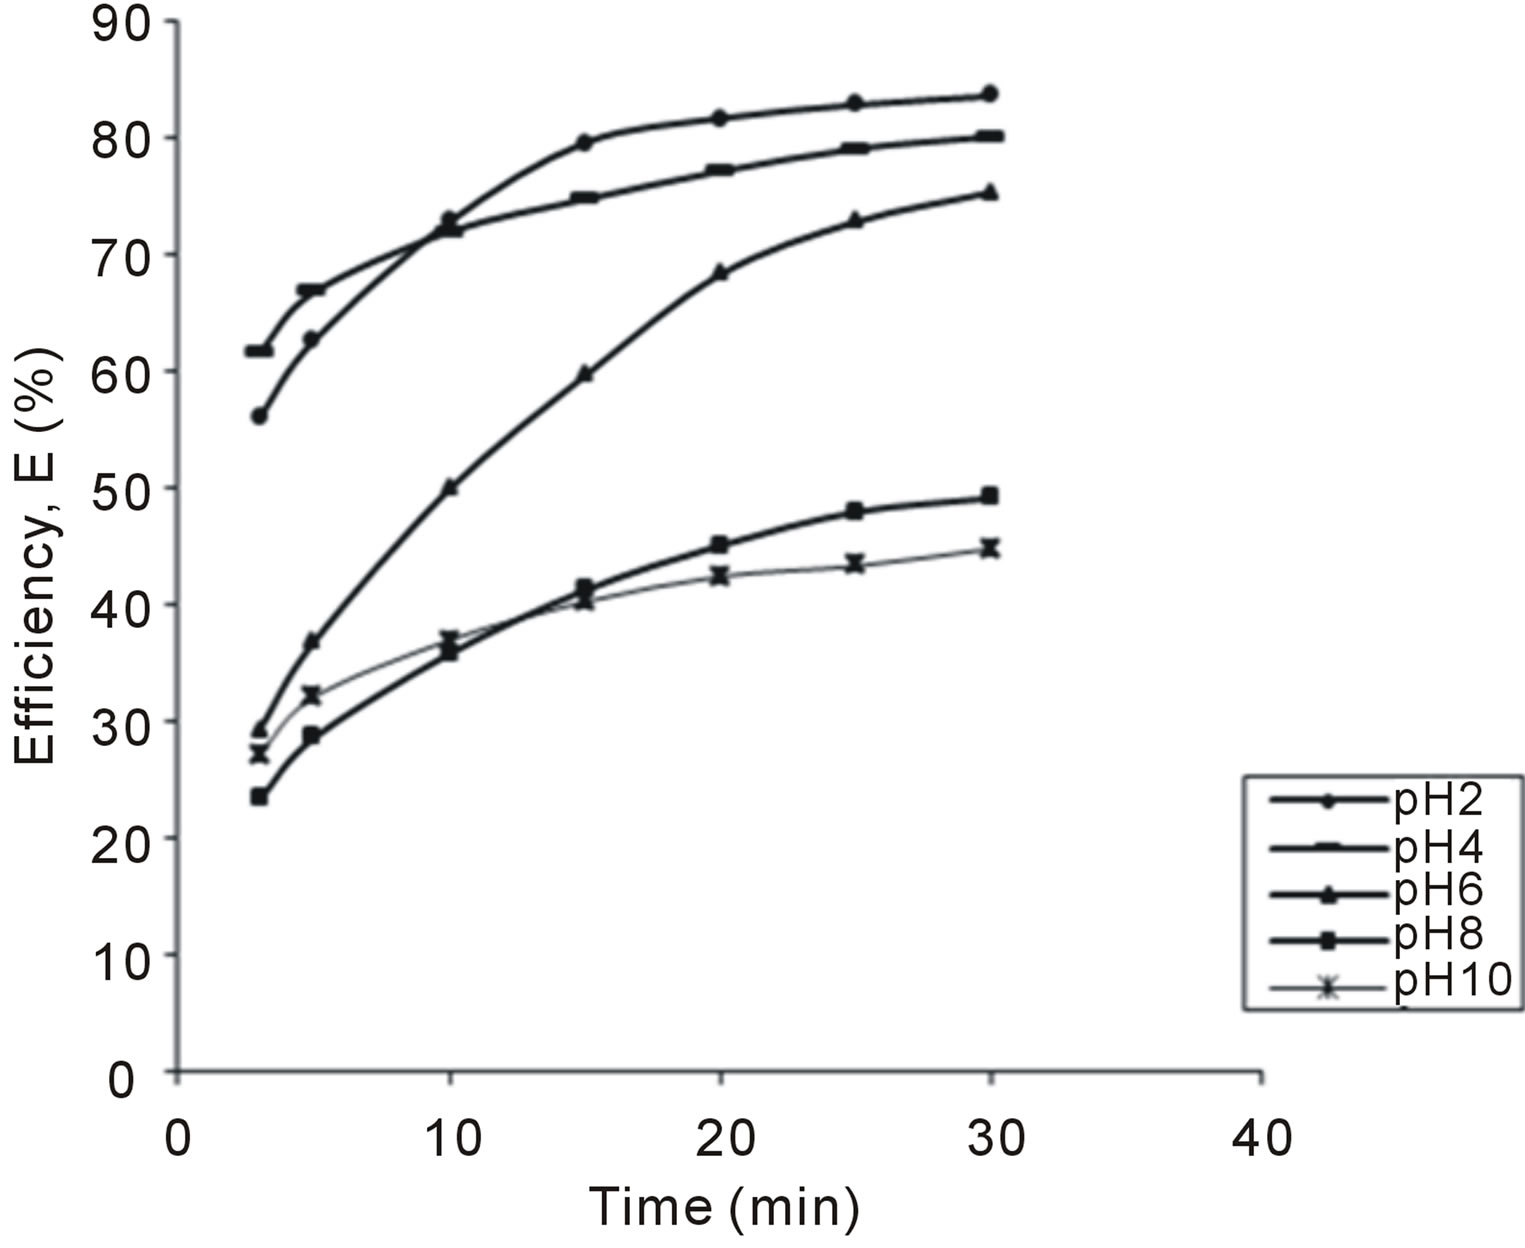
Figure 3. Selected plot of E (%) vs time for 200 mg/L.
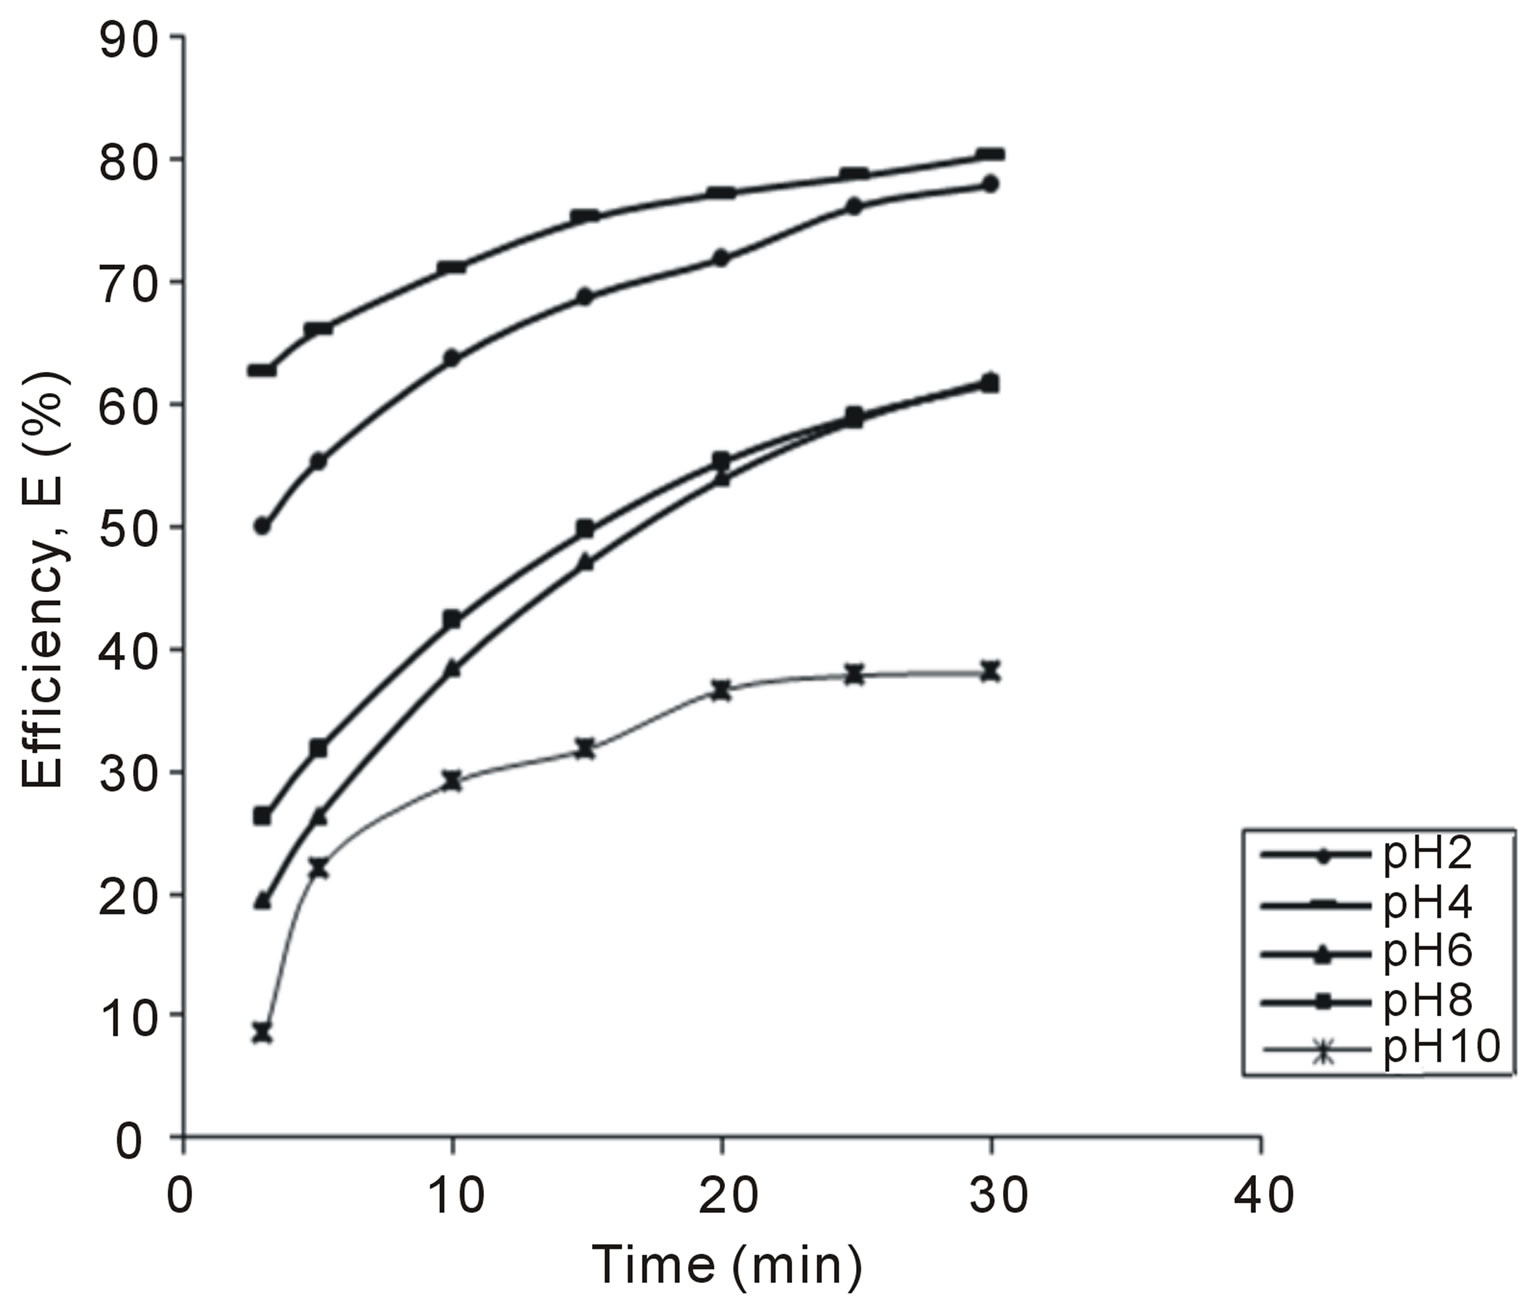
Figure 4. Selected plot of E (%) vs time for 300 mg/L.
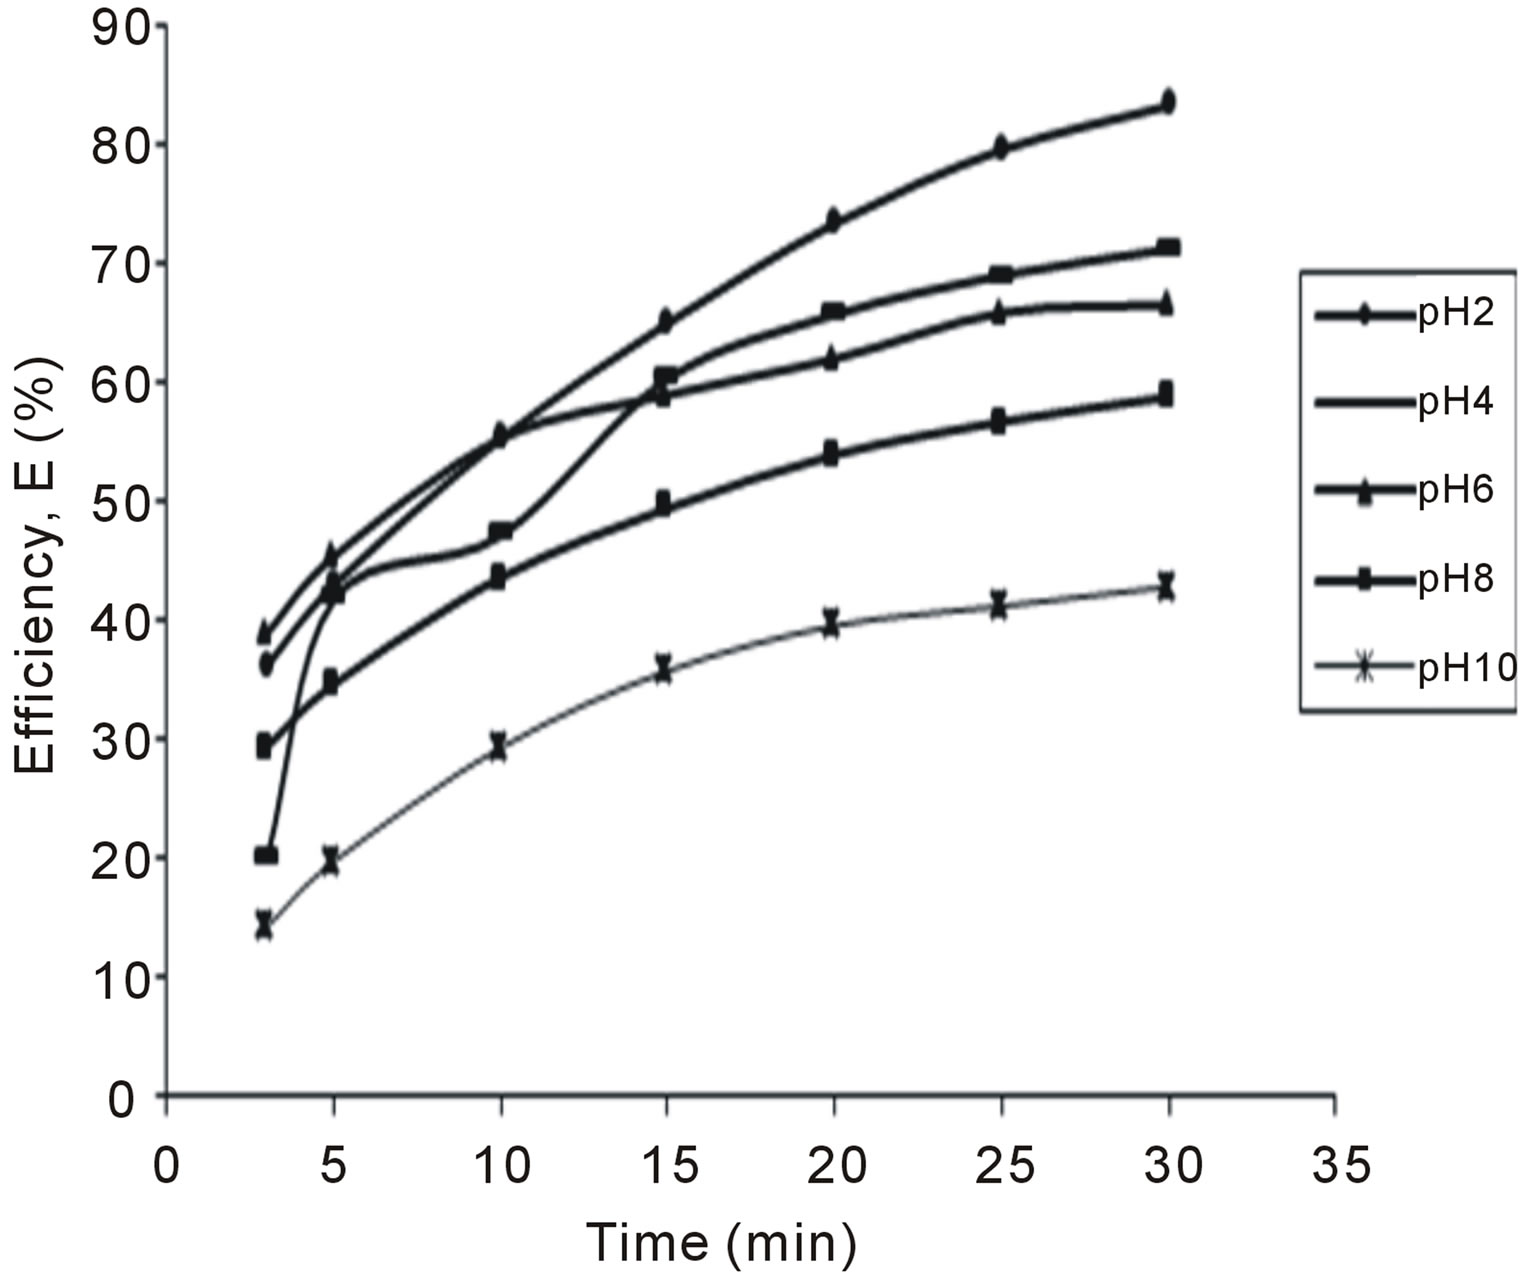
Figure 5. Selected plot of E (%) vs time for 400 mg/L.
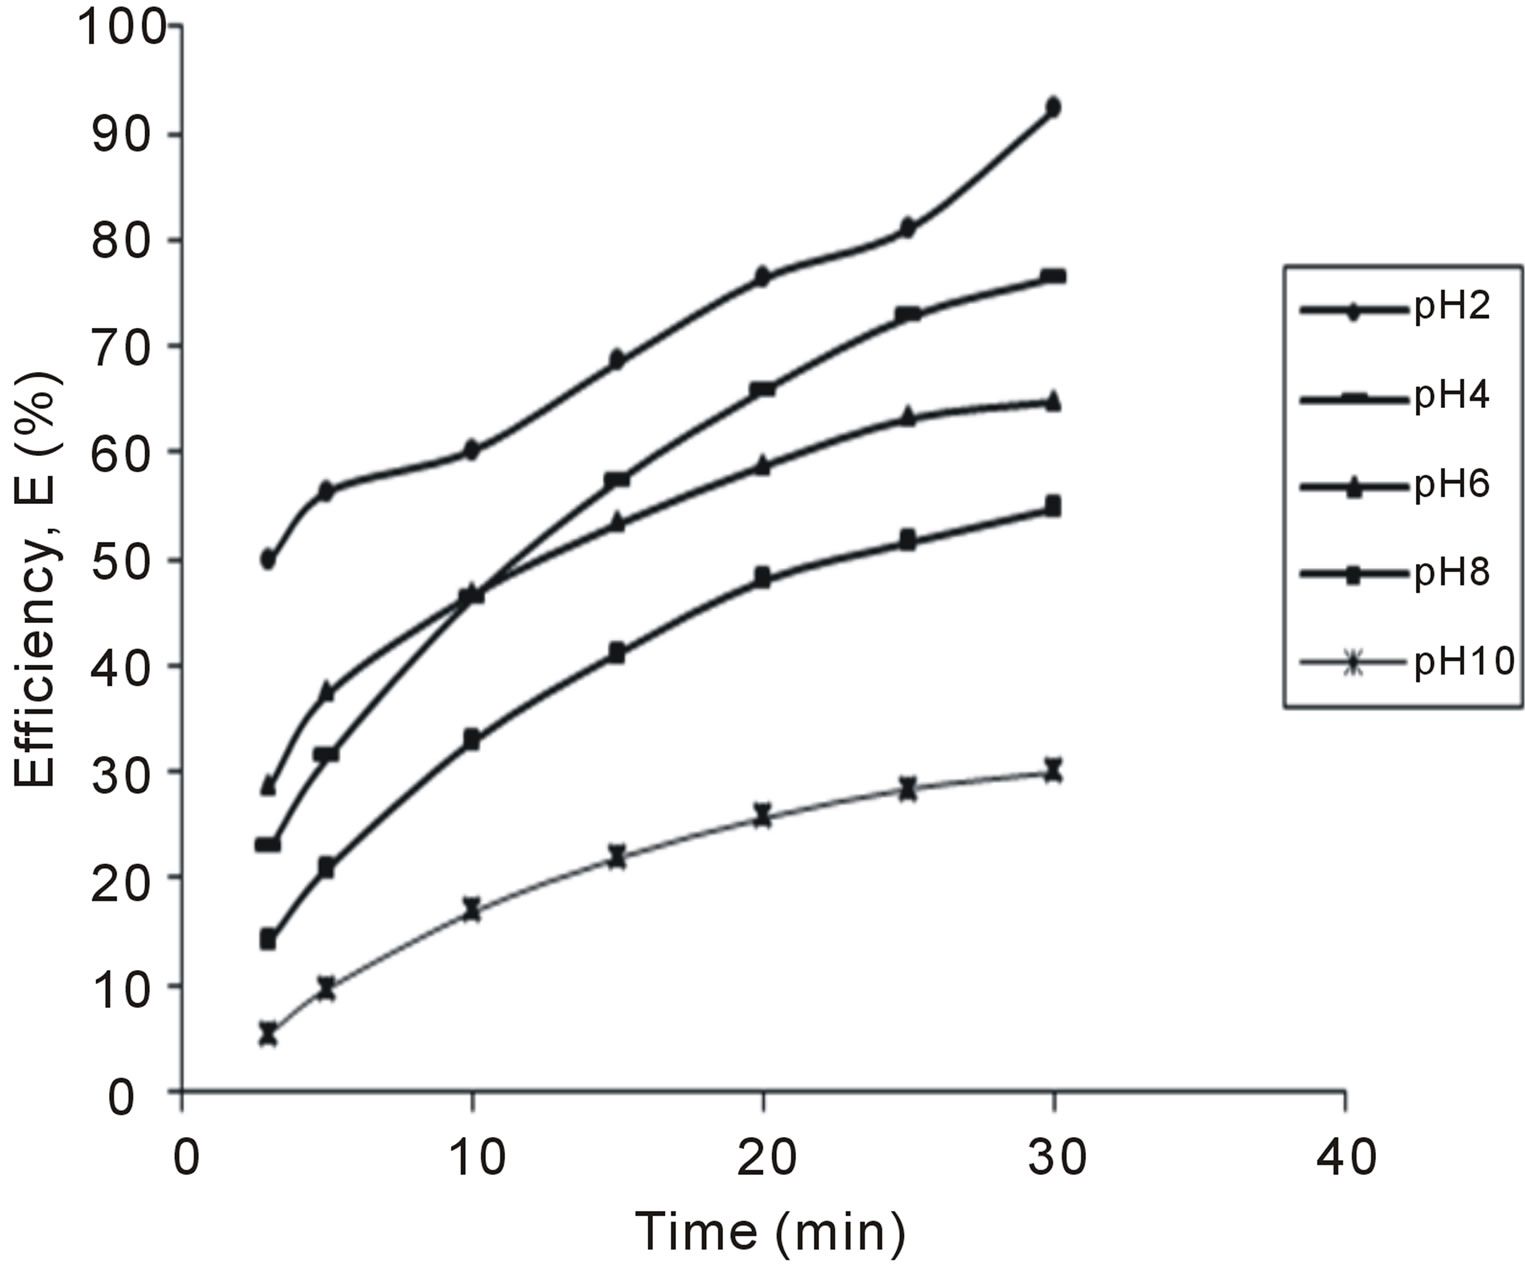
Figure 6. Selected plot of E (%) vs time for 500 mg/L.
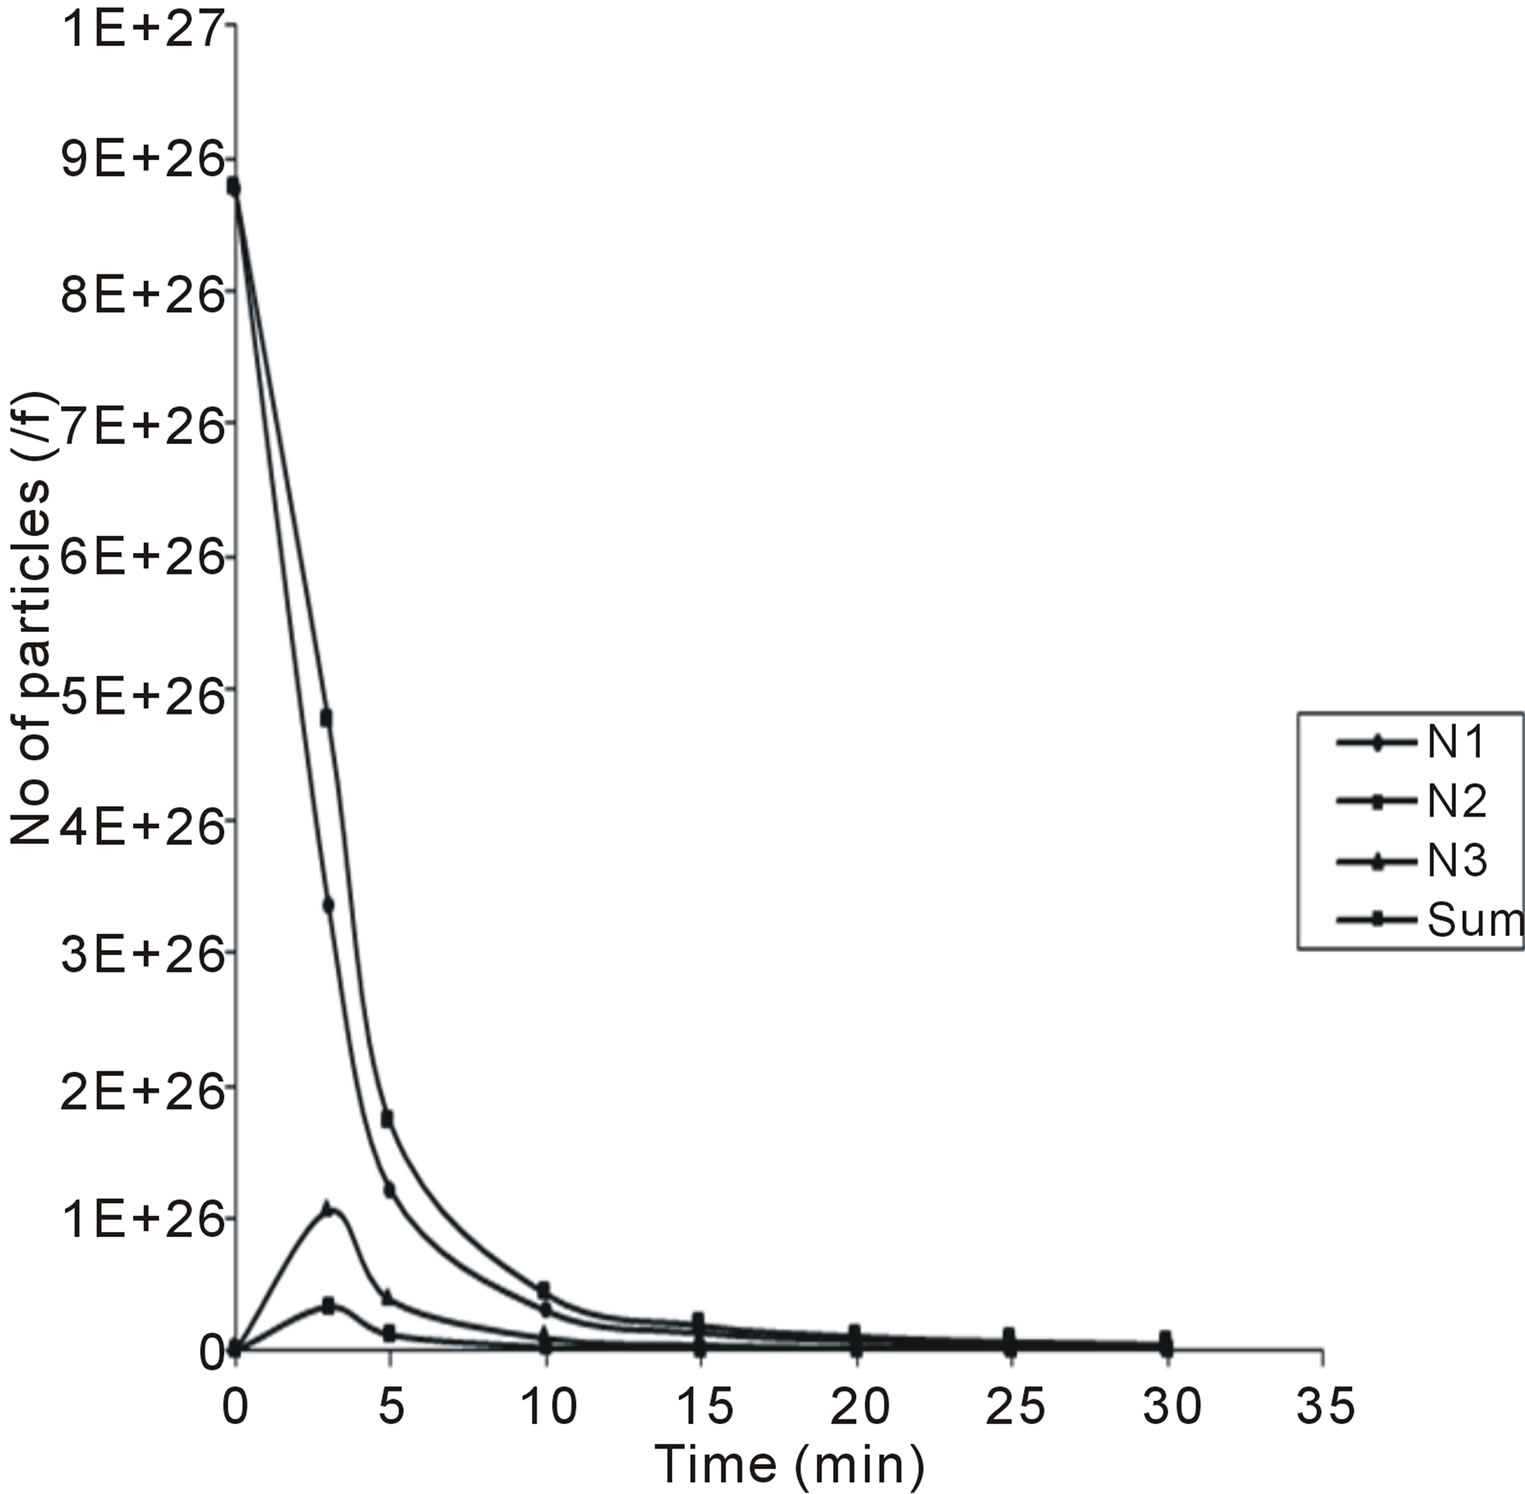
Figure 7. Temporal microscopic aggregate distribution at minimum half-life of 0.00416.
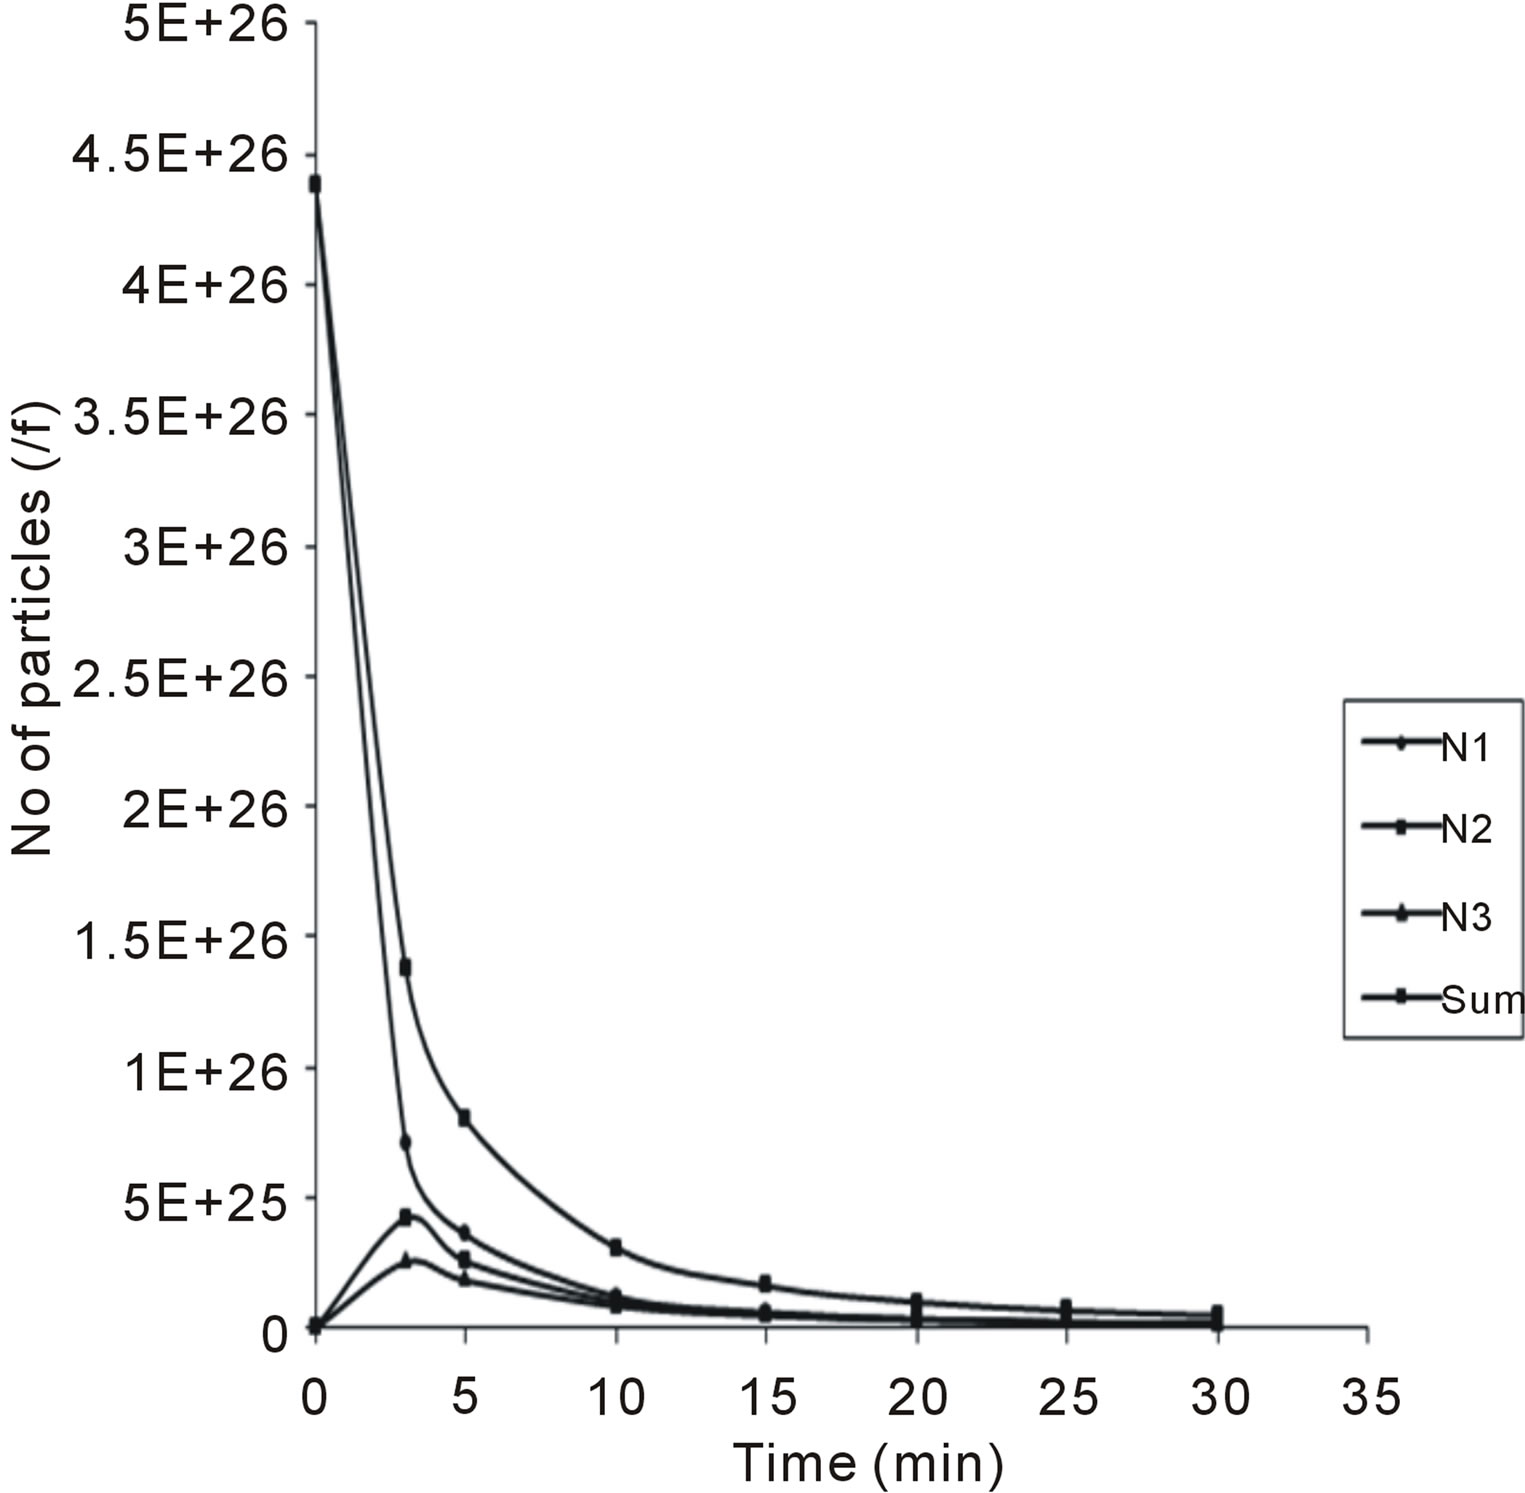
Figure 8. Temporal microscopic aggregate distribution at maximum half-life of 20.4 min.
repulsion.
Also in Figure 8, the value of τ1/2 (20.4 min) was high, corresponding to low collision, suggesting inability of particles to acquire energy need for effective coagulation.
This is an indication that there is no particle sweep, only a fraction of the particles flocculated. Similar results have been reported elsewhere [1,15].
5. Conclusion
From experimental results, CYC is an effective coagflocculant for treatment of brewery effluent, at the conditions of the experiment. However, varying the pH and dosage has significant difference on the coag-flocculation performance. The clarification performed best at 100 mg/L and 200 mg/L at pH2 and 4, respectively. Maximum efficiency of 92.28% was achieved at 200 mg/L. It could be concluded that second order model described the process adequately.
REFERENCES
- M. C. Menkiti, C. A. Onyechi and O. D. Onukwuli, “Evaluation of Perikinetics Compliance for the CoagFlocculation of Brewery Effluent by Brachystegiaeurycoma seed Extract,” International Journal of Multidisciplinary Sciences and Engineering, Vol. 2, No. 6, 2011, pp. 73-80.
- Y. Al-Degs, M. A. M. Khraisheh, S. J. Allen and M. N. Ahmad, “Effect of Carbon Surface Chemistry on the Removal of Reactive Dyes from Textile Effluent,” Water Research, Vol. 34, No. 3, 2000, pp. 927-935. http://dx.doi.org/10.1016/S0043-1354(99)00200-6
- G. Chen, L. Lei and P. Yue, “Wet Oxidation of HighConcentration Reactive Dyes,” Industrial & Engineering Chemistry Research, Vol. 38, No. 5, 1999, pp. 1837-1843. http://dx.doi.org/10.1021/ie980617d
- P. C. Sangave, P. R. Gogate and A. B. Pandit, “Combination of Ozonation with Conventional Aerobic Oxidation for Distillery wastewater Treatment,” Chemosphere, Vol. 68, No. 1, 2007 pp. 32-41. http://dx.doi.org/10.1016/j.chemosphere.2006.12.053
- A. A. Tatsi, A. I. Zouboulis, K. A. Matis and P. Smara, “Coagulation Flocculation Pre-Treatment of Sanitary Landfill Leachates,” Chemosphere, Vol. 53, No. 7, 2003, pp. 737-744. http://dx.doi.org/10.1016/S0045-6535(03)00513-7
- H. I. Abdel Shafy and Abdel-Basir, “Chemical Treatment of Industrial Wastewater,” Environmental Management and Health, Vol. 2, No. 3, 1991, pp. 19-23.
- G. Vijayaraghavan, T. Sivakumar and A. Vimal Kumar, “Application of Plant Based Coagulants for Wastewater Treatment,” International Journal of Advanced Engineering Research and Studies, Vol. 1, No. 1, 2011, pp. 88-92.
- J. R. Walton and M.-X. Wang, “APP Expression, Distribution and Accumulation Are Altered by Aluminum in a Rodent Model for Alzhelmer’s Disease,” Journal of Inorganic Biochemistry, Vol. 103, No. 11, 2009, pp. 1548- 1554. http://dx.doi.org/10.1016/j.jinorgbio.2009.07.027
- A. Ndbigengesere and K. S. Narasiash, “Quality of Water Treated by Coagulation Using Moringa oleifera Seeds,” Water Research, Vol. 32, No. 3, 1998, pp. 781-791. http://dx.doi.org/10.1016/S0043-1354(97)00295-9
- A. Olesin, “Low Technology Water Purification by Bentonite Clay and Moringa oleifera Seed Flocculation as performed in SudanceVillage: Effect on Schistsoma mansoni Cerceriae,” Water Research, Vol. 21, No. 5, 1978, pp. 517-522. http://dx.doi.org/10.1016/0043-1354(87)90059-5
- N. J. Enwere, “Foods of Plant Origin,” Afro-Orbis Publications Limited, University of Nigeria, Nsukka, 1998, pp 194-199.
- M. Von Smoluchowski, “Verucheiner MathemtischenTheorie der Koagulations Kinetic Kolloider Lousungen,” International Journal of Research in Physical Chemistry and chemical Physics, Vol. 92, 1917, pp. 129-168.
- M. C. Menkiti, P. C. Nnaji, C. I. Nwoye and O. D. Onukwuli, “Coag-Flocculation Kinetics and Functional Parameters Response of Mucuna Coagulant to pH Variation in Organic Rich Coal Effluent Medium,” Journal of mineral and Material Characterization and Engineering, Vol. 9, No. 2, 2010, pp. 89-103.
- R. J. Hunter, “Introduction to Modern Colloid Science,” 4th Edition, University Press, New York, 1993.
- M. C. Menkiti, “Studies on Coagulation and Flocculation of Coal Wa-shery Effluent: Turbidmetric Approach,” M.Sc. Thesis, Nnamdi Azikiwe University, Awka, 2007.
- Water Specialist Technology (WST), “About Coagulation and Flocculation,” Information Bulletins, WST, Sanford, 2003, pp. 1-10.
- H. Holthoff, S. U. Egelhaaf, M. Brokovec, P. Shurtenberger and H. Sticher, “Coagulation Rate Measurement of Colloidal Particles by Simultaneous Static and Dynamic light Scattering,” Journal of American Chemical Society, Vol. 12, No. 23, 1996, pp. 5541-5549.
- M. C. Menkiti, P. C. Nnaji and O. D. Onukwuli, “CoagFlocculation Kinetics and Functional Parameters Response of Periwinkle Shell Coagulant (PSC) to pH Variation in Organic Rich Coal Effluent Medium,” Nature and Science, Vol. 7, No. 6, 2009, pp. 1-8.
- MetCalf and Eddy, “Physical Unit Process, Wastewater Engineering Treatment and Reuse,” 4th Edition, Tata McGraw Hill, New York, 2003.
- AOAC, “Official Methods of Analysis,” 14th Edition, Association of Official Analytical Chemist, Gaithersburg, 1993.
NOTES
*Corresponding author.

