Journal of Water Resource and Protection
Vol. 2 No. 8 (2010) , Article ID: 2450 , 11 pages DOI:10.4236/jwarp.2010.28081
Experimental Investigations and Theoretical Modeling Aspects in Column Studies for Removal of Cr(VI) from Aqueous Solutions Using Activated Tamarind Seeds
Chemical Engineering Group, Birla Institute of Technology and Science (BITS), Rajasthan, India
E-mail: {sureshg, bvbabu}@bits-pilani.ac.in
Received November 16, 2009; revised December 14, 2009; accepted December 30, 2009
Keywords: Adsorption, Mathematical Modeling, Intraparticle Mechanism, Activated Tamarind Seeds, Hexavalent Chromium
ABSTRACT
Continuous adsorption experiments are conducted using fixed-bed adsorption column to evaluate the performance of the adsorbent developed (from activated tamarind seeds) for the removal of Cr(VI) from aqueous solutions and the results obtained are validated with a model developed in this study. The effects of significant parameters such as flow rate, mass of adsorbent, and initial Cr(VI) concentration are studied and breakthrough curves are obtained. As the flow rate increases from 10 to 20 mL min-1, the breakthrough time decreases from 210 to 80 min. As the mass of adsorbent increases, breakthrough time gets delayed. The breakthrough times are obtained as 110, 115 and 210 min for 15, 20 and 25 g of activated tamarind seeds. As the initial Cr(VI) concentration increases from 100 to 200 mgL-1, the break point time decreases from 210 to 45 min. The process parameters for fixed-bed adsorption such as breakthrough time, total percentage removal of Cr(VI), adsorption exhaustion rate and fraction of unused bed length are calculated and the performance of fixed-bed adsorption column is analyzed. The mechanism for Cr(VI) adsorption on activated tamarind seeds is proposed. At low value of solution pH (= 1), the increase in Cr(VI) adsorption is due to the electrostatic attraction between positively charged groups of activated tamarind seeds and the HCrO4-. A mathematical model for fixed-bed adsorption column is proposed by incorporating the effect of velocity variation along the bed length in the existing model. Pore and surface diffusion models are used to describe the intra-particle mechanism for Cr(VI) adsorption. The breakthrough curve obtained theoretically from pore diffusion model and surface diffusion model are compared with experimental results for different operating conditions. The standard deviation values obtained for pore diffusion model and solid diffusion model are 0.111 and 0.214 respectively.
1. Introduction
In all over the world, hexavalent chromium [Cr(VI)] has a dominant presence in most of the effluent streams as compared to other heavy metal ions. Cr(VI) compounds are used in various industries such as glass, ceramics, fungicides, rubber, fertilizers, tanning, mining, metallurgical etc [1-3]. Cr(VI) is produced as an effluent from the above mentioned industries which causes severe environmental and public health problems. Cr(VI) is highly mobile and is considered acutely toxic, carcinogenic and mutagenic to living organisms, and hence more hazardous than other heavy metals [4-7].
One useful solution for the elimination of Cr(VI) from the environment is the treatment of industrial effluent streams (wastewater) using an efficient method, adsorption, before being discharged into the aquatic systems [8,9]. Adsorption is an efficient and effective method for the removal of Cr(VI) when a suitable low cost adsorbent is identified.
Fixed bed adsorber is the most efficient arrangement for conducting adsorption process for industrial applications in wastewater treatment [10]. The design of an adsorption column depends on various important parameters such as flow rate, initial Cr(VI) concentration and bed height (mass of adsorbent). Understanding of adsorption characteristics, determination of break point time for adsorption operation and effective utilization of the column is possible by carrying out the mathematical modeling of fixed-bed adsorption column.
Very few researchers have worked in the area of continuous adsorption studies for the Cr(VI) removal. Continuous adsorption studies are required to collect the experimental data for the design of adsorption column and for subsequent scale-up from pilot plant to industrial scale operation. Past studies mainly focused on analytical approach of solving the dynamics of fixed-bed adsorption column. The models, which are available, exclude some of the important physical aspects such as axial dispersion, intraparticle resistances and velocity variation along the bed length.
In the present study, activated tamarind seeds are used as a low-cost adsorbent for the removal of Cr(VI) from aqueous solutions. It is one of the biological waste products which is widely available in all over the world and can be easily cultivated in variety of soils. Continuous adsorption experiments are performed to see the effect of influencing parameters such as flow rate, bed height (mass of adsorbent), and initial Cr(VI) concentration on Cr(VI) removal. Mathematical model for fixed-bed adsorption column is proposed which takes account of both external and internal mass-transfer resistances as well as of non-ideal plug flow along the column. Mathematical model proposed is validated with the experimental results obtained in the present study and the results reported in the literature.
2. Materials and Methods
2.1. Adsorbent Preparation
Tamarind seeds are collected from the wastage of Cafeteria and Guest House (BITS-Pilani) of the institute. The seeds are washed with distilled water and dried at 110℃ for 5 h. The dried seeds are crushed into small particles by using Jaw crusher. Crushed seeds are sieved by 10-12 mesh BSS screens. The particles, having an average size of 1.85 mm, are treated with concentrated sulphuric acid (98% w/w) in 1:1 weight ratio and kept in an oven maintained at a temperature range of 150℃ for 24 h. The carbonized material is washed with distilled water to remove the free acid. Then it is soaked in 1% sodium bicarbonate solution for two days. The material is then washed with distilled water and dried again at 100℃ for 5 h [7,11].
2.2. Experimental Studies
A stock solution of 1000 mgL-1 of Cr(VI) is prepared by dissolving 2.8287 g of 99.9% potassium dichromate (K2Cr2O7) in distilled water and volume of the solution is made upto 1000 mL. This solution is diluted as required to obtain standard solutions containing 20-800 mgL-1 of Cr(VI).
Continuous fixed-bed experiments are carried out to remove Cr(VI) from aqueous solutions using activated tamarind seeds. The schematic diagram of the experimental set up is shown in Figure 1. A glass column of 1.5 cm internal diameter is used as a fixed-bed column. The adsorbent bed is packed with the activated tamarind seeds in a stepwise procedure. Initially, two grams of adsorbent is filled into the column and is shaken manually in order to have dense packing. This procedure is continued till the whole mass of adsorbent is filled into the column. After this, 500 mL of distilled water is passed through the packed bed to make a more compact packing. Stock solution of Cr(VI) is passed in down flow mode through the fixed-bed and flow is controlled by a valve. To maintain the constant flow rate, constant level of Cr(VI) solution in overhead tank is maintained constant by pumping the solution from the tank containing stock solution of Cr(VI) as shown in Figure 1. The parameters varied in the present study are flow rate, mass of adsorbent (bed-height), and inlet Cr(VI) concentration. The flow rate is maintained constant using a liquid rotameter (0-15 L min-1). The fixed mass of the adsorbent and the stock solution of initial Cr(VI) concentration is used to maintain the higher correctness in column experiments. The experiments are carried out at an optimum pH value of 1 obtained by batch studies [7]. The choice of this low pH is also based on the real pH value
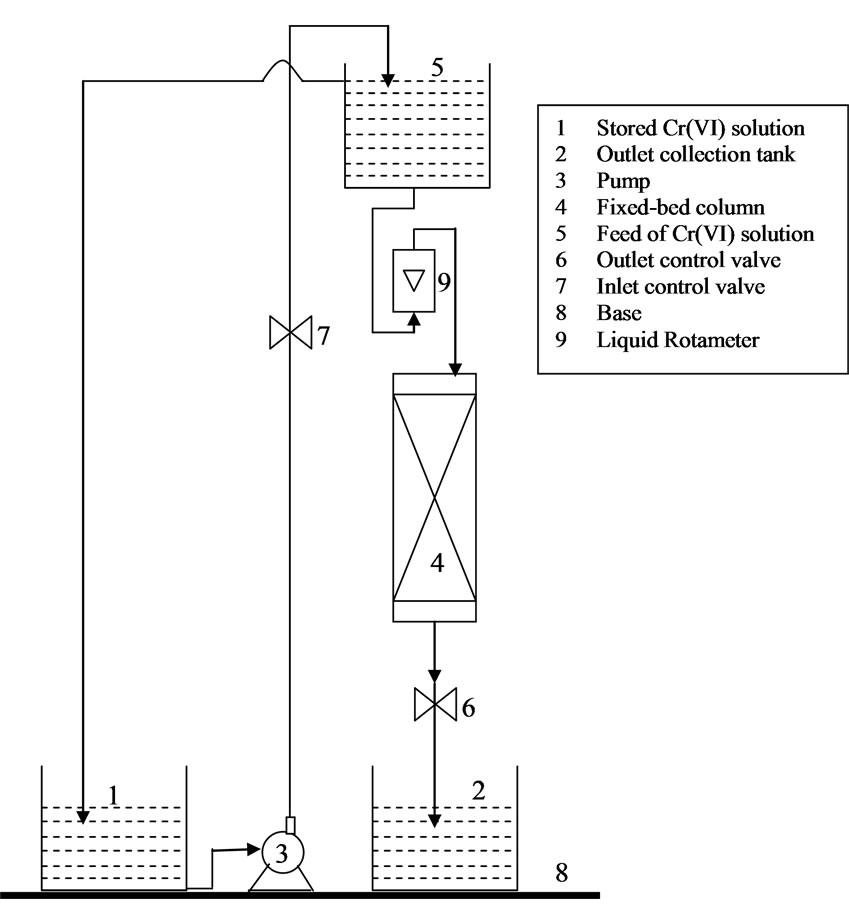
Figure 1. Fixed-bed continuous adsorption experimental setup for Cr(VI) removal from wastewater.
of industrial effluents such as chromium plating effluent (pH 1) [12], tannery effluent (pH 2) [13], and electroplating effluent (pH 2.2) [2], and the reported experimental studies in the literature [14,15].
In the present work, di-pheynl carbazide method is used to analyze the quantity of Cr(VI) ions in the aqueous solutions which only indicate the quantity of Cr(VI). This method has been reportedly used in a number of studies to analyze the Cr(VI) at low pH [3]. The concentration of Cr(VI) ions in the effluent is determined spectrophotometrically by developing a purple-violet color with 1, 5-diphenyl carbazide in acidic solution as a complexing agent [16]. The absorbance of the purple-violet colored solution is measured at a wavelength of 540 nm. The deviation of analytical method of Cr(VI) concentration is obtained by preparing the calibration curve. The standard deviation calculated for the calibration curve is 0.00453 which is an indicative of a good fit of the data and within the error limits of ± 1.64%. This ensured high confidence limits of the experimental analysis.
2.3. Mathematical Modeling and Simulation
In the present study, a mathematical model for the fixedbed column is proposed by incorporation of an important parameter, the linear velocity variation along the bed, which affects significantly the design of an adsorption column [17]. The proposed model can be extensively used for understanding the dynamics of fixed-bed adsorption column for the adsorption of organic and inorganic (metal ions) compounds.
To formulate a generalized model for the fixed-bed adsorption column, following assumptions are made:
1) The adsorption column is operates under isothermal conditions.
2) The equilibrium of adsorption is described by Langmuir isotherm.
3) Mass transfer across the boundary layer surrounding the adsorbent particles is characterized by the external-film mass transfer coefficient, kf.
4) The linear velocity of the bulk phase varies along the fixed-bed column.
5) The adsorbent particles are spherical and homogeneous in size and density.
Based on the above assumptions, the net rate of accumulation or depletion is given by Equation (1):
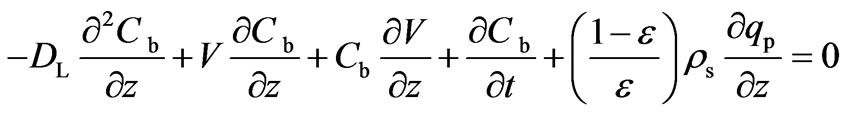 (1)
(1)
The initial conditions are given by Equations (2) and (3):
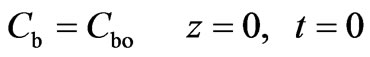 (2)
(2)
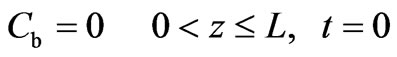 (3)
(3)
The boundary conditions at both ends of the column are given by Equations (4) and (5):
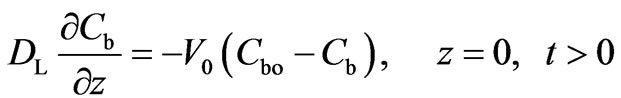 (4)
(4)
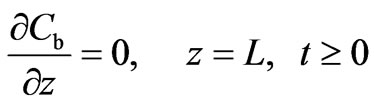 (5)
(5)
The superficial velocity, V, in fixed-bed adsorption is not constant due to the adsorption of Cr(VI). For liquid phase adsorption, assuming the liquid density to be constant, the total mass balance is given by Equation (6) which is used to estimate the variation of velocity of bulk fluid along the bed height.
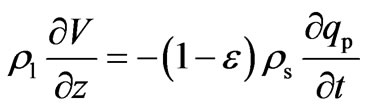 (6)
(6)
Boundary conditions are given by Equations (7) and (8):
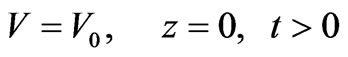 (7)
(7)
 (8)
(8)
The transport of the solute species from the bulk of the fluid to the external surface of adsorbent particle constitutes an important step in the overall uptake process. For adsorption of solute in spherical pellets, the inter-phase mass transfer rate may be expressed by Equation (9):
 (9)
(9)
The intra-pellet solute transport mechanism is expressed by pore diffusion and solid diffusion and the associated adsorption isotherm for the system considered is Langmuir isotherm, which are discussed below.
2.3.1. Pore Diffusion
Intra-particle mass transport is characterized by the pore diffusion coefficient, DP. The mass balance equation for the pore phase in a spherical particle can be written by Equation (10):
 (10)
(10)
The initial conditions considered are given by Equation (11):
 (11)
(11)
The symmetry condition at the center of the adsorbent particle and continuity condition on the external surface of the particle are expressed by Equations (12) and (13), respectively:
 (12)
(12)
 (13)
(13)
2.3.2. Solid Diffusion
The mass balance equation for the intra-particle solute transport due to the solid diffusion phenomena is given by Equation (14):
 (14)
(14)
The symmetry condition at the center of the particles and continuity condition on the external surface of the adsorbent bed are expressed by Equations (15) and (16), respectivey:
 (15)
(15)
 (16)
(16)
2.3.3. Adsorption Isotherm
The adsorption isotherm for the present system of Cr(VI) removal using activated tamarind seeds was found to be favorable and nonlinear, and is well described by Langmuir isotherm [7], and as given by Equation (17):
 (17)
(17)
2.4. Simulation Algorithm
The preceding set of partial differential Equations (1) to (17) is solved numerically by reduction to set of non linear algebraic equations using the Explicit Finite Difference technique. Finite difference technique has been successfully applied to solve such type of partial differential equations in other studies by the authors group [17]. A mathematical algorithm to solve these coupled equations is developed and implemented into a computer program using MATLAB (v.6.1) software.
The standard deviation, s.d., was calculated using Equation (18) for comparing the model and experimental results and given as:
 (18)
(18)
3. Results and Discussion
The adsorption capacity of activated tamarind seeds as an adsorbent for the Cr(VI) removal was investigated in batch studies and reported in previous study [7,18]. The adsorbent capacity of activated tamarind seeds for Cr(VI) removal was also compared with other low cost adsorbent and found to be a potential alternative for removal of Cr(VI) from aqueous solutions. In the following sections, the effect of flow rate, mass of adsorbent and initial Cr(VI) concentration on the breakthrough curve for the removal of Cr(VI) by conducting the continuous column experiments is discussed. It also includes the validation of proposed mathematical model for fixed-bed adsorption column with the experimental results obtained in present study and the results reported in the literature.
3.1. Continuous Adsorption Experiments
Fixed bed column experiments are performed in order to generate the data for obtaining the breakthrough curves. The breakthrough time and the shape of the breakthrough curve are very important characteristics for the determination of dynamic response of the adsorption column. The breakpoint time is defined as the time of adsorption when the outlet concentration from the column was about 1-5% of the inlet concentration. The total stoichiometric quantity of adsorbed Cr(VI) (qt, mg) in the column for a given inlet Cr(VI) concentration and flow rate is calculated from Equation (19):
 (19)
(19)
The area under the breakthrough curve (Ac) is obtained by plotting the adsorbed concentration (Cad, mgL-1) versus time (t, min). Total amount of Cr(VI) sent to column (mt) was calculated from Equation (20):
 (20)
(20)
where, tt is the time equivalent to total stoichiometric capacity of the column which is defined by Equation (21):
 (21)
(21)
Total percentage removal of Cr(VI) is calculated from Equation (22):
 (22)
(22)
The empty bed residence time (EBRT) is the time required for the liquid to fill the empty column. The EBRT is given by Equation (23):
 (23)
(23)
The adsorbent exhaustion rate (Ra) is the mass of adsorbent used (W) per volume of liquid treated at breakpoint time which is given by Equation (24):
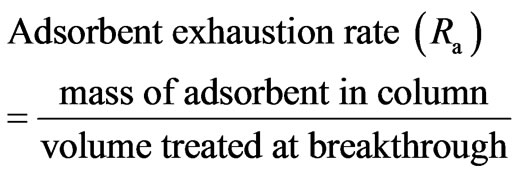 (24)
(24)
The fraction of unused bed length is calculated from Equation (25):
 (25)
(25)
Various parameters such as time equivalent to the total capacity of column (tt), the total flow time (tf), the breakthrough time (tb), the total or stoichiometric amount of Cr (VI) adsorbed (qt), the total amount of Cr(VI) sent to the column (mt), the total percentage removal of Cr(VI) (S), the Empty Bed Resistance Time (EBRT), the adsorbent exhaustion rate (Ra) and the fraction of unused bed length (y) [19,20] are evaluated for Cr(VI) removal using activated tamarind seeds in fixed-bed adsorption column for different operating conditions (Table 1).
3.1.1. Effect of Flow Rate
The flow rate of wastewater stream flowing through the column plays a major role in designing an adsorption column. The breakthrough curves are obtained at different flow rates (10, 15 and 20 mL min-1) by maintaining the constant adsorbent amount of 25 g and initial Cr(VI) concentration 100 mgL-1 at a initial pH value 1 (Figure 2). As the flow rate increases, breakthrough time is obtained earlier. The breakthrough times obtained are 210, 115 and 80 min for flow rate values of 10, 15 and 20 mL min-1, respectively. The total percentage removal of Cr(VI) in fixed-bed operations found to decrease from 50% to 45.1% with an increase in the flow rate from 10 to 20 mL min-1 (Table 1). The total time, corresponding to the stoichiometric capacity of the column, is found to be decreasing from 640 to 320 min with an increase in the flow rate from 10 to 20 mL min-1 (Table 1). The fraction of unused bed length at breakthrough point increases from 0.67 to 0.75 with an increase in the flow rate from 10 to 20 mL min-1. Figure 2 shows that the steepness of breakthrough curve increases with increase in flow rate.
The decrease in breakthrough time with an increase in flow rate may be because of a fixed saturation capacity of the bed for the same concentration difference giving rise to a shorter time for saturation at higher flow rates. The increase in the steepness of breakthrough curve and the decrease in the removal efficiency (50% to 45.1%) with increase in the flow rate (10 to 20 mL min-1) may be explained by the fact that when the residence time of Cr(VI) in the fixed-bed is not long enough for the adsorption equilibrium to be reached at that flow rate, the Cr(VI) solution leaves the fixed-bed before equilibrium occurs. Hence the contact time between Cr(VI) and activated tamarind seeds is very short at higher flow rates, results in a decrease in the removal efficiency (Table 1). Another probable reason for the faster saturation of the activated tamarind seeds bed at higher flow rates could be that with an increase in the flow rate, mixing increases and the thickness of the liquid film surrounding the activated tamarind seeds particle decreases, which reduces the film transfer resistance and hence an increase in the mass transfer rate.
3.1.2. Effect of Mass of Adsorbent
The shape of the breakthrough curve also depends on the mass of adsorbent (bed-length) used in the fixed-bed adsorption. The effect of mass of adsorbent is studied for 15, 20 and 25 g for activated tamarind seeds while maintaining the flow rate and the initial Cr(VI) concentration constant as 10 mL min-1and 100 mgL-1, respectively at a pH value of 1. The breakthrough curves obtained for this study are shown in Figure 3. As the mass of adsorbent
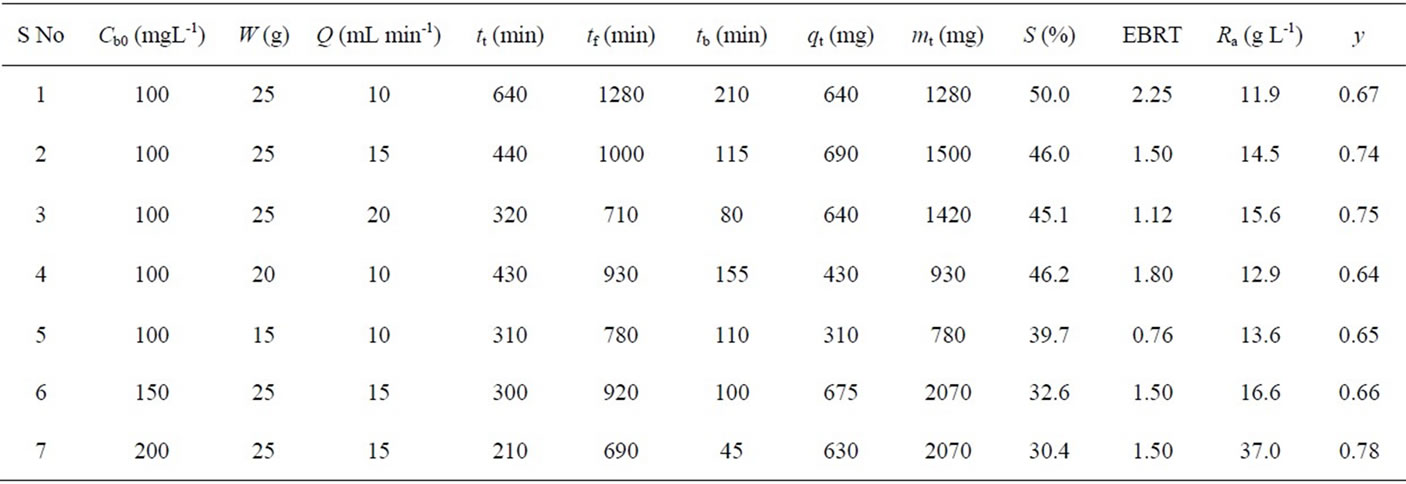
Table 1. Different parameters for the Cr(VI) removal using activated tamarind seeds in a fixed-bed adsorption column for different operating conditions.
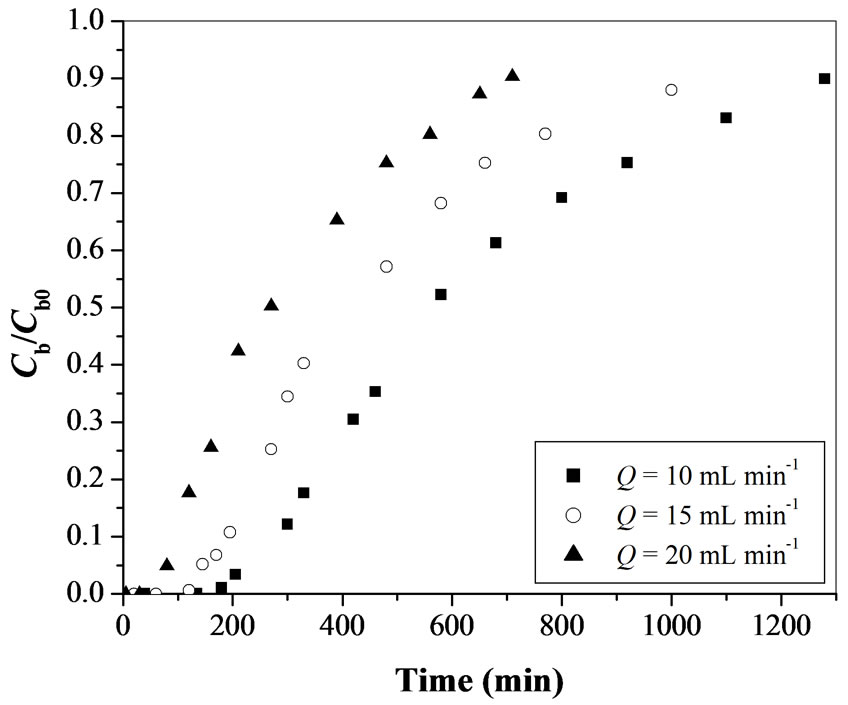
Figure 2. Effect of flow rate on breakthrough curve for Cr(VI) removal using activated tamarind seeds (Cb0 = 100 mgL-1 and W = 25 g).
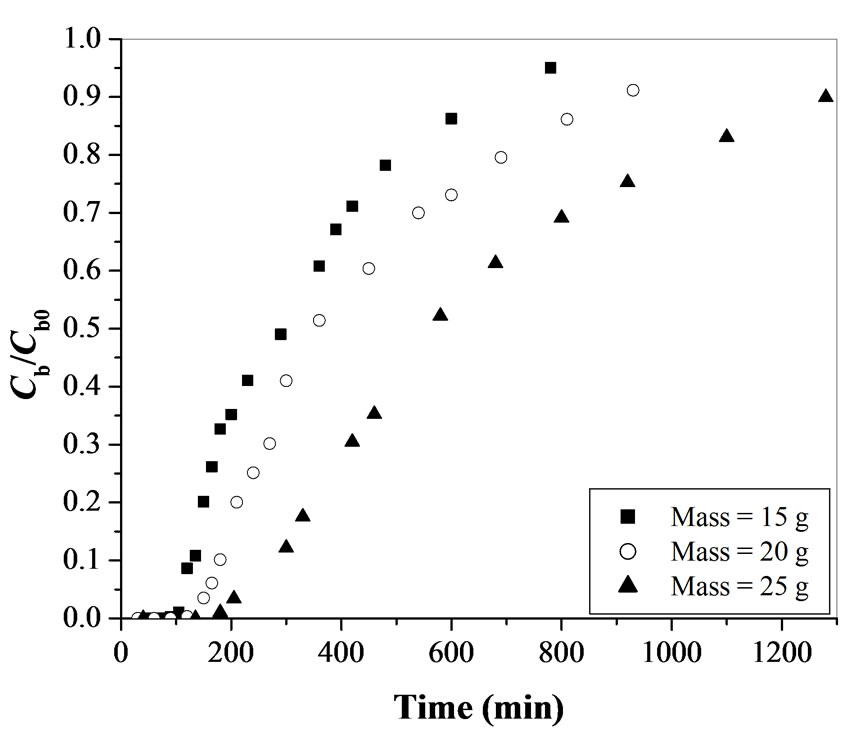
Figure 3. Effect of mass of adsorbent on breakthrough curve for Cr(VI) removal using activated tamarind seeds (Cb0 = 100 mgL-1 and Q = 10 mL min-1).
increases, breakthrough time gets delayed. The breakthrough times are obtained as 110, 115 and 210 min for 15, 20 and 25 g of activated tamarind seeds.
The total time, corresponding to the stoichiometric capacity of the column, is found to be increasing from 310 to 640 min with an increase in the mass of adsorbent from 15 to 25 g. (Table 1). The total percentage removal of Cr(VI) for the fixed-bed adsorption column increases from 39.7 to 50.0% with an increase in mass of adsorbent from 15 to 25 g (Table 1). The fraction of unused bed length at breakthrough point is found to be approximately same (within the range of 0.64-0.67) for 20 and 25 g of activated tamarind seeds. The rate of adsorbent exhaustion decreases from 13.6 to 11.9 g L-1 with an increase in mass of activated tamarind seeds from 15 to 25 g.
Figure 3 shows that with an increase in the amount of activated tamarind seeds, the capacity of the fixed-bed adsorption column to adsorb Cr(VI) increases which results in a delay to obtain the breakpoint time. This may be due to the increase in the activated tamarind seeds surface area with increase in the amount of adsorbent which provides more binding sites for the adsorption of Cr(VI). For smaller bed-length, the rate of adsorbent exhaustion is higher which shows a faster exhaustion of the fixed-bed.
3.1.3. Effect of Initial Cr(VI) Concentration
In the adsorption of Cr(VI), a change in initial Cr(VI) concentration affects the operating characteristics of the fixed-bed adsorption column. The breakthrough curves obtained by varying initial Cr(VI) concentration from 100 to 200 mgL-1 for activated tamarind seeds are shown in Figure 4. As the initial Cr(VI) concentration increases from 100 to 200 mgL-1, the break point time decreases from 210 to 45 min. The total time, corresponding to stoichiometric capacity of the column, is found to be decreasing from 640 to 210 min with an increase in the initial Cr(VI) concentration from 100 to 200 mgL-1 (Table 1). The total percentage removal of Cr(VI) for the fixed-bed adsorption column is decreasing from 50.0 to 30.4% with an increase in initial Cr(VI) concentration (Table 1). The fraction of unused bed length at breakthrough point is obtained in the range of 0.67 to 0.78 for 100 to 200 mgL-1 of initial Cr(VI) concentration (Table 1). The rate of adsorbent exhaustion increases in the range of 11.5 to 37 g L-1 with an increase in initial Cr(VI) concentration.
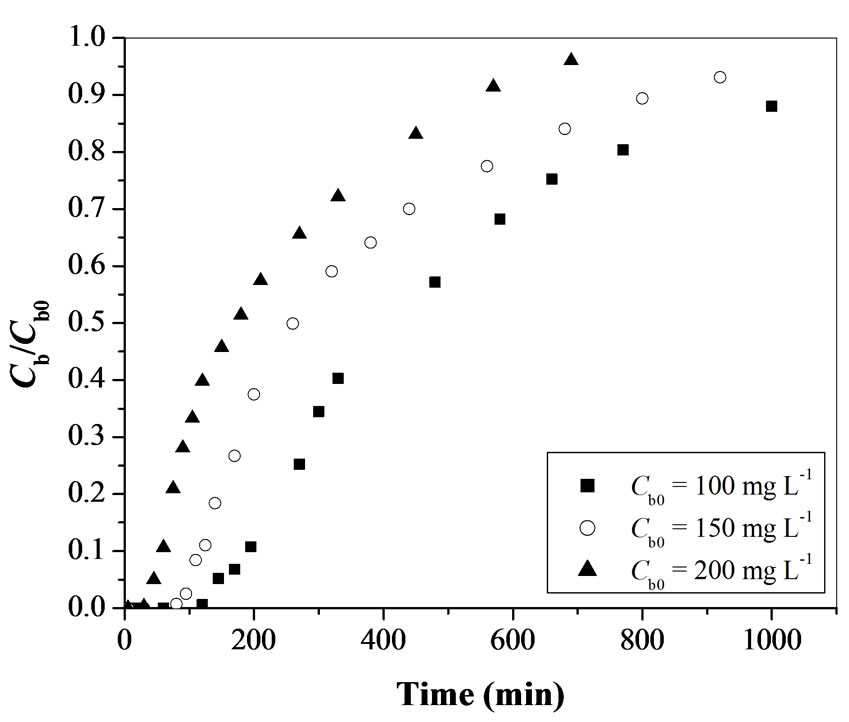
Figure 4. Effect of initial Cr(VI) concentration on breakthrough curve for Cr(VI) removal using activated tamarind seeds (W = 25 g and Q = 15 mL min-1).
The increase in initial Cr(VI) concentration led to reach bed saturation earlier and obtaining breakthrough time quickly due to relatively slower transport due to a decrease in diffusion coefficient and decreased mass transfer coefficient at low Cr(VI) concentration [19]. Binding sites, quickly filled at higher initial concentration, result in a decrease in the breakthrough time. It is observed that the adsorbent get saturated faster at higher concentrations of adsorbate due to the higher rate of adsorbent exhaustion at higher Cr(VI) concentration. For a low initial Cr(VI) concentration, breakthrough occurs very late and surface of the adsorbents is saturated with Cr(VI) at a relatively longer time. This fact is probably associated with the availability of adsorption sites around or inside the adsorbent particles that are able to capture the Cr(VI) at lesser retention time.
3.1.4. Mechanism of Cr(VI) Adsorption
In adsorption, atoms, ions or molecules of a solute diffuse to the surface of adsorbent, where they either attach to the adsorbent surface due to the chemical bond or are physically held with weak intermolecular forces. The electrostatic charge and functional group interactions define the affinity of activated tamarind seeds for Cr(VI) adsorption. The Cr(VI) ions uptake on activated tamarind seeds mainly depends on (1) the Cr(VI) ions concentration, and (2) the adsorption and reduction phenomena that simultaneously take place on the activated tamarind seeds surface. The adsorption of Cr(VI) is more effective on acid-treated adsorbents [21]. In the present study, tamarind seeds are treated using concentrated H2SO4 at lower temperature (150℃). At this temperature, adsorbent surface generally develops acidic surface oxides and lower solution pH value. It is well documented in the literature that chemically activated naturally occurring adsorbent has a higher surface area and shows a larger capacity of Cr(VI) removal [6,21]. Cr(VI) ions adsorption on adsorbent surface is strongly depends to the solution pH. It can be related to the type and ionic state of the functional group present on the adsorbent surface [6,7,9].
The ionic state of the functional group on the activated tamarind seeds surface depends on the pHzpc (zero point of charge) value of adsorbent. The value of pHzpc of activated tamarind seeds is found as 5.4, and below this value of solution pH, the surface charge of the activated tamarind seeds is positive [22]. In the present study, the pH of the initial Cr(VI) solution is kept as 1 which is less than the value of pHzpc. This indicates that the active sites of activated tamarind seeds are charged positively. For the solution pH range of 1.0 to 3.0, chromium ions can exist in the form of HCrO4-. At low value of solution pH 1, the increase in Cr(VI) adsorption is due to the electrostatic attraction between positively charged groups of activated tamarind seeds and the HCrO4-.
3.2. Mathematical Modeling and Simulation
In the present model, linear velocity variation along the bed is considered. The present mathematical model is simulated and validated using the parameter values reported by Bautista et al. [23] (Table 2). The present mathematical model is also compared with the experimental data of the same study with the model data obtained using present model and model proposed by Bautista et al. [23] as shown in Figure 5. The standard deviation (s.d.) is obtained as 0.113 for the results obtained with the present model and 0.139 for those obtained using Bautista et al. [23] model. The present model results show an improvement over the previous model with respect to better steepness of the breakthrough curve which is being validated by earlier studies [24,25]. This indicates that, consideration of effect of velocity variation along the bed length improve the existing model and is found to be better in explaining the trends obtained using experimental data. Based on the successful implementation of velocity variation in the model, and supporting evidence in the literature, simulations are carried out to validate the proposed model with the obtained experimental data for Cr(VI) removal using activated tamarind seeds in this study.
The comparison of experimental results and the model predictions (pore diffusion and solid diffusion models) for Cr(VI) adsorption using activated tamarind seeds is shown in Figure 6. Model parameter values for the simulation in the present study are listed in Table 2. The breakthrough curve obtained theoretically from pore diffusion model and surface diffusion model are compared with experimental results for different operating conditions and obtained standard deviation values are reported in Table 3. In the pore diffusion model a long tail is observed (Figure 6). But the solid diffusion model shows steeper breakthrough curve as compared to pore diffusion model. It may be due to the slow diffusion of Cr(VI) molecules into the center of adsorbent such as activated tamarind seeds [25]. The obtained experimental results are also found to be in agreement with the pore diffusion model (s.d. = 0.073 – 0.165) which confirms that the Cr(VI) adsorption on activated tamarind seeds can be described by pore diffusion mechanism (Table 3).
Figure 6 establish the fact that the experimental data for Cr(VI) adsorption using activated tamarind seeds fit well with the model initially but vary in the later half of the breakthrough curve. This may be due to the high fraction of unutilized bed length (0.64-0.78) which is responsible for more flattening of breakthrough curve at the latter stage of adsorption [25]. Langmuir isotherm model is found better than the Freundlich isotherm model to describe the equilibrium data for Cr(VI) adsorption on tamarind seeds. Langmuir isotherm is considered as favorable isotherm, whereas the Freundlich isotherm is
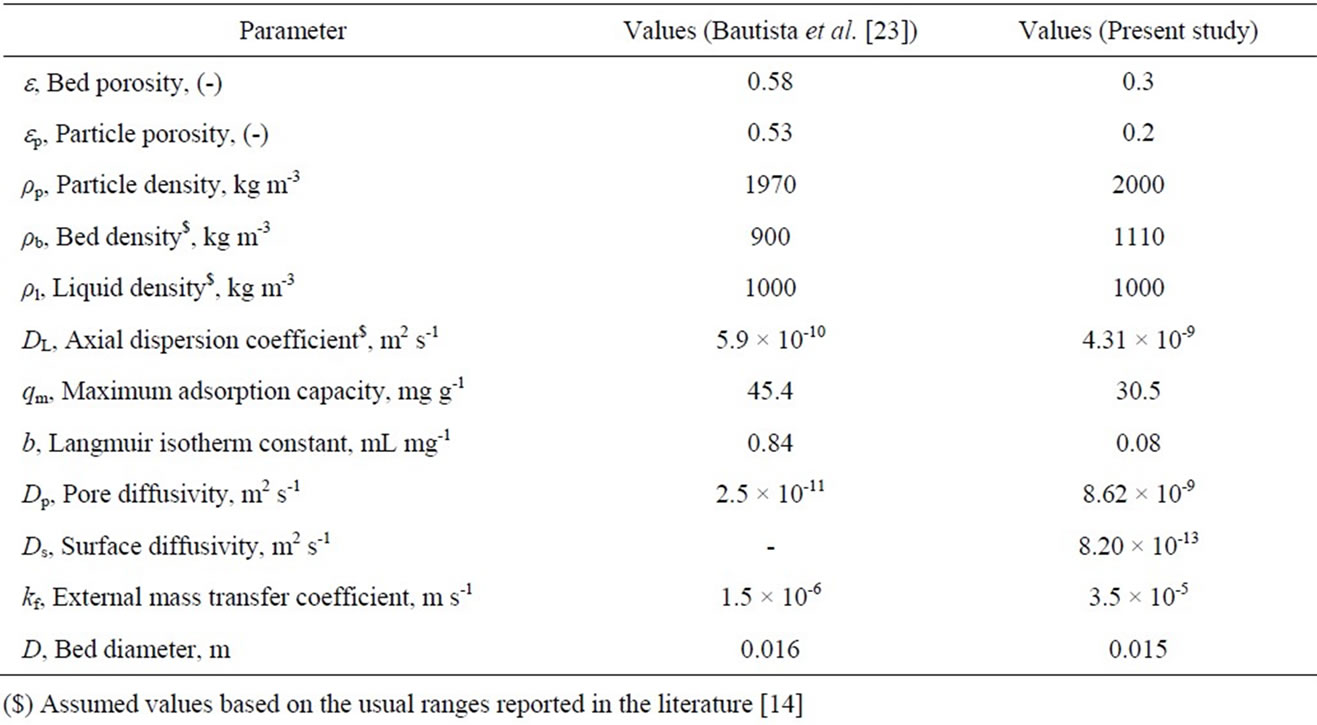
Table 2. Model parameters values used for simulation.
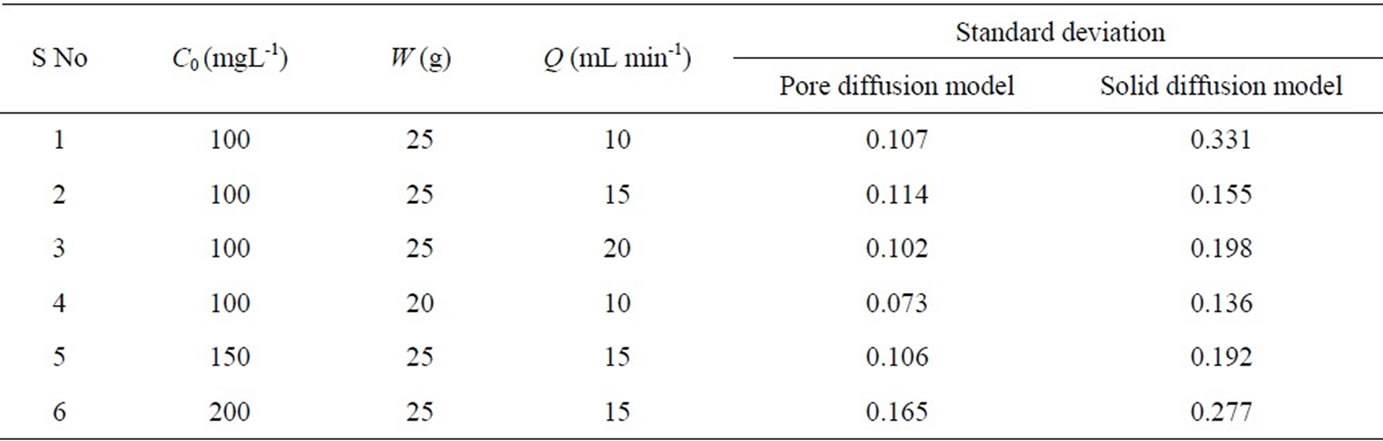
Table 3. Standard deviation values for Cr(VI) adsorption on activated tamarind seeds by fixed-bed adsorption column on different operating conditions.
accepted as a strongly favorable isotherm [25]. The unused bed length for favorable isotherm is higher than the strongly favorable isotherm [25]. Some of the model parameters (Table 2) are also assumed for the simulation of model in the present study. This may also one of the reasons for the obtained results (Table 3). Theoretically the steepness of breakthrough curve in solid diffusion model is more as compared to pore diffusion model in the latter half of adsorption [25]. Due to this reason, solid diffusion model is not found suitable for Cr(VI) removal using activated tamarind seeds.
4. Conclusions
A low cost adsorbent such as activated tamarind seeds is developed and found to be potential alternative for Cr(VI) removal from aqueous solutions. The breakthrough curves obtained by carrying out the fixed-bed columns experiments substantiates that the breakthrough curves
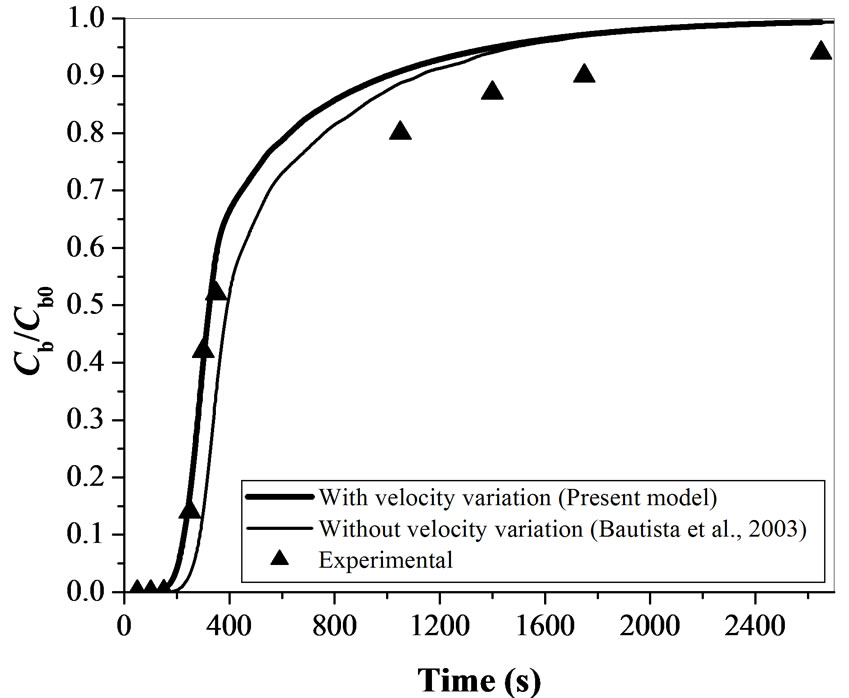
Figure 5. Comparison between theoretical and experimental results obtained using proposed mathematical model for the parameters given by Bautista et al. [23] (Cb0 = 1000 mgL-1, Q = 1 mL min-1 & W = 30 g).
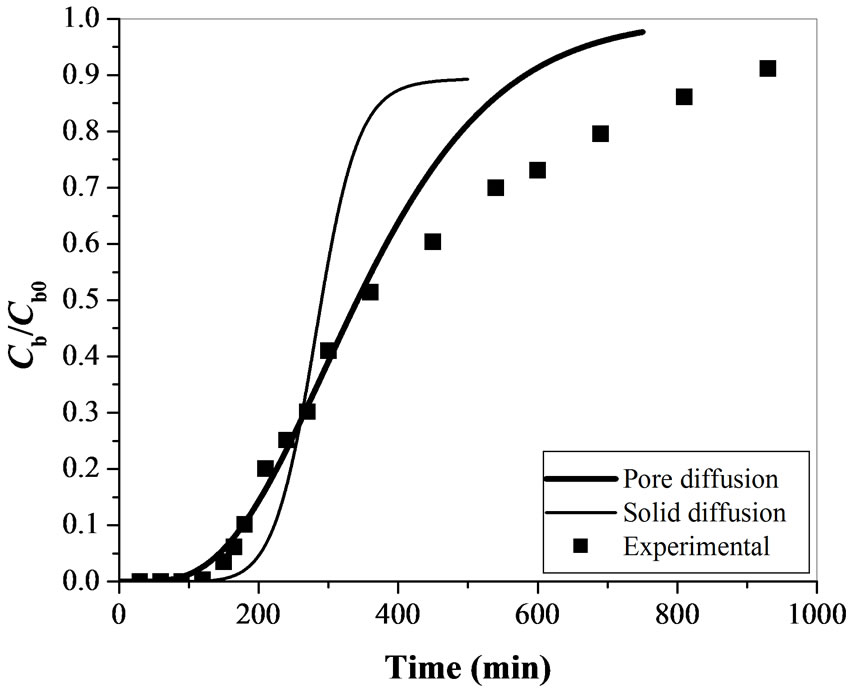
Figure 6. Comparison of experimental & theoretical breakthrough curve for Cr(VI) removal using activated tamarind seeds (Q = 10 mL min-1, Cb0 = 100 mgL-1 & W = 20 g).
are strong functions of adsorption exhaustion rate and fraction of unused bed length. It is observed that breakthrough point is obtained earlier by increasing the flow rate, decreasing the mass of adsorbent and increasing the initial Cr(VI) concentration. The proposed model is successfully validated with the literature data and obtained experimental data in the present study. Pore diffusion model is found suitable for explaining the breakthrough behavior attained for Cr(VI) removal using activated tamarind seeds. The results obtained from the proposed model show a good agreement with the experimental data for Cr(VI) adsorption during the initial time period of adsorption, but not so in the latter part of adsorption.
5. Acknowledgements
Authors thank University Grants Commission (UGC), New Delhi, India for their financial support.
REFERENCES
- C. Namasivayam and R. T. Yamuna, “Adsorption of Chromium(VI) by a Low-Cost Adsorbent: Biogas Residual Slurry,” Chemosphere, Vol. 30, No. 3, 1995, pp. 561-578.
- R. Kumar, N. R. Bishnoi and G. K. Bishnoi, “Biosorption of Chromium(VI) from Aqueous Solution and Electroplating Wastewater Using Fungal Biomass,” Chemical Engineering Journal, Vol. 135, No. 3, 2007, pp. 202-208.
- E. Malkoc and Y. Nuhoglu, “Potential of Tea Factory Waste for Chromium(VI) Removal from Aqueous Solutions: Thermodynamic and Kinetic Studies,” Separation & Purification Technology, Vol. 54, No. 2, 2007, pp. 291-298.
- Agency for Toxic Substances and Disease Registry (ATSDR), “Toxicological Profile for Chromium,” US Public Health Service, US Department of Health and Human Services, Altanta, 1993.
- M. Aliabadi, K. Morshedzadeh and H. Soheyli, “Removal of Hexavalent Chromium from Aqueous Solution by Lignocellulosic Solid Wastes,” International Journal of Environmental Science & Technology, Vol. 3, No. 3, 2006, pp. 321-325.
- B. V. Babu and S. Gupta, “Adsorption of Cr(VI) Using Activated Neem Leaves as an Adsorbent: Kinetic Studies,” Adsorption, Vol. 14, No. 1, 2008, pp. 85-92.
- B. V. Babu and S. Gupta, “Removal of Cr(VI) from Wastewater Using Activated Tamarind Seeds as an Adsorbent,” Journal of Environmental Engineering and Science, Vol. 7, No. 5, 2008, pp. 553-557.
- E. Alvarez-Ayuso, A. Garcia-Sanchez and X. Querol, “Adsorption of Cr(VI) from Synthetic Solutions and Electroplating Wastewaters on Amorphous Aluminium Oxide,” Journal of Hazardous Materials, Vol. 142, No. 1-2, 2007, pp. 191-198.
- S. Gupta and B. V. Babu, “Removal of Toxic Metal Cr(VI) from Aqueous Solutions Using Sawdust as Adsorbent: Equilibrium, Kinetics, and Regeneration Studies,” Chemical Engineering Journal, Vol. 150, No. 2-3, 2009, pp. 352-365.
- H. T. Liao and C. Y. Shiau, “Analytical Solution to an Axial Dispersion Model for the Fixed-Bed Adsorber,” American Institute of Chemical Engineers Journal, Vol. 46, No. 6, 2000, pp. 1168-1176.
- A. Ramadevi and K. Srinivasan, “Agricultural Solid Waste for the Removal of Inorganics: Adsorption of Mercury (II) from Aqueous Solution by Tamarind Nut Carbon,” Indian Journal of Chemical Technology, Vol. 12, No. 4, 2005, pp. 407-412.
- K. Selvaraj, S. Manonmani and S. Pattabhi, “Removal of Hexavalent Chromium Using Distillery Sludge,” Bioresource Technology, Vol. 89, No. 2, 2003, pp. 207-211.
- S. M. Contreras-Ramos, D. Alvarez-Bernal, N. TrujilloTapia and L. Dendooven, “Composting of Tannery Effluent with Cow Manure and Wheat Straw,” Bioresource Technology, Vol. 94, No. 2, 2004, pp. 223-228.
- E. Malkoc, Y. Nuhoglu and Y. M. Dundar, “Adsorption of Chromium(VI) on Pomace-An Olive Oil Industry Waste: Batch and Column studies,” Journal of Hazardous Materials, Vol. 138, No. 1, 2006, pp. 142-151.
- V. Sarin, T. S. Singh and K. K. Pant, “Thermodynamic and Breakthrough Column Studies for the Selective Sorption of Chromium From Industrial Effluent on Activated Eucalyptus Bark,” Bioresource Technology, Vol. 97, No. 16, 2006, pp. 1986-1993.
- American Public Health Association (APHA), “Standard Methods for the Examination of Water and Wastewater,” 16th Edition, APHA, AWWA, WPCF, Washington, D.C, 1985.
- B. V. Babu and S. Gupta, “Modeling and Simulation of Fixed-Bed Adsorption Column: Effect of Velocity Variation,” Journal of Engineering Technology, Vol. 1, No. 1, 2005, pp. 60-66.
- Z. Aksu and F. D. Gönen, “Biosorption of Phenol by Immobilized Activated Sludge in a Continuous Packed Bed: Prediction of Breakthrough Curves,” Process Biochemistry, Vol. 39, No. 5, 2004, pp. 599-613.
- S. Gupta and B. V. Babu, “Utilization of Waste Product (Tamarind Seeds) for the Removal of Cr(VI) from aqueous solutions: Equilibrium, Kinetics, and Regeneration Studies,” Journal of Environmental Management, Vol. 90, No. 10, 2009, pp. 3013-3022.
- S. Gupta, “Theoretical and Experimental Investigations for Removal of Pollutants Using Adsorption,” Doctoral Thesis, Birla Institute of Technology and Science, Pilani, 2008.
- J. S. Mattson and H. B. Mark, Jr, “Activated Carbon,” Marcel Dekker, New York, 1971.
- P. Suksabye, P. Thiravetyan, W. Nakbanpote and S. Chayabutra, “Chromium Removal from Electroplating Wastewater by Coir Pith,” Journal of Hazardous Materials, Vol. 141, No. 3, 2007, pp. 637-644.
- L. F. Bautista, M. Martinez and J. Aracil, “Adsorption of α-Amylase in a Fixed-Bed: Operating Efficiency and Kinetic Modeling,” American Institute of Chemical Engineers Journal, Vol. 49, No. 10, 2003, pp. 2631-2641.
- Z. Ma, R. D. Whitley and N. H. L. Wang, “Pore and Surface Diffusion in Multicomponent Adsorption and Liquid Chromatography Systems,” American Institute of Chemical Engineers Journal, Vol. 42, No. 5, 1996, pp. 1244- 1262.
- W. L. McCabe, J. M. Smith and P. Harriott, “Unit Operations of Chemical Engineering,” 7th Edition, McGrawHill International Edition, Singapore, 2007.
Notation
aP Equivalent particle diameter, m
Ac Area under the breakthrough curve, m2
b Langmuir isotherm constant, L g-1
c Adsorbate concentration inside the pellet, mgL-1
Cad Concentration of Cr (VI) adsorbed, mgL-1
Cb Adsorbate concentration in mobile phase, mgL-1
Cbo Initial Cr (VI) concentration, mgL-1
Ce Concentration of Cr (VI) at equilibrium, mgL-1
Cexp Experimental Cr (VI) concentration in mobile phase, mgL-1
Cmodel Model values of Cr (VI) concentration in mobile phase, mgL-1
DL Axial dispersion coefficient, m2 s-1
Dp Pore diffusivity, m2 s-1
Ds Solid diffusion coefficient, m2 s-1
EBRT Empty bed residence time, s
kf External mass transfer coefficient, m s-1
L Bed height, m
mt Total amount of Cr(VI) sent to the column, mg
N Number of data points, (-)
qp Average solid phase adsorbate concentration, mg g-1
qe Equilibrium solid phase concentration, mg g-1
qt Amount of adsorbate adsorbed at time, t, by the adsorbent, mg g-1
qm Maximum monolayer adsorption capacity, mg g-1
Q Flow rate, mL min-1
r Radial distance, m
Ra Adsorption exhaustion rate, g mL-1
S Percentage removal of Cr(VI) in fixed-bed adsorption column, (-)
s.d. Standard deviation, (-)
t Time, sec
tb Breakthrough time, sec
tf Final time of adsorption, sec
tt Time equivalent to stoichiometric capacity of the column, sec
V Superficial velocity, m s-1
Vo Initial superficial velocity, m s-1
W Weight of adsorbent, g
y Fraction of unused bed length
z Axial coordinate, m
Greek Symbols
Θ Fractional coverage, (-)
ε Bed porosity, (-)
εp Particle porosity, (-)
ρb Bed density, kg m-3
ρl Liquid density, kg m-3
ρs Density of adsorbent, kg m-3