Journal of Water Resource and Protection
Vol. 2 No. 4 (2010) , Article ID: 1671 , 11 pages DOI:10.4236/jwarp.2010.24034
Aquifer Vulnerability Assessment Methods: The Non-Independence of Parameters Problem
Dipartimento di Ingegneria Idraulica, Geotecnica e Ambientale, Università di Napoli “Federico II”, Napoli, Italy
E-mail: daniela@unina.it
Received November 11, 2009; revised February 5, 2010; accepted February 25, 2010
Keywords: aquifer pollution vulnerability, GIS, sensitivity analysis, southern Italy
ABSTRACT
This paper investigates the relationship between the two parameters, aquifer media and hydraulic conductivity, and assesses their reliability for aquifer vulnerability assessment. To evaluate the possible non-independence of the parameters in question, sensitivity analysis procedure was used in a GIS environment. The procedure was tested in three areas where aquifer vulnerability was assessed, corresponding to three different hydrogeological settings. The applications demonstrate that non-independence is confirmed and is more evident in alluvial and volcano-pyroclastic aquifers.
1. Introduction
Groundwater protection is a prior environmental concern in many countries, such as in Europe, where more than 50% of the water supply is obtained from groundwater [1]. In this context, vulnerability assessments can meet a variety of needs for groundwater managers, land use regulators, resource conservationists and the general public. Increasing awareness, informing land use decision making, allocating resources, and evaluating alternative policies are just a few examples of the uses of groundwater vulnerability maps [2].
Pollution vulnerability assessment requires in-depth knowledge of the hydrogeological, hydrodynamic and hydrochemical characteristics of aquifers. Several methods and simulation models have been developed since the 1970s. In the last 15 years the advent of GIS, permitting the inventory, archival, retrieval and display of spatial data and the link to numerical rating systems, has resulted in the widespread use of parametric methods, based on the hydrogeological setting: e.g. DRASTIC [3], commonly used in the USA, and SINTACS [4,5], an Italian modification.
In parametric methods all the parameters have to be independent. This study tests the possibility of the nonindependence of two parameters—aquifer media and hydraulic conductivity—by application in three sample areas corresponding to three different hydrogeological environments: karstic, volcano-pyroclastic and alluvial aquifers.
1.1. Hydrogeological Setting of the Study Areas
1.1.1. The Matese Sampling Area
The western sector of the Matese Mts. encompasses approximately 170 km2 and is located between the regions of Campania and Molise (southern Italy). The area where carbonate rocks (limestone and dolomite) crop out is approximately 130 km2, with a mean elevation of 950 m a.s.l. Large sectors are characterized by several forms of karstic origin, which influence the groundwater flow. The groundwater body reaches the springs at the foot of the mountains with a total discharge of about 2 m3/s.
On the basis of geological, structural and hydrochemical data, [6] divided the whole carbonate area into five main hydrogeological basins (Figure 1). The Capriati-Prata Plain consists of impervious arenaceous-marly turbiditic deposits locally covered in the NW sector by a thickness of fine-grained alluvial sediments. In the SE sector about 20 m of these sediments, extensively covered by pyroclastic deposits, overlie the carbonatic bedrock.
1.1.2. The “Roccamonfina Volcano” Sampling Area
Roccamonfina, the oldest quaternary volcano in Campania, is a stratovolcano with a smooth morphology (400 km2), reaching a maximum height of 1006 m a.s.l. (Figure 2). The lithology of the western sector is represented by alternating strata of lava and pyroclastic sediments (first phase of activity), whereas the eastern side is characterized by widespread pyroclastic deposits (second phase of activity, mainly explosive) [7].
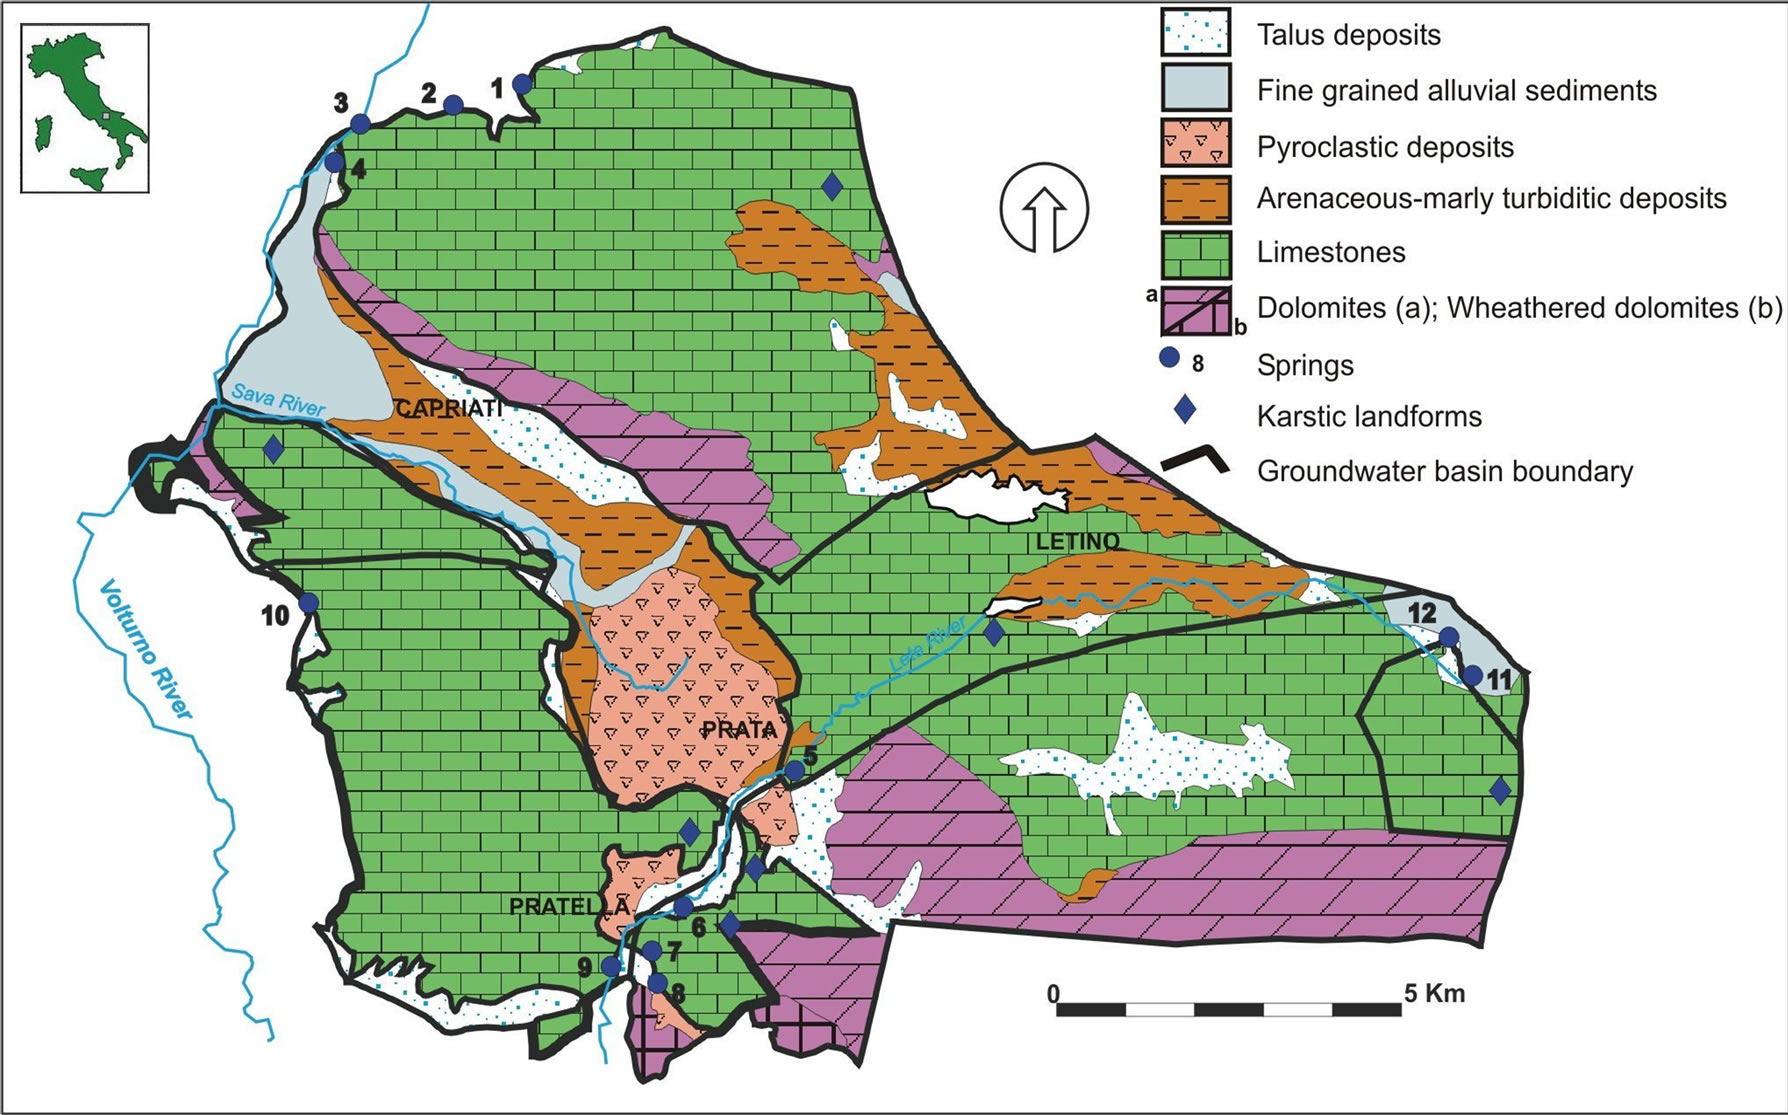
Figure 1. Hydrogeological scheme of the Matese Mts. sample area [6].
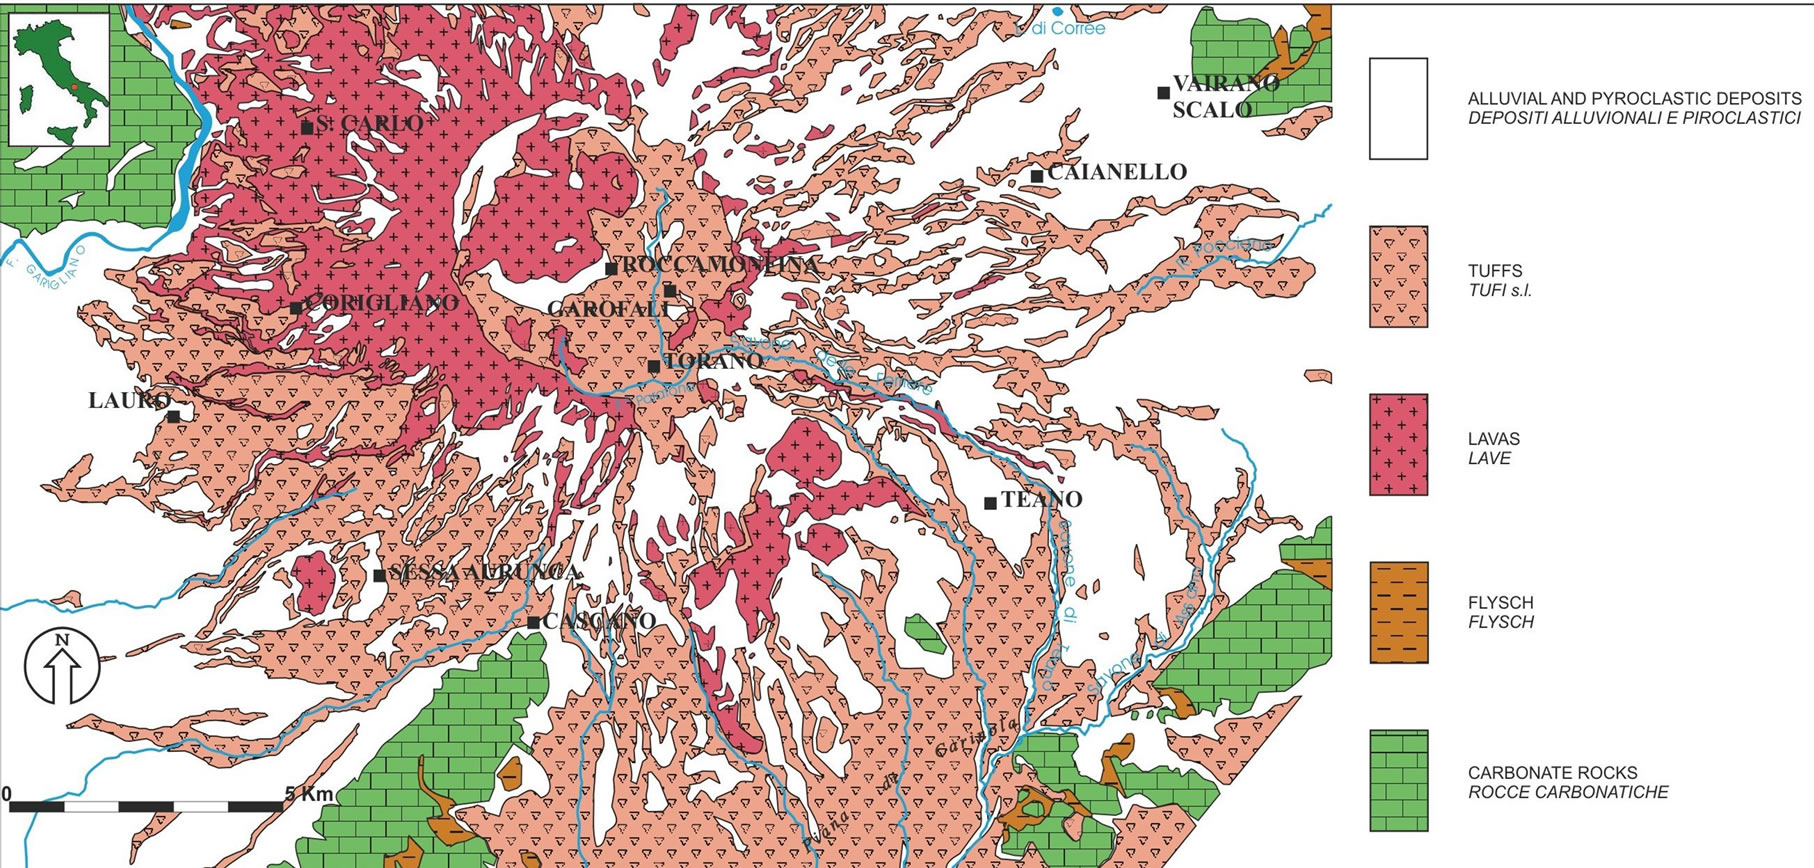
Figure 2. Hydrogeological scheme of the Roccamonfina Volcano sample area [7].
The piezometric setting (1996) shows a basal radial flow that partly feeds the contiguous aquifers by underflows, and partly increases the flow of some peripheral streams. Only a small amount of groundwater reaches the numerous springs located on the volcano. The recharge volume of the aquifer, calculated by the hydrogeological balance, is nearly 113 ´ 106 m3/a and its source is wholly dependent on rainfall [8].
1.1.3. The Venafro Plain Sampling Area
The study area, with its almost flat morphology, covers approximately 68 km2. The Venafro Plain is crossed by the upper part of the Volturno River. It is delimited by the Matese Mountains to the east and by the Venafro ridge to the west. The Venafro Plain consists of talus and alluvial deposits (thickness 0-200 m). The bedrock is constituted by Mesozoic limestones (outcropping in the proximity) and Miocenic areanaceous-marly turbiditic deposits (Figure 3) [9].
Along the boundaries of the plain, where a significantly thick layer of talus deposits occurs, the sedimentary deposits have a relatively coarse grain size. In the SE part the alluvial sediments are interbedded with pyroclastic deposits.
The aquifer in the plain can be considered a single continuous body. Water circulation takes place mainly in the permeable layers, with sand and gravel-sized grains. The aquifer is unconfined; locally, pyroclastic or clayey layers generate confined sectors. It Errore. L'origine riferimento non è stata trovata.is recharged by seepage waters from limestone mountains, and global flow is in an SE direction.
1.2. The Aquifer Vulnerability Maps of the Sample Study Areas
Aquifer pollution vulnerability of the sample study areas has been assessed elsewhere using the SINTACS method [8-10]. The SINTACS method [4,5], which originally derived from DRASTIC [3], retains only the structure of the DRASTIC method in its latest release 5. It evaluates the vertical vulnerability using the same seven parameters: depth to groundwater (S), recharge action (I), attenuation capacity of the vadose zone (N), attenuation capacity of the soil (T), hydrogeologic characteristics of the aquifer media (A), hydraulic conductivity (C), and topographic slope (S). Each mapped factor is classified into scores (from 1 to 10) that have an impact on pollution potential. Weight multipliers are then used for each factor to balance and enhance their importance. The final vulnerability index (ISINTACS) is a weighted sum of the seven factors and can be computed using:
ISINTACS = SP(1,7)∙W(1,n)
where P(1,7) is the score of the 7 parameters used and W(1,n) is the weight in each class.
The five weight classes used by SINTACS depend on the hydrogeological features (porous, fissured or karstified media) and on impact condition (uncontaminated or urbanized environment). In the same map, different weight classes in different sectors can be used.
The aquifer pollution vulnerability maps of the sample areas are shown in Figures 4, 5 and 6. The range variation of each parameter and the rating assigned are shown in Table 1.
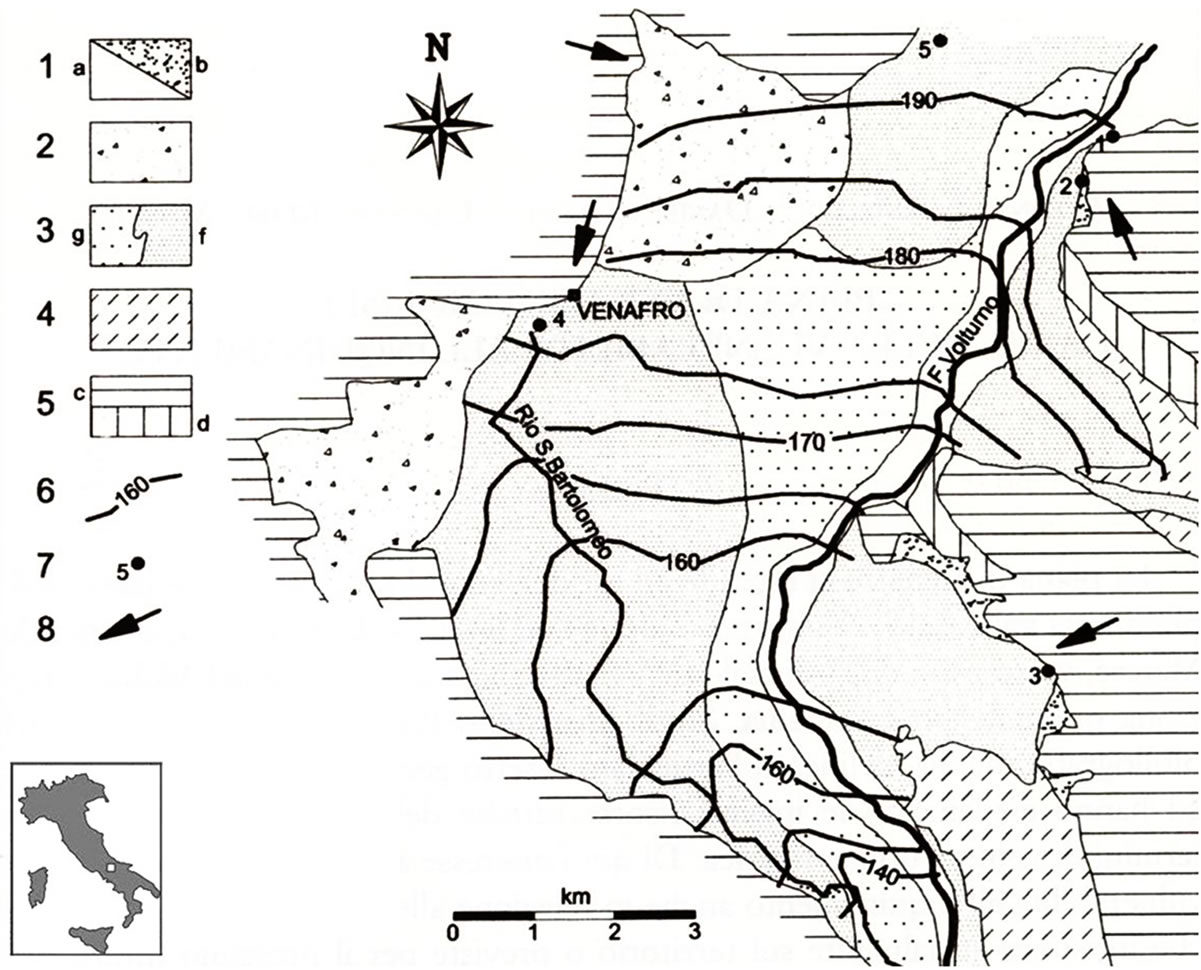
Figure 3. Hydrogeological scheme of the Venafro Plain sample area (from [9]): 1) Recent alluvial sediments (a); talus deposits (b); 2) Carbonate clasts; 3) Fine-grained (f) and coarse-grained (g) old alluvial sediments; 4) Arenaceous-marly turbiditic deposits; 5) Dolomitic limestones (c) and dolomites (d); 6) Piezometric contour lines (March 1996; in meters a.s.l.); 7) Springs; 8) Groundwater flow direction.
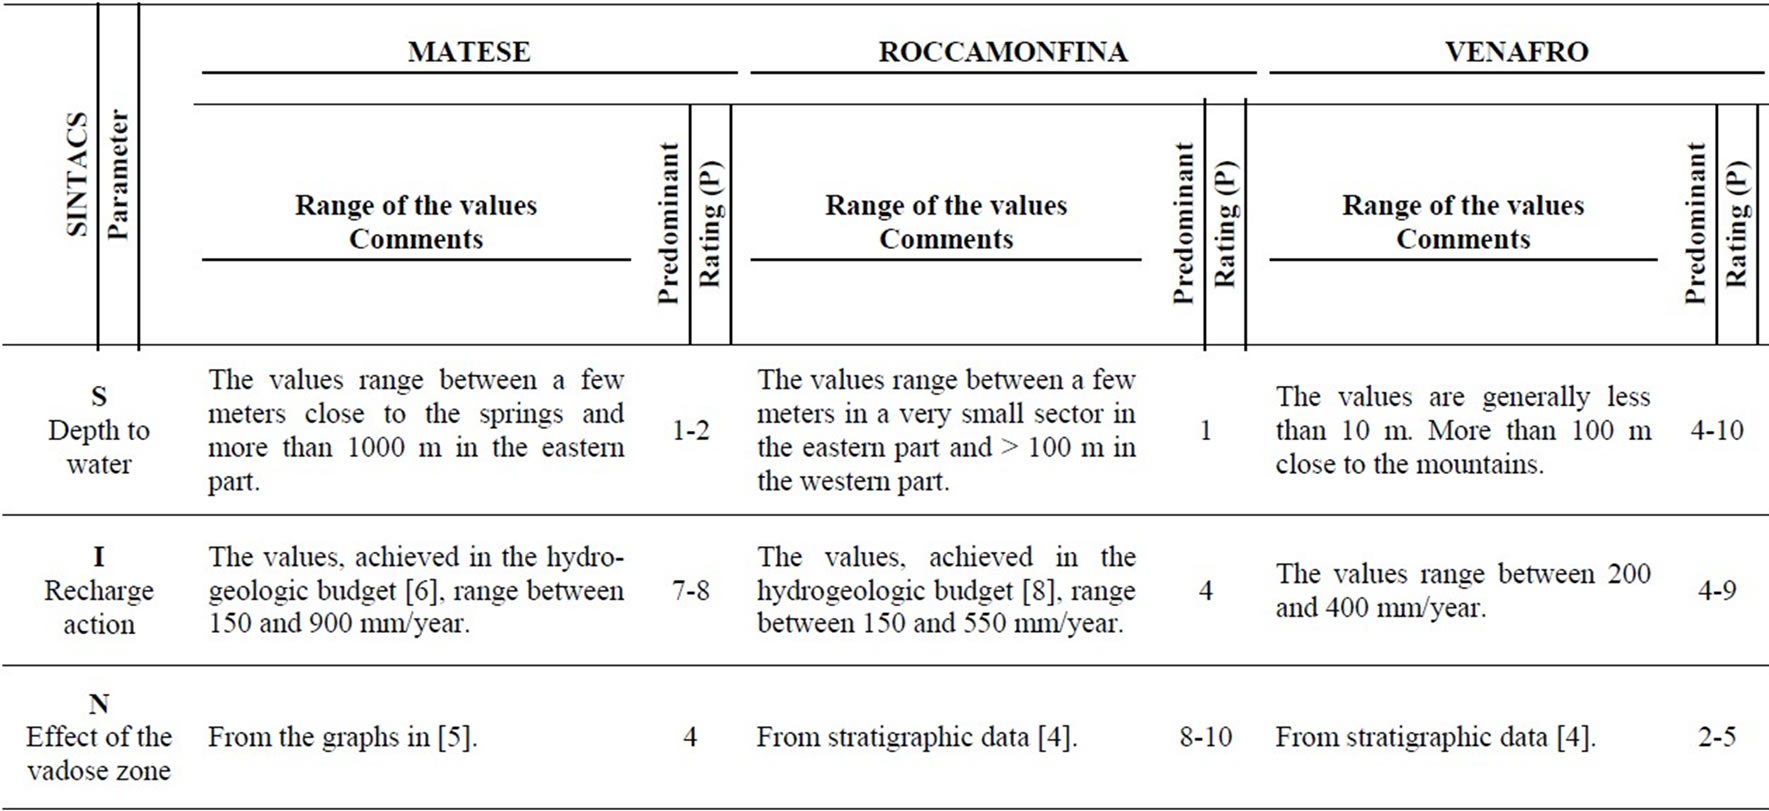
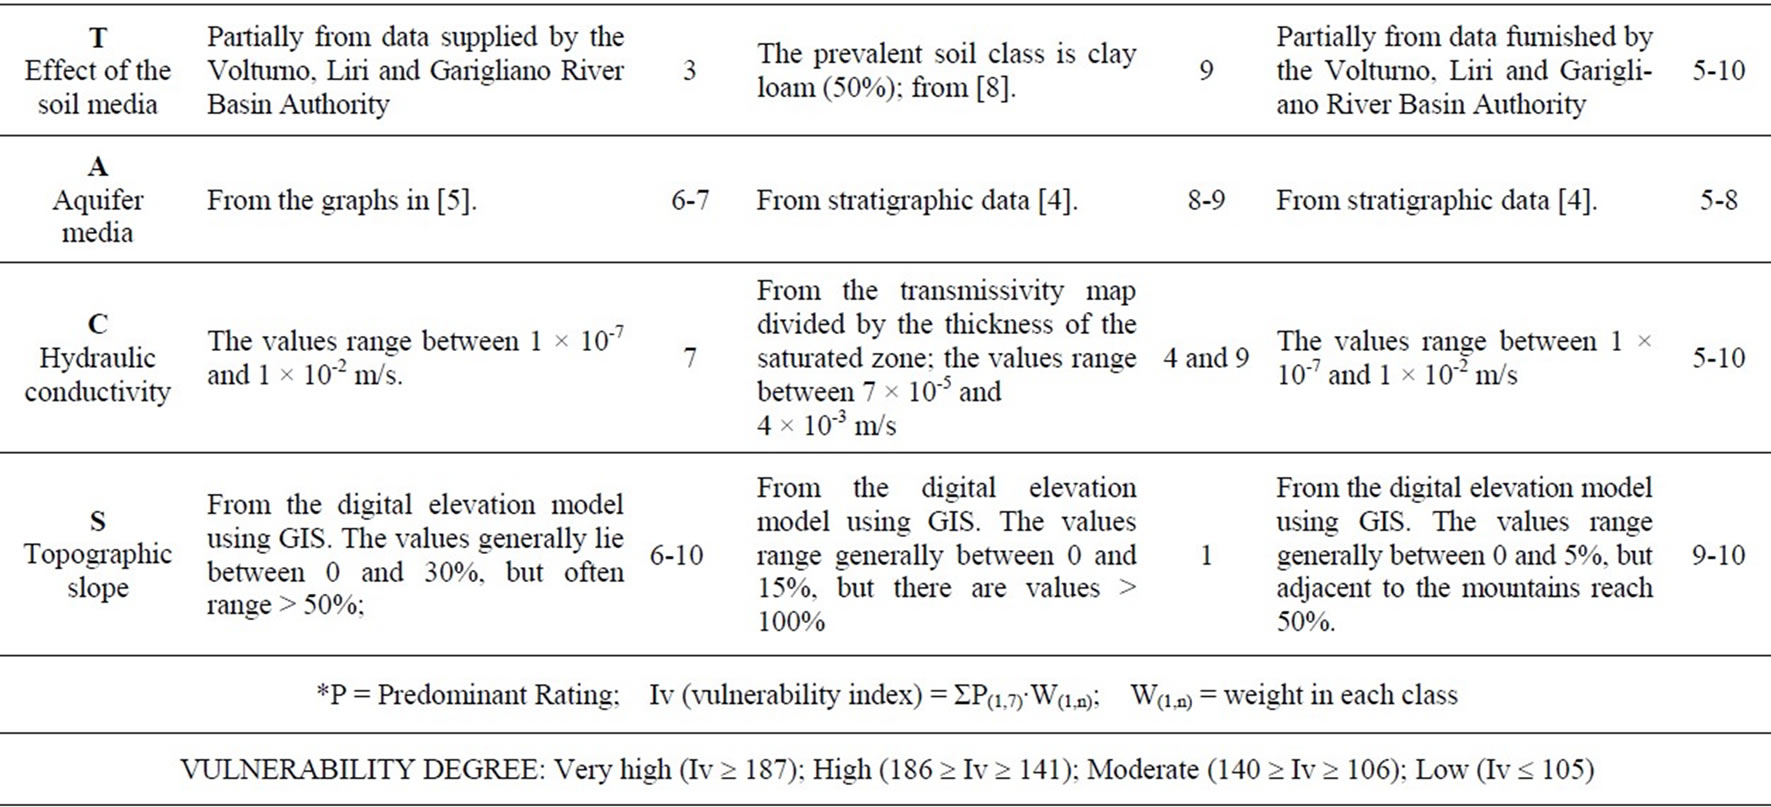
Table 1. Simplified layout of the SINTACS method for contamination vulnerability assessment. Vulnerability classes established in [5].
In the Matese area (Figure 4), the Vulnerability Index ranges between 75 and 212 in the carbonate area and between 63 and 120 in the Capriati-Prata Plain. The prevailing vulnerability degree is moderate (> 50% of the carbonate area). Areas with high vulnerability are pointed out by the SINTACS method in the sectors where karstified limestones crop out [10].
In the Roccamonfina volcano area, vulnerability was evaluated only for the southern part (Figure 5). The prevalent vulnerability degree is moderate, probably due to the high sets of weights adopted by SINTACS. Areas with high vulnerability do not appear, except for the south-eastern area, where the depth to groundwater is very shallow (the waterbody feeds the Savone river), and for the small area southwest of Teano, where limestones crop out. Even in the western sector, where the aquifer is unconfined, the vulnerability degree is low or moderate in most areas due to the high value of the parameter Depth to water (> 50 m) that strongly influences the SINTACS vulnerability index because of its large weight multipliers [7].
In the Venafro Plain area (Figure 6) the widespread vulnerability degrees are moderate or high. This is due to the unconfined character of the aquifer and to low values of the Depth to groundwater. Along the borders of the plain, at the foot of the mountains, the moderate or low degree of vulnerability is linked to a larger thickness of the vadose zone [9].
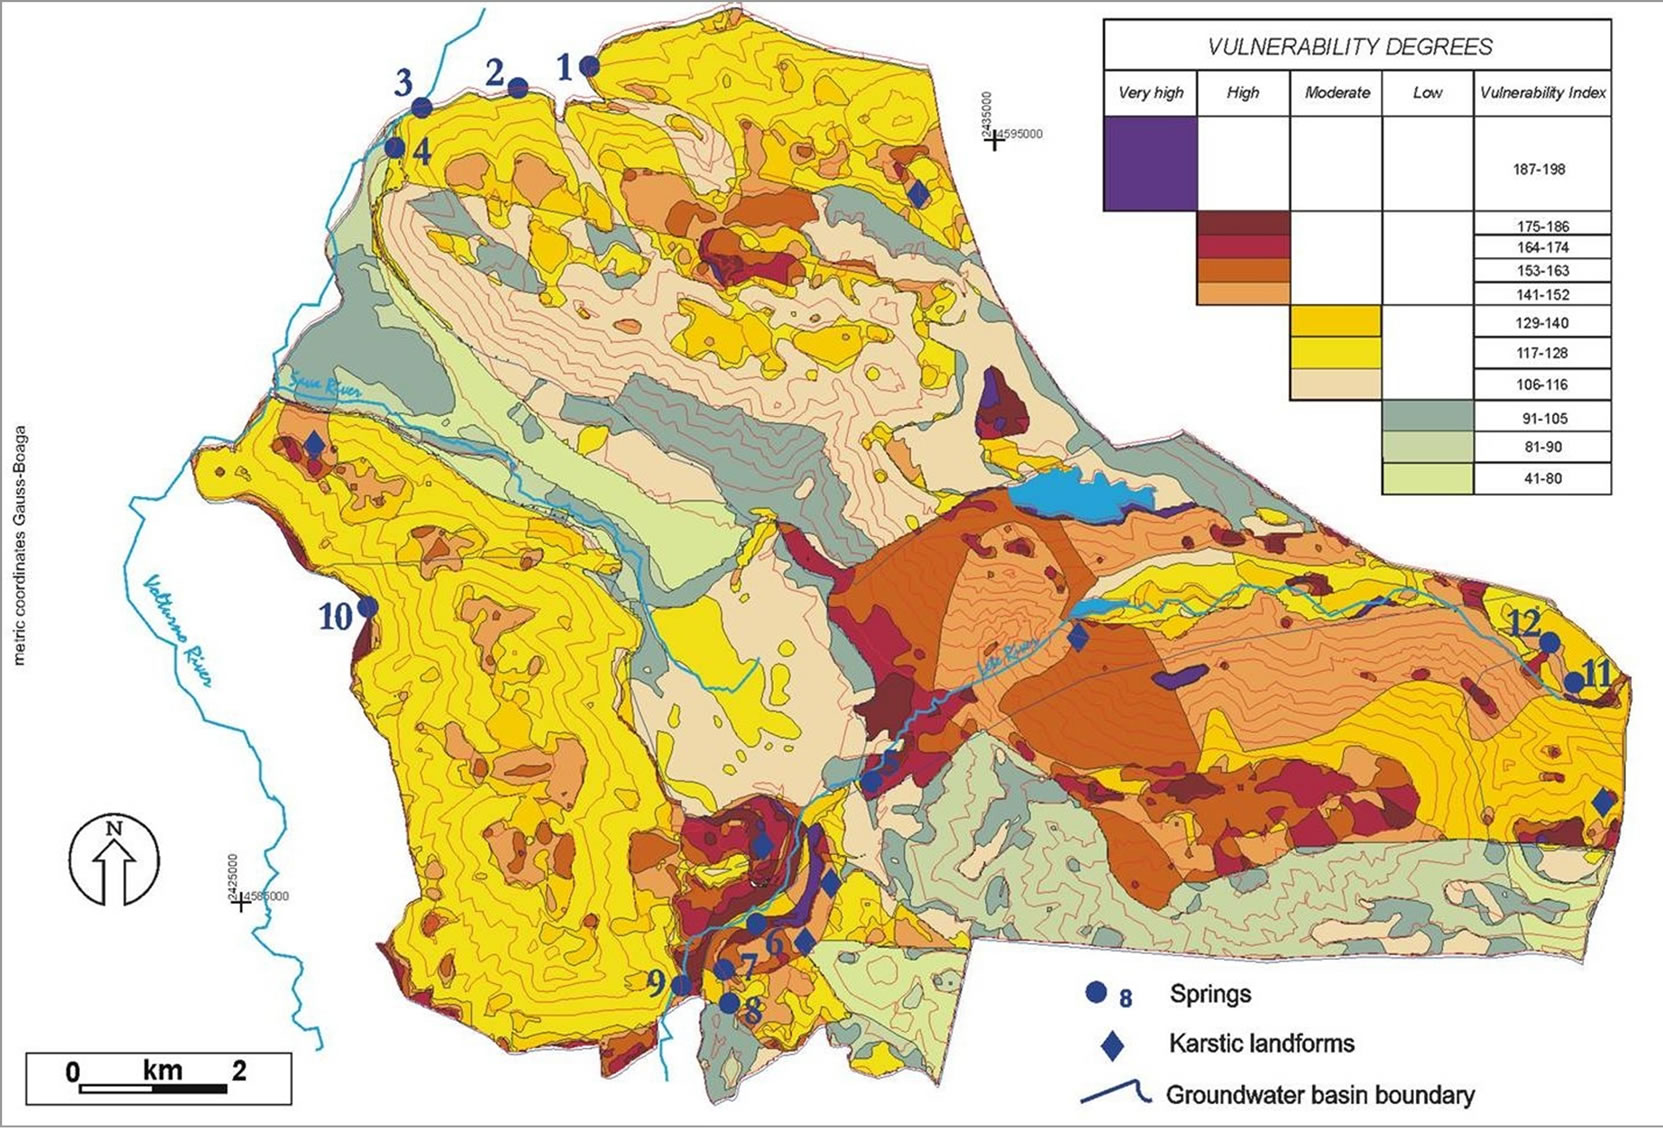
Figure 4. Matese Mts. Aquifer pollution vulnerability map computed using the SINTACS method (from [10]).
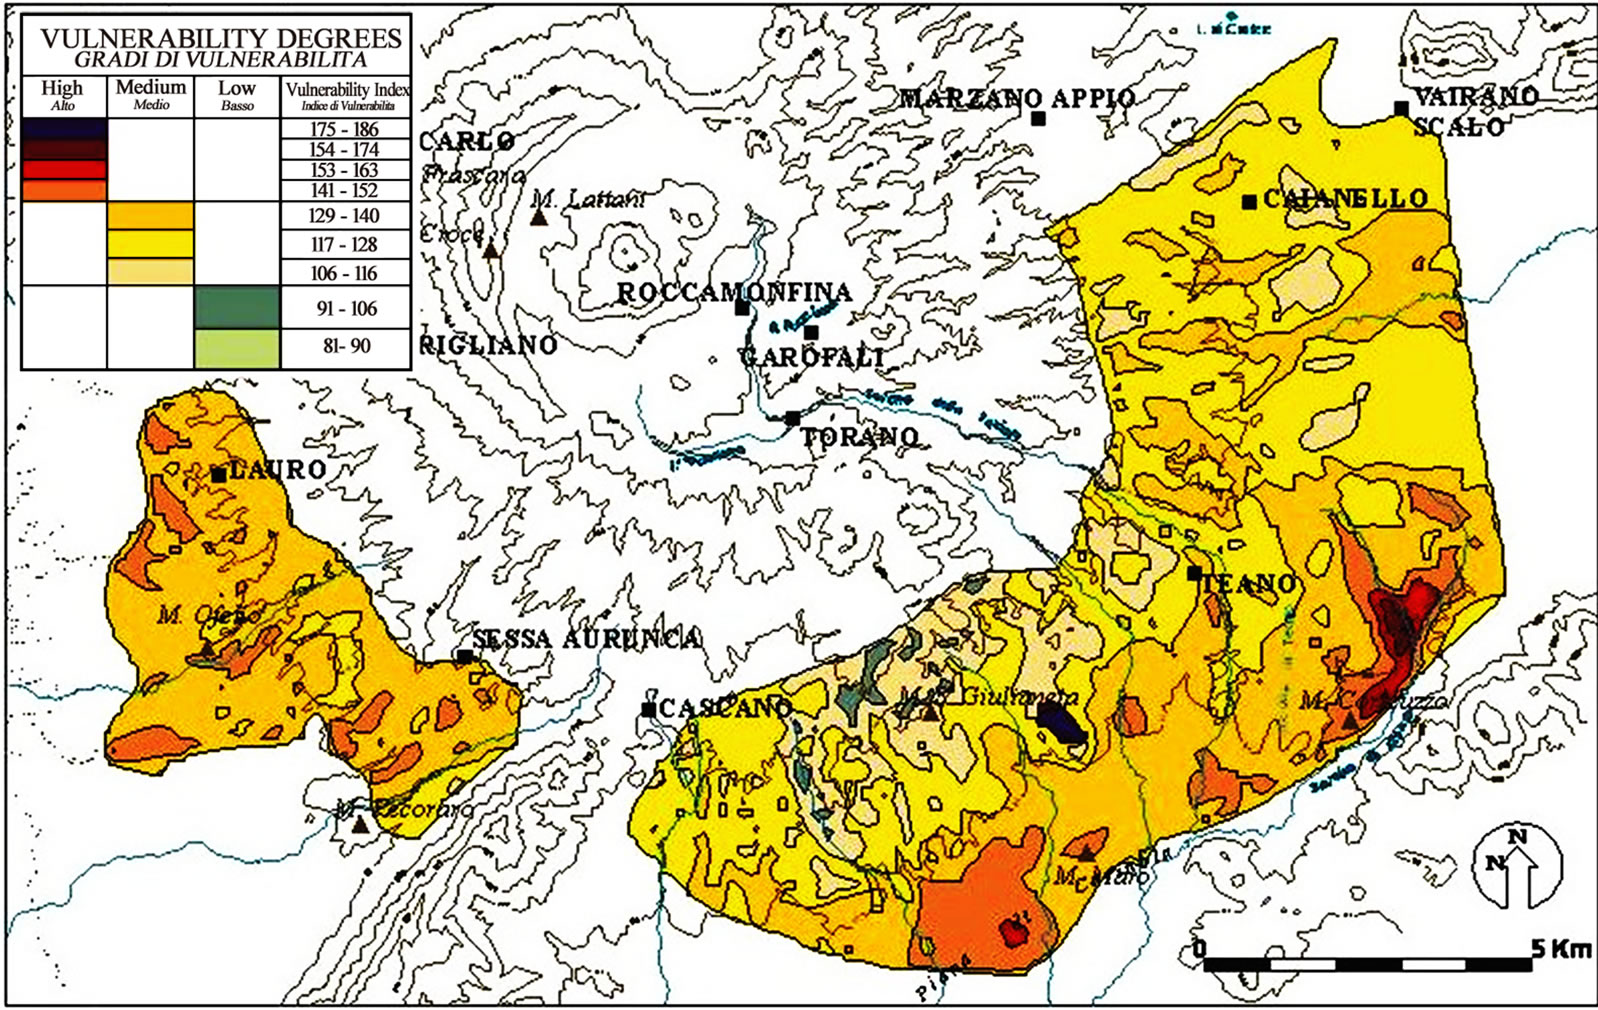
Figure 5. Roccamonfina Volcano Aquifer pollution vulnerability map computed using the SINTACS method (according to [7]).

Figure 6. Venafro Plain Aquifer pollution vulnerability map computed using the SINTACS method (according to [9]).
2. Materials and Methods
2.1. The Non-Independence Problem
This study verifies the possible non-independence of two parameters—the Aquifer media and hydraulic conductivity. Often, on applying the DRASTIC or SINTACS method the same input data and basic information are used to define the aquifer media and hydraulic conductivity parameters: hydrogeological structure, lithology, fissuretion and karst conditions of the aquifer, especially when pumping test data are lacking (see Table 1). To improve explanation of the possible non-independence in the following section, the two SINTACS parameters, aquifer media and hydraulic conductivity, are described in detail.
2.1.1. Aquifer Media
Aquifer media reflects the attenuation characteristics of the aquifer material, taking account of the mobility of the contaminant through the aquifer material. Characterization of aquifer media, like those of the vadose zone, is one of the most difficult aspects of SINTACS: problems arise as to how in practice to assign scores, deal with vertical and horizontal lithologic variability, and how to interpolate point data (well data) to generate surfaces.
M. Civita and M. de Maio [4,5] suggested calculating the weighted mean of the scores of the hydrogeologic units in order to manage vertical variability. Figure 7 shows the ratings proposed by the authors. Scores are based on the permeability of each layer of media. It is evident that high permeability is awarded a high DRASTIC and SINTACS rating.
2.1.2. Hydraulic Conductivity
The amount of water percolating to the groundwater through the vadose zone is influenced by the hydraulic conductivity of the soil media. It relates to fractures, bedding planes and voids between grains which become pathways for fluid movement. Clearly, high hydraulic conductivity indicates great movement once a contaminant has entered the aquifer. Accordingly, a high DRASTIC and SINTACS score (Figure 8(a)) is attributed.
Hydraulic conductivity can be calculated from the transmissivity data from withdrawal, pumping and slugtests (m2/s), and aquifer thickness (m). Lacking field data, the rating can be assigned according to the characteristics of the hydrogeological units, as shown in the horizontal bar chart in Figure 8(b). The variability of some units depends on the fracturing degree (volcanic rocks) and/or the development of karstic networks (limestones). The selection of the rating is based on the knowledge of the hydrogeological setting and hence on previous studies, including geomechanical and drilling data, tracer tests, and so forth.
3. Results
3.1. Comparison between Parameters
First of all, the correlation between the two parameters was evaluated; the horizontal bar chart in Figure 8(b) was linked with the graph in Figure 8(a) to obtain the conductivity rating corresponding to each hydrogeological unit, shown in the lower part of the bar chart (Figure 8(b)).
Using this modification, the ratings of conductivity and aquifer media (Figure 7) could be compared. The comparison of the ranges of all hydrogeological units demon-

Figure 7. Aquifer media ranges of the main hydrogeological units and ratings assigned by the SINTACS method (from [5]).
strates: a low correlation for glacial deposits, lavas, dolomites; a moderate correlation for pyroclastic sediments, plutonic rocks, sands and limestones; a good correlation for metamorphic rocks, clay and silt (fine-grained alluvial sediments), peat, sandstone, gravel (coarse-grained alluvial sediments). The correlations, with reference only to the hydrogeological units most commonly found in the study areas, are displayed in Figure 9. At times, the correlation proved difficult due to the wider range of ratings provided for the aquifer media parameter.
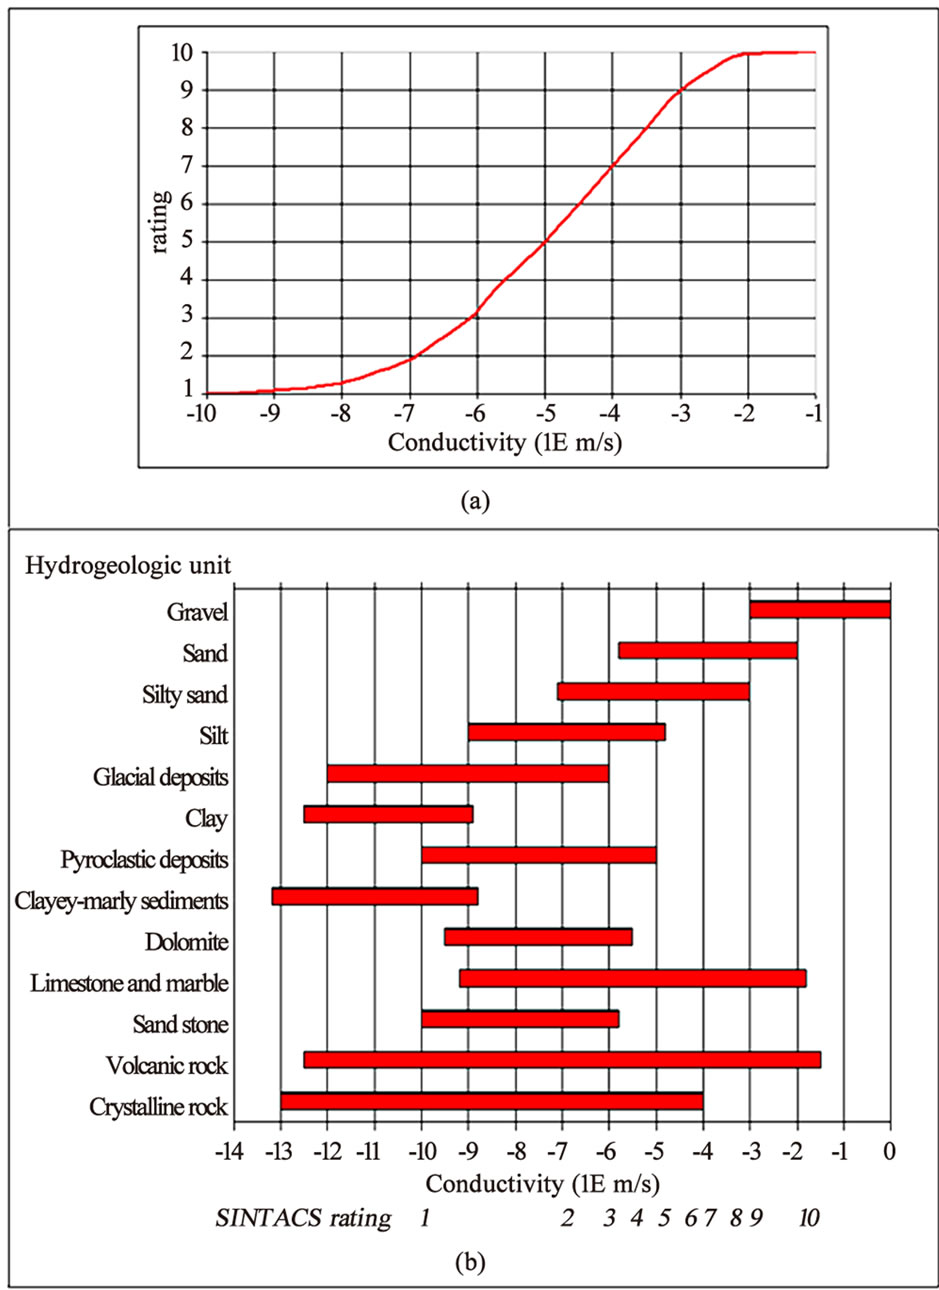
Figure 8. Hydraulic conductivity (a) values and ratings and (b) ranges of the main hydrogeological units, values and ratings assigned by the SINTACS method (according to [5], modified).
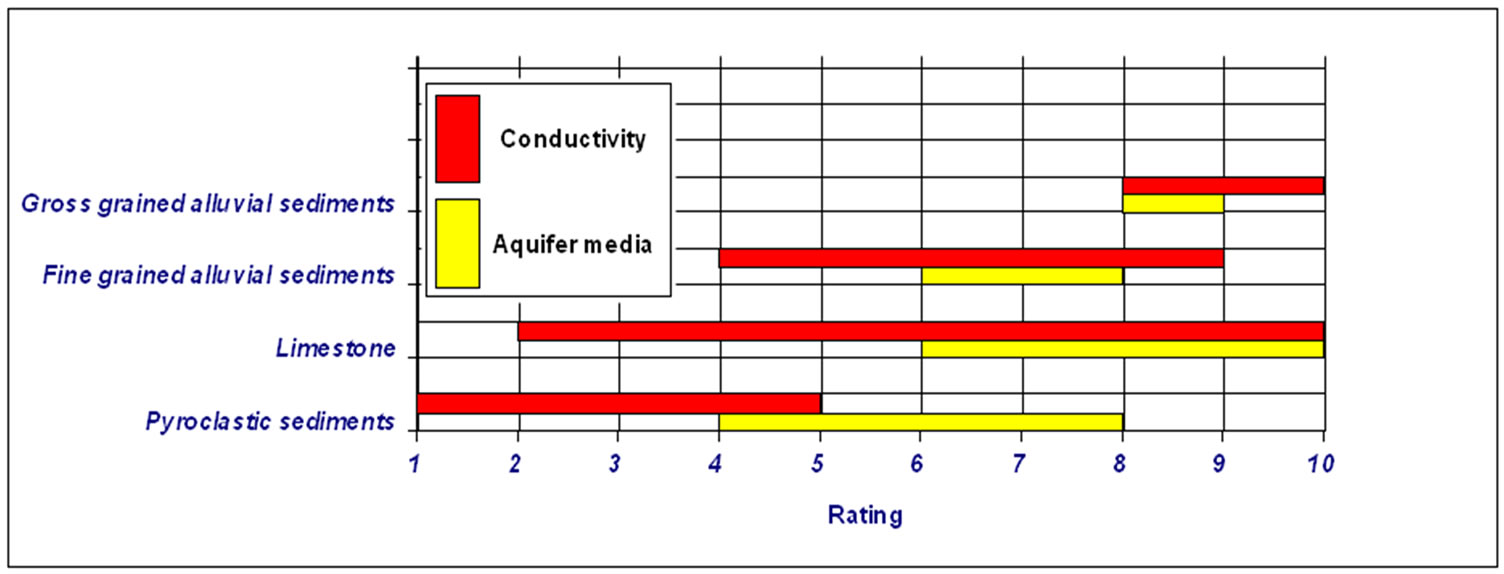
Figure 9. Hydraulic conductivity and Aquifer media ranges of the hydrogeological units present in the sample areas and ratings assigned by the SINTACS method.
3.2. Comparison between Parameter Maps of the Study Areas
The classified maps of the two parameters were then compared for each study area. Correlation analysis between conductivity and aquifer media maps was carried out using GIS, allowing spatial statistics [11]. The results are shown in the graphs represented in Figure 10, where the ratings of aquifer media are plotted against conductivity. The correlation coefficient is 0.60 in the Matese area, 0.90 in the Roccamonfina volcano area and 0.86 in the Venafro plain area.
3.3. Comparison between Vulnerability Maps: Map Removal Sensitivity Analysis
The last procedure performed to evaluate the problems related to “non-independence” in vulnerability assessment parametric methods was based on sensitivity analysis [12]. Sensitivity analysis studies the contribution of individual variables and of input parameters to the resulting output of an analytical model and permits recognition of layers which are more critical for the analysis and require more detailed input data and accuracy.
This contribution deals with the aspects related to the influence of ratings and weights assigned to the single parameters on the final overlay map. This method was preferred to uncertainty analysis [13] because it tests the sensitivity of operations between map layers. In particular, it was developed for weighted sum intersection overlays and can be easily applied to the expression to compute the DRASTIC and SINTACS indexes [14]. The procedure developed to perform the sensitivity analysis entails constructing two new vulnerability maps for each sample area: the first removing the aquifer media parameter and the second removing the conductivity parameter.
Quantitative comparison of the vulnerability maps (pixel size 30 m × 30 m) involved a normalization procedure to obtain comparable values of vulnerability degree. In fact, the possible minimum and maximum values
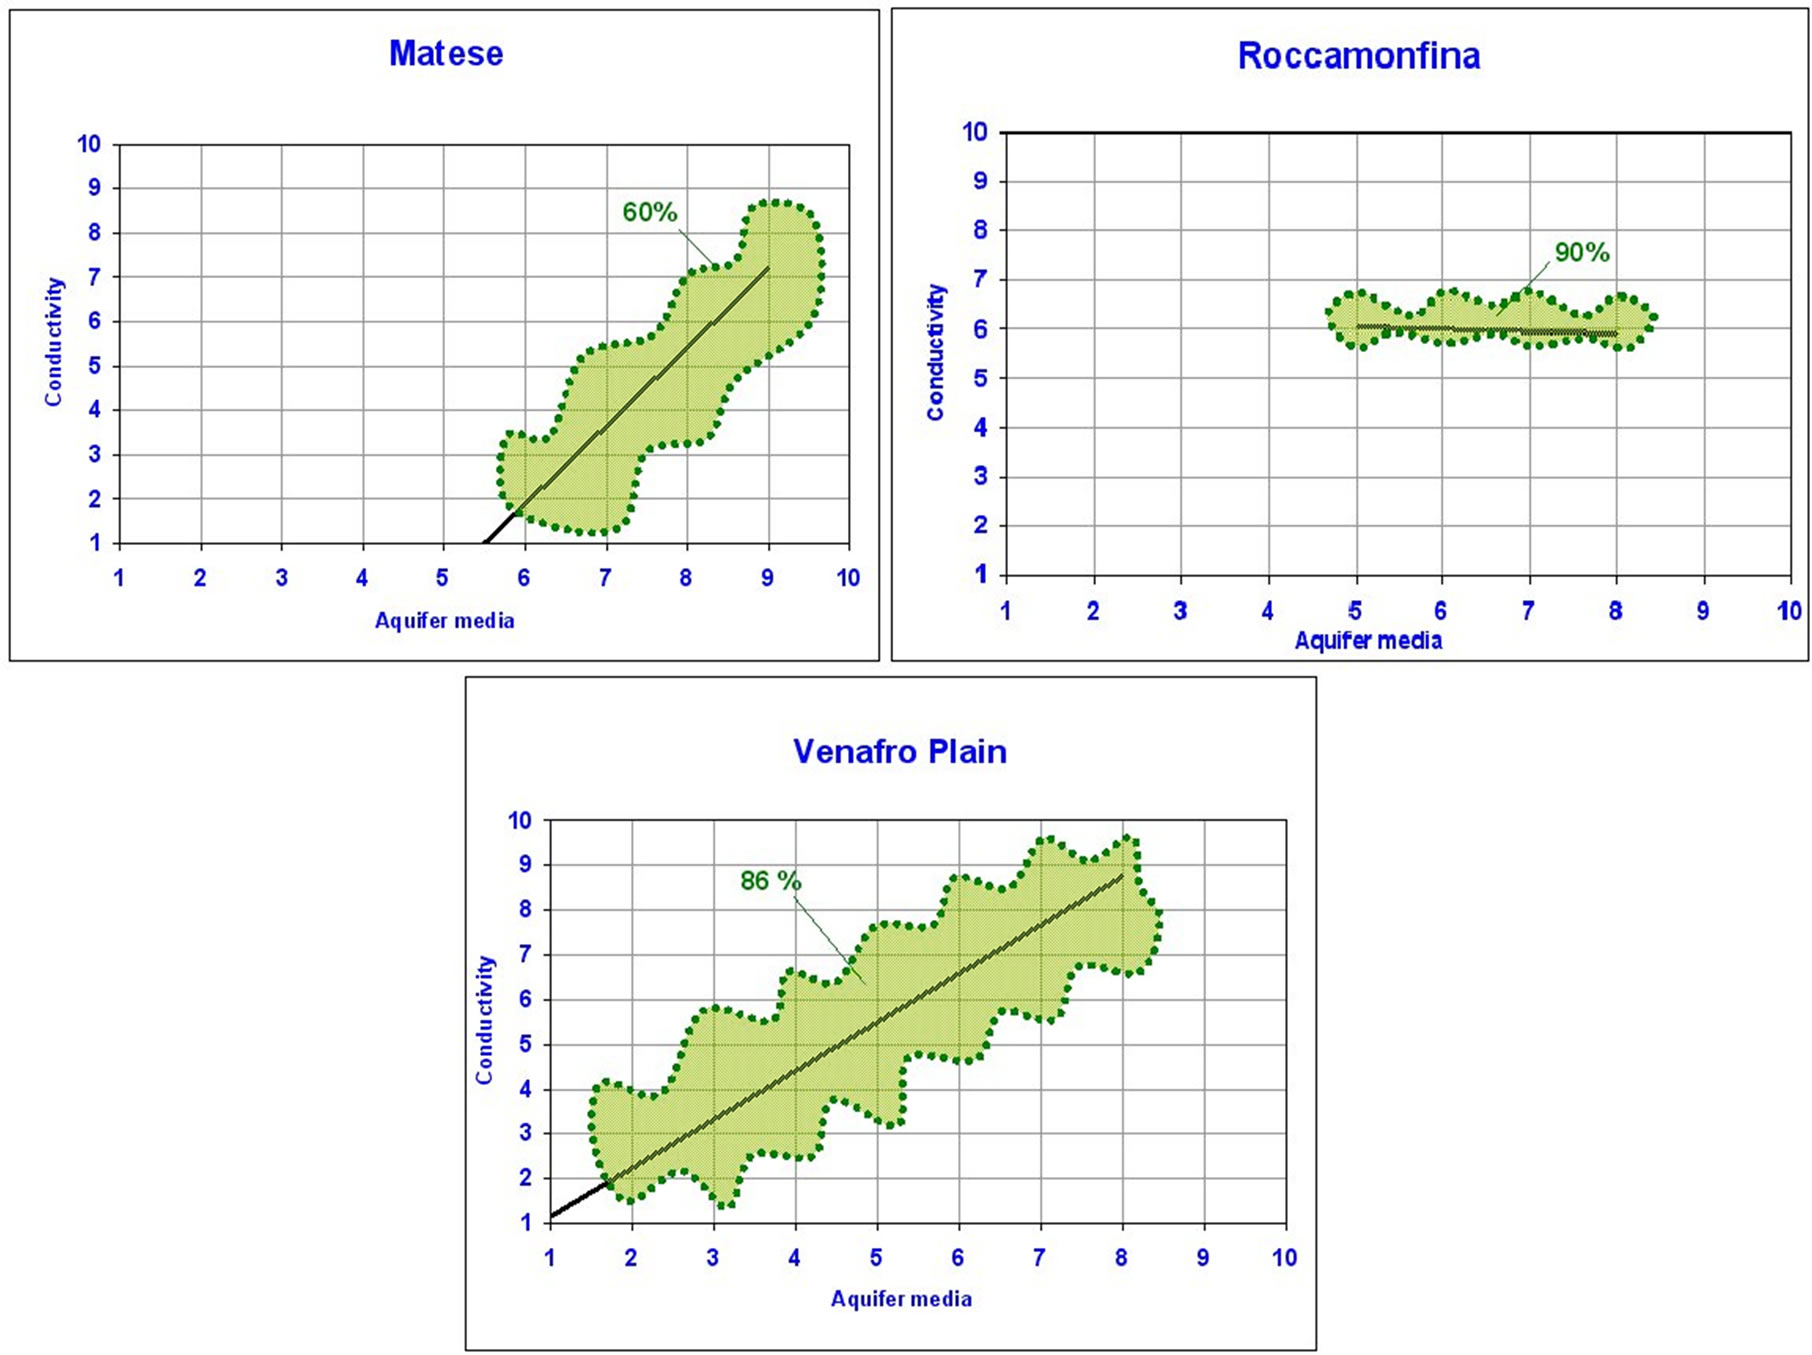
Figure 10. Ratings of Aquifer media versus Conductivity in the Matese area, in the Roccamonfina volcano area, and in the Venafro Plain area.
of SINTACS vulnerability index have to be considered: regarding a normal index range of 26-260 for the Roccamonfina and Venafro areas, the range without aquifer media or without conductivity varies between 23 and 230; for the Matese area, where the weight of the karst milieu is 5 for both parameters, the range stretches between 21 and 210.
Final interpretation is based on the analysis and comparison of the three vulnerability maps (in degree) for each area. In the Matese area the more diffused moderatehigh vulnerability degree changes into a low-moderate degree in the map without aquifer media, and into a moderate degree in the map without conductivity. The crossing operation between these raster maps (≈ 530,000 pixels) reveals a fitting of 47% between the “full” map and the map without aquifer media; of 70% between the “full” map and the map without conductivity; 42% between the map without aquifer media and the map without conductivity. Construction of a map of differences where the variation degree ranges from 0 to 2 generally shows values ≤ 1.
In the Roccamonfina volcano area the prevailing moderate vulnerability degree changes into a low-moderate degree in the maps without aquifer media and in the map without conductivity. The crossing operation between these raster maps (≈ 550,000 pixels) reveals a coincidence of 81% between the “full” map and the map without aquifer media; 75% between the “full” map and the map without conductivity; 80% between the map without aquifer media and the map without conductivity. Due to these high coincidences the map of differences is generally 0, and rarely 1.
In the Venafro Plain area the prevailing high vulnerability degree is unchanged and the maps are very similar. Crossing of the raster maps (≈ 170,000 pixels) shows a coincidence of 90% between the “full” map and the map without aquifer media; 84% between the “full” map and the map without conductivity; 89% between the map without aquifer media and the map without conductivity. The map difference is 0 almost everywhere.
4. Discussion
Interpretation of the results is based on the analysis and comparison of the vulnerability maps, representing the two layers, and the crossing tables with resulting statistics. In the Matese area the low correspondence between the maps was expected on the basis of the diagram in Figure 9, where there is a clear difference between the ratings of aquifer media and conductivity for karstified limestone. Moreover, the high weights (5) assigned to these parameters in a karstic environment increase the differences. In the Roccamonfina Volcano area the conductivity layer was derived from pumping test data (Figure 8(a)). The moderate-low vulnerability degree in this area was due to the high values of depth to water, recharge and topographic slope. The influence of aquifer media and conductivity is low because the importance of each parameter is dependent not only on the rating assigned by the SINTACS method, but also in relation to the values of the other parameters. In the Venafro plain area the correlation between the two parameters is very high and the ratings are very similar.
A general consideration on this analysis is that the removal of aquifer media and conductivity from the seven parameters generates a significant variation in the resulting vulnerability map only in the Matese area, where their removal tends to decrease the vulnerability degree. This confirms the assumption that the two parameters have to be considered non-independent. Otherwise, these layers could be both non-critical for vulnerability analysis, as in the Roccamonfina area where their importance, compared with the values of the other parameters, is low. These considerations are in contrast with [15], who found that in the Swedish study area the seven DRASTIC parameters were quite independent and hence representative enough to assess pollution vulnerability.
5. Conclusions
In this paper, the non-independence of the aquifer media and conductivity parameters in the SINTACS aquifer vulnerability assessment method was evaluated following three steps: first, the two parameters were correlated, the parameter maps of three sample areas were then compared, and finally the contribution of each of the two parameters in the final vulnerability map by map removal sensitivity analysis was assessed.
The results of the analysis indicate that aquifer media and conductivity are quite non-independent parameters in the aquifer vulnerability assessment methods, especially with the lack of field conductivity data from pumping tests . In addition, the application to three sample areas demonstrated that this dependency is greater in porous media aquifers than in fractured and karstified aquifers. Moreover, sensitivity analysis, performed using a GIS, reveals the real influence that each parameter exerts in relation to the value of the other parameters.
This confirms the validity of the SINTACS and DRASTIC methods and suggests they should be applied and developed in terms of higher accuracy in parameter definition (use of experimental data). Alternatively, fewer well-defined representative parameters should be used to assess pollution vulnerability.
REFERENCES
- A. N. Findikakis and F. Stauffer, “Groundwater: An Endangered Resource,” Proceedings of the 27th Congress of the International Association for Hydraulic Research, San Francisco, 10-15 August 1997, pp. 132-137.
- National Research Council, Committee on Techniques for Assessing Ground Water Vulnerability, Water Science and Technology Board, Commission on Geosciences, Environment, and Resources, “Ground Water Vulnerability Assessment: Predicting Relative Contamination Potential under Uncertainty,” National Academy of Sciences Press, Washington, D.C., 1993, p. 210.
- L. Aller, T. Bennet, J. H. Leher, R. J. Petty and G. Hackett, “Drastic: A Standardised System for Evaluating Groundwater Pollution Potential Using Hydrogeologic Settings,” EPA 600/2-87-035, 1987, p. 641.
- M. Civita, “Le carte della vulnerabilità degli acquiferi all'inquinamento,” Teoria e Pratica, Pitagora Bologna, 1994, p. 325.
- M. Civita and M. de Maio, “SINTACS R5-Valutazione e cartografia automatica della vulnerabilità degli acquiferi all'inquinamento con il sistema parametrico,” Pitagora Bologna, 2000, p. 226.
- A. Corniello, D. Ducci and P. M. Guarino, “I rilievi Carbonatici del Matese Occidentale e la Piana di Venafro: Idrogeologia ed Idrogeochimica,” Bollettino della Societa Geologica Italiana, 1999, pp. 523-535.
- R. Alvino, A. Corniello and D. Ducci, “Aquifer Pollution Vulnerability in the Roccamonfina Volcano Area,” Groundwater Quality: Remediation and Protection: Proceedings of Groundwater Quality Conference, Tübingen, No. 250, 21-25 September 1998, pp. 63-67.
- R. Alvino, “Idrodinamica Sotterranea e Bilancio Idrogeologico del Vulcano di Roccamonfina (Campania),” Ph.D. Thesis, Perugia University, 1997, p. 276
- A. Corniello, D. Ducci and G. M. Monti, “Piana di Venafro (Molise): Carta Della Vulnerabilità All’Inquinamento,” Atti dei Convegni Lincei, Vol. 154, 1998, pp. 311-315.
- A. Corniello and D. Ducci, “Pollution Vulnerability Assessment in Karstic Aquifers: A Case Study of the Matese Mountains,” In: O. Sililo et al., Ed., 30th International Association of Hydrogeologists Congress on Groundwater: Past Achievements and Future Challenges Cape Town, Balkema, Rotterdam, 26 November-1 December 2000, pp. 725-730.
- B. Engel, K. Navulur, B. Cooper and L. Hahn, “Estimating Groundwater Vulnerability to Nonpoint Source Pollution from Nitrates and Pesticides on a Regional Scale,” Proceedings of the HydroGIS 96 Conference: Applications of GIS in Hydrology and Water Resources Management, Vienna, Austria, 16-19 April 1996, pp. 521-526.
- W. A. Lodwick, W. Monson and L. Svoboda, “Attribute error and Sensitivity Analysis of Map Operations in Geographical Information Systems: Suitability Analysis,” International Journal of Geographical Information Science, Vol. 4, No. 4, 1990, pp. 413-428.
- G. B. M. Heuvelink, “Error propagation in Environmental Modelling with GIS,” Taylor & Francis Ltd., UK, 1998, p. 127.
- P. Napolitano and A. G. Fabbri, “Single-parameter Sensitivity Analysis for Aquifer Vulnerability Assessment Using DRASTIC & SINTACS,” HydroGIS 96: Application of Geographic Information Systems in Hydrology and Water Resources Management, Vienna, No. 235, April 1996, pp. 559-566.
- L. Rosen, “A Study of the DRASTIC Methodology with Emphasis on Swedish Conditions: Ground Water,” Vol. 32, No. 2, 1994, pp. 278-285.
- G. P. Panagopoulos, A. K. Antonakos and N. J. Lambrakis, “Optimization of the DRASTIC Method for Groundwater Vulnerability Assessment via the Use of Simple Statistical Methods and GIS,” Hydrogeology Journal, Vol. 14, No. 6, 2006, pp. 894-911.