Advances in Pure Mathematics
Vol.06 No.08(2016), Article ID:68346,9 pages
10.4236/apm.2016.68040
Estimating a Falsified Model
Andrew J. Buck, George M. Lady
Department of Economics, Temple University, Philadelphia, USA
![]()
Copyright © 2016 by authors and Scientific Research Publishing Inc.
This work is licensed under the Creative Commons Attribution International License (CC BY).
http://creativecommons.org/licenses/by/4.0/


Received 11 May 2016; accepted 11 July 2016; published 14 July 2016
ABSTRACT
It is common econometric practice to propose a system of equations, termed the “structure,” estimate each endogenous variable in the structure via a linear regression with all of the exogenous variables as arguments, and then employ one of variety of regression techniques to recapture the coefficients in the (Jacobian) arrays of the structure. A recent literature, e.g., [1] , has shown that a qualitative analysis of a model’s structural and estimated reduced form arrays can provide a robust procedure for assessing if a model’s hypothesized structure has been falsified. This paper shows that the even weaker statement of the model’s structure provided by zero restrictions on the structural arrays can be falsified, independent of the proposed nonzero entries. When this takes place, multi-stage least squares, or any procedure for estimating the structural arrays with the zero restrictions imposed, will present estimates that could not possibly have generated the data upon which the estimated reduced form is based. The examples given in the paper are based upon a Monte Carlo sampling procedure.
Keywords:
Qualitative Analysis, Regression, Model Falsification

1. Introduction
As early as [2] , if not before, it was pointed out that economic theory often only specified the directions of influence among the endogenous and exogenous variables of an economic model, as represented by a proposed sign pattern for a model’s structural arrays. Given this, the structure hypothesized by the theory could only be falsified if the proposed structure placed limits on the sign pattern of the corresponding reduced form that could be estimated directly from the data, usually by a linear regression. Both [2] and the subsequent literature, e.g., [3] , proposed that this required that given the proposed structural sign pattern, that at least some entries of the reduced form must take on particular signs, no matter what; and, if such signs were not estimated, then the structure was falsified. The analytic conditions under which the sign pattern of the structure would require specific signs for entries of the reduced form were found to be extremely restrictive, almost never satisfied, and such an analysis, called a qualitative analysis, is virtually never conducted. Recently, [1] , [4] , and [5] showed that even if particular signs in the reduced form were not required by an hypothesized structure, nevertheless limits on the estimated reduced form were always implied and any model so specified could be potentially falsified by the sign pattern of the estimated reduced form. Since current econometric practice does not call for the conduct of a qualitative analysis, a model’s falsification in these terms would not be detected. Still, for a qualitatively falsified model, when the structural arrays are estimated in turn, e.g., via multi-stage least squares, the sign pattern of the estimated structural arrays would presumably be different from the hypothesized structural arrays, although it is not clear that this outcome must always take place. An immediate issue is whether or not the sign pattern of the estimated structure is more generally consistent with that of the estimated reduced form, i.e., could possibly have generated the sign pattern of the estimated reduced form. This paper shows that the zero restrictions on the hypothesized structure can be falsified independent of the characteristics of the nonzero entries. When this happens, the estimated structure with the zero restrictions imposed could not possibly have generated the data upon which the estimated reduced form is based. As a result, without conducting a qualitative analysis, current econometric practice can estimate structural arrays that are impossible, given the outcome of the estimated reduced form. This paper presents the basis for this circumstance and an algorithmic procedure for detecting such circumstances when they occur.
2. Background
It is assumed that a model of some aspect of the economy is expressed by a system of simultaneous equations:
 (1)
(1)
where Y is an n-vector of endogenous variables and Z is an m-vector of exogenous variables. The features of this system at issue in terms of establishing its validity are studied via the method of comparative statics. This method studies the changes in the solution values of the endogenous variables as brought about by changes in the values of the exogenous variables, all expressed by a linear system of differentials:
 (2)
(2)
When these systems are brought to the data it is typical to assume that (1) is at least locally linear, and (2) is re-expressed as:
 (3)
(3)
where β, γ and δ are appropriately dimensioned matrices, with δU representing errors embodied in the data. The system (3) is usually termed the structural form and the qualitative specification of the model is provided by specifying the sign patterns of β and γ. The system is then brought to the data by its re-expression as the reduced form,
 (4)
(4)
where π = β−1γ. For all of this to be “scientific”, it must be possible to show that the hypothesized specification of (1) and (2), as re-expressed as (3) somehow limits the outcome when estimating (4), i.e., [6] . As noted above, if only the sign patterns of the structural arrays are hypothesized, it was believed that such an hypothesis could only be falsified if at least some entries of the reduced form had to have particular signs, independent of the magnitudes of the entries of the structural arrays. The recent literature cited above showed that this was not so. The point here is to reiterate this point; and further, to show that under some circumstances, a falsified model can nevertheless be worked with to estimate the entries of the structural arrays, and when this is done the estimated entries of the structural arrays could not possibly have generated the data upon which they are based.
Monte Carlo Sampling: The analytical approach we take in applying our ideas is based upon the Monte Carlo sampling procedures cited in this recent literature. This approach is first spelled out in [5] . The basic idea is to take sign patterns proposed for the structural arrays and, subject to distributional rules (uniform in the analysis reported on here) assign magnitudes to the entries and construct the reduced form as given in (4). The sampling can be done millions of times. For a particular reduced form sign pattern, the procedure notes the instances when this sign pattern shows up for a sample. If a particular reduced form sign pattern is not found for very large samples, the implication is that it is not possible, i.e., the proposed structural sign patterns impose limits that exclude it. For sufficiently small structural arrays, e.g., with reduced forms no larger than 5 × 5, a complete enumeration of all reduced form sign patterns found by the sampling can be tabulated. The results below are based upon this sampling approach.
3. A Signable Example
For the first example, it will be assumed that γ = I and,
![]() (5)
(5)
For felicitous presentation we will use “+” and “−” to denote the signs of entries, rather than the proper “1” and “−1.” This sign pattern was presented in [7] (because no column of β−1 could be entirely signed). They provided a qualitative analysis that showed that twelve of the sixteen signs in the reduced form must take on particular signs for this sign pattern, i.e., for π = β−1, for any matrix with the sign pattern of (5), regardless of the magnitudes of the nonzeros:
![]() (6)
(6)
In (6), the entries marked “?” were unsignable, and from the perspective of [7] , they could take on any nonzero signs. Accordingly, they assumed, for the given sign pattern for β in (5) that there were sixteen possible outcomes for the estimated sgn π that would have been consistent with, i.e., would not falsify, the hypothesized sign pattern, given that γ = I. This circumstance, if it related to a small, applied model, would be a great (and unusual) victory for traditional qualitative analysis. Out of 65,536 possible sign patterns for the 4 × 4 reduced form (barring zeros), only sixteen are possible if the hypothesis (5) is true.
The point here is that even in this small and signable example, problems remained. In particular, when a Monte Carlo sampling of the sign pattern (5) was conducted in [4] , two of the sixteen supposed consistent sign patterns for β−1 where not found. These were,
![]()
The entries marked “*” are the supposedly unsignable entries of (6). And, they are unsignable; however; [4] went on to show that, nevertheless, these two sign patterns could not possibly be taken on in (6), if the hypothesized (5) were true. The point there, and here, is that even though entries of the reduced form are not signable, patterns of signs may still be impossible, and if are the case for the estimated reduced form, then the hypothesized structural sign pattern has been falsified.
Still, in an applied context, if the estimated reduced form sign patterns were one of the two above, when an estimate of β was derived, e.g., via some form of multi-stage least squares, the estimated sign pattern would likely have differed from that hypothesized in (5), and the underlying qualitative analysis would not really have been necessary to falsify the hypothesis. Since the model is over-identified, an issue is whether or not the sign pattern of the estimated structure could possibly have generated the estimated reduced form. And the answer is: “maybe not.” When estimates of the structural arrays are derived, the hypothesized zero restrictions (and possibly other cardinal values, see Klein’s model 1 below) are imposed. The point here is that the zero restrictions themselves can be falsified; and, when so, any proposed structure with these restrictions imposed could not possibly have generated the data upon which the estimates are based.
For the case above, Monte Carlo sampling was conducted for γ = I and,
![]() (5*)
(5*)
In constructing the samples, the entries marked “?” in (5*) were set positive or negative randomly, with equal probability. Tens of millions of samples were constructed and of the possible 65,536 sign patterns for the 4 × 4 reduced form, only 47,807 were found. Accordingly, (assuming the Monte Carlo results are valid) if any of the 17,729 sign patterns not found had resulted for the estimated reduced form, then any estimated structural arrays with the zero restrictions imposed would have been impossible, i.e., the estimated structure could not possibly have generated the data upon which the estimated reduced form is based: The estimated model would be an impossibility.
4. Estimating a Falsified Model
To further demonstrate the central point of the paper, consider the simplest inference structure that might be presented, the case of an irreducible matrix with only one inference cycle, say for n = 4,
![]()
As before, entries marked “?” are nonzero, but can be positive or negative. For this inference structure, there is only one path of inference between any two vertices of the corresponding signed directed graph, i.e., between any two (endogenous) variables. Given the algebra of writing out the expansions of each cofactor, e.g., [8] since there are only eight (= 2n) nonzeros, results in only 28 = 256 possible sign patterns for β’s adjoint. Although when non-singular (as we always assume), the determinant can be either positive or negative, this makes no difference, since the adjoint’s sign patterns partition into two groups with one group the negative of the other. Hence, there are only 256 possible sign patterns for sgn β−1. This compared to the 216 = 65,536 sign patterns, barring zeros, that are possible for a 4 × 4 array. If any of these 256 sign patterns shows up for the estimated reduced form, then there exist structural arrays with the zero entries proposed and the nonzeros of some signs and magnitudes, e.g., a structural array that was found in the Monte Carlo’s sampling. Whether or not multi-stage least squares would always end up finding such a feasible structure is an issue beyond our scope; however, at least such a structure exists.
Our point is that if the sign pattern of the estimated reduced form is not one of the 256 sign patterns possible for any structural arrays with the proposed zero entries, then it makes no difference what structure is found by whatever method employed; that is, there does not exist a structural array with the proposed zeros that can generate the a reduced form sign pattern that is not one of the 256. Accordingly, although the model was falsified, this is not detected due to the lack of a qualitative analysis, and the estimated structure, however determined, is impossible.
Accordingly, for the structural array proposed above, the zero restrictions are falsified by the vast majority of possible reduced form sign patterns (assuming γ = I); and, should any of these be estimated, any estimates of the corresponding structural array with the zero restrictions imposed would be impossible. For this (admittedly very basic inference structure), for any value of n > 2, there are only 22n possible sign patterns for sgn β−1, which is an ever increasingly small proportion of the 2nn sign patterns that an n x n array might take on.
5. Example: Klein’s Model I
Klein’s model I, e.g., [9] , is an over-identified model that often has appeared in the literature for a variety of methodological and pedagogical reasons, including its use for a qualitative analysis. For this last, [10] and later [11] studied the relationship between the structural arrays and the corresponding reduced form. It was also subjected to a qualitative analysis in [5] . Although given Klein’s hypothesized sign patterns for the structural arrays, no entries in the corresponding reduced form were signable, some entries were “almost” signable. That is, when the expansions of the determinant and corresponding cofactors were studied, it worked out that most of the terms were of the same sign. A small number of additional assumptions about the relative size of a small number of entries, e.g., that the marginal propensity to consume was positive, but less than one, could be shown to result in the sum of the terms in the expansions at issue turning out to have a particular sign. Searching for signable entries in the reduced form based on additional, quantitative “side conditions” has a long history in conducting a qualitative analysis, e.g., [12] and [13] , since entries are virtually never signable otherwise. As a generality, the procedures involved are open ended and applied on a case by case basis.
Suppressing the error vector, Klein’s model is expressed as,
![]()
where
![]()
In this structure the endogenous variables are private consumption (C), investment (I), the private wage bill (W1), income (Y), profits or nonwage income (P), the sum of private and government wages (W), and private product (E); and the exogenous variables are the government wage bill (W2), lagged profits (P−1), end of last period capital stock (K−1), lagged private product (E−1), years since 1931 (Year), taxes (TX), and government consumption (G).
The sign patterns of the arrays proposed by Klein are as follows,
![]() (7)
(7)
As an example, the (sign pattern) of the estimated reduced form of Klein’s model is reported in [14] as
![]() (8)
(8)
Although in [14] it was not realized, in [5] it was shown that the outcome (8) was not possible for the hypothesized structure (7), based upon a qualitative analysis. Nevertheless, the nine behavioral entries in (7) can be estimated, based upon the estimated reduced form (8). Presumably, some of the signs in the estimated structure would have been different than the hypothesized signs in (7). Nevertheless, since the model is over-identified, even the signs in the estimated structure could be different, depending upon the estimation methodology utilized, and no alarm would be taken, e.g., [15] .
Our point is that the outcome of the estimated sign pattern (8) provides a decisive falsification of (7); namely, that regardless of the signs of the nine behavioral entries of (7), the sign pattern of the estimated reduced form given in (8) is impossible. In particular, for the structural arrays proposed as (7*),
![]() (7*)
(7*)
with the entries marked “?” assigned a positive or negative sign, equal probably, the sign pattern of the outcome (8) is impossible, for the signs of the other entries in (7*) imposed. Whatever structural arrays are estimated, based upon (8), they could not possibly have resulted in this sign pattern for the estimated reduced form. Accordingly, any structural arrays that are advocated, based upon (8) are impossible. They could not have generated the data upon which the estimated reduced form is based1.
6. The Oil Market Simulation (OMS)
The OMS, as in [16] and [17] , was used in the 1990s by the Department of Energy’s Energy Information Administration (EIA) in conjunction with a model of domestic energy markets in the preparation of annual long term forecasts and special studies as requested. The model’s output is the world oil price (WOP), given estimates of supply and demand in some number of regions world-wide (seven in the version of the model used by EIA). Four other equations give the demand for OPEC production as needed to balance world-wide supply and demand; and, additionally express the relationship between the WOP in terms of OPEC’s rate of capacity utilization. In general, the relationships used were nonlinear.
Remarkably, [18] conducted a qualitative analysis of the model as used by EIA and found that the corresponding reduced form was entirely signable. Further, given the generic nature of the regional supply and demand functions, the reduced form was signable regardless of the level of aggregation, i.e., it didn’t matter for signability as to how many regions the world was divided up into. [5] aggregated the model to contain only one, non-OPEC region, rendering the model one of six equations. In the format used there, and here, the structural form of the model is expressed by,
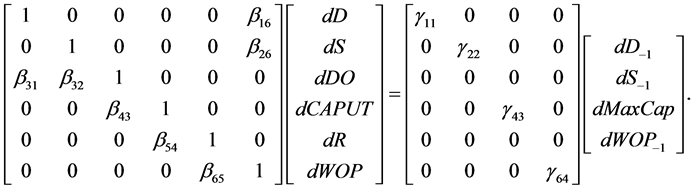
Here, D is world oil demand, S is non-OPEC world oil supply, DO is the demand for OPEC oil, CAPUT is the rate of OPEC capacity utilization, R is the percentage change (in decimal) of the current WOP over last year’s, MaxCap is maximum OPEC capacity and WOP is the world oil price. The sign patterns for the arrays are given below,
 (9)
(9)
Following [5] , [18] showed that the reduced form for this aggregated version of the model must have the following sign pattern,
 (10)
(10)
To reiterate this result, for the sign pattern of the structural arrays given in (9); and, for π = β−1γ, the sign pattern in (10) is the only possible sign pattern for the reduced form, regardless of the magnitudes of the nonzero entries of the structural arrays. [5] then estimated the reduced form based upon recent data with the following result (Table 1).
There are nine entries of the estimated reduced form with different signs than those required by the sign pattern of the hypothesized structural arrays. So, in these terms, the hypothesized structure has been falsified.
[5] did not go further and construct estimates of the structural arrays and it is beyond our scope to do so. The issue that we are raising here is if the structural arrays had been estimated, whether or not the estimated structure could have possibly generated the data upon which the estimated reduced form is based. From our analysis, we found that the answer was “no”. In particular, no arrays with the zero restrictions given in (9) could have led to the sign pattern in (10), regardless of the signs and values of the nonzeros. The sign pattern of the estimated reduced form falsifies the zero restrictions, independent of the nature of the nonzeros in (9).
This finding is based on using the Monte Carlo sampling procedure on the following arrays,
 (9)
(9)
As before, for the entries marked “?” the sampling procedure randomly selected positive or negative entries with equal probability. For the 6 × 4 reduced form, there are twenty-four bits needed to express the sign pattern (“1” for “+” and “0” for “−”); as a result, the Monte Carlo software could keep track of all of the different reduced form sign patterns found in the samples (tens of millions of sampled quantitative realizations of the structure (9*)). Altogether, there are 224 = 16,777,216 possible 6 × 4 sign patterns that the estimated reduced form could take on (barring zeros). Of these, the Monte Carlo sampling procedure only found 4,099; and, significantly, none of these had the sign pattern found above for the estimated reduced form. Accordingly, the zero restrictions have been falsified. Given this, any estimated structural arrays with these zero restrictions imposed, based

Table 1. OMS estimated (1983-2006) reduced form sign pattern.
(“*” indicates a “wrong” sign compared to the predicted reduced form sign pattern).
upon the estimated reduced form are impossible in that they could not possibly have generated the sign pattern found for the estimated reduced form.
7. Conclusions
Implicit to all of our examples have been what might be termed “impossibility theorems”. Take the first example, for the zero restrictions as expressed in (5*), 17,729 4 × 4 sign patterns were not found by the Monte Carlo sampling algorithm in tens of millions of samples, one of these is,

Accordingly, the associated impossibility theorem would be:
If γ = I,  and π = β−1γ, then
  is impossible for any nonzero entries in β corresponding to the entries marked “?”.
Similar theorems are implied by our other examples. These findings are based upon the Monte Carlo sampling procedure’s findings (or lack of findings). The decisive proof of such theorems would be a demonstration of an inconsistency in writing out the expansions of the terms in π as related to the proposed signs. In general, such demonstrations are beyond our scope. For sufficiently large samples for the Monte Carlo, the likelihood that such a demonstration cannot be made can be made vanishingly small; still, there is a likelihood, if the result is only based upon the Monte Carlo.
One way to proceed is to utilize the graph theoretic methods employed historically in investigating the signabilitity of the entries in a matrix’ inverse, based only upon the matrix’ sign pattern, e.g., [3] .
The basic point of the paper is this: not only are qualitative methods far more robust as a tool than previously thought in assessing if the sign patterns of hypothesized structural arrays are falsified by the sign pattern of the estimated reduced form; but, the potential for falsification can be even more general. Namely, that the zero restrictions on the structural arrays can be falsified, independent of the sign pattern of the nonzero entries. When this takes place, any estimates of the structural arrays with the zero restrictions imposed are impossible. (Such as) the Monte Carlo econometric practice to avoid such invalid derivations.
Cite this paper
Andrew J. Buck,George M. Lady, (2016) Estimating a Falsified Model. Advances in Pure Mathematics,06,523-531. doi: 10.4236/apm.2016.68040
References
- 1. Lady, G. (1995) Robust Economic Models. Journal of Economic Dynamics and Control, 19, 481-501.
http://dx.doi.org/10.1016/0165-1889(94)00791-f - 2. Goldberger, A.S. (1964) Econometric Theory. John Wiley and Sons.
- 3. Berndt, E. (1996) The Practice of Econometrics: Classic and Contemporary. Addison-Wesley Publishing Co.
- 4. System’s Science, Inc. (1985) The Oil Market Simulation Model, Documentation Report. DOE/EI/19656-2.
- 5. Energy Information Administration (1990) Oil Market Simulation User’s Manuel. DOE/EIA-M028(90), Washington DC.
- 6. Hale, D. and Lady, G. (1995) Qualitative Comparative Statics and Audits of Model Performance. Linear Algebra and Its Applications, 217, 141-154.
http://dx.doi.org/10.1016/0024-3795(94)00125-w - 7. Ritschard, G. (1983) Computable Qualitative Comparative Statics Techniques. Econometrica, 51, 1145-1168.
http://dx.doi.org/10.2307/1912056 - 8. Lady, G. (2000) Topics in Nonparametric Comparative Statics and Stability. International Advances in Economic Research, 5, 67-83.
http://dx.doi.org/10.1007/bf02295752 - 9. Maybee, J. and Weiner, G. (1988) From Qualitative Matrices to Quantitative Restrictions. Linear and Multilinear Algebra, 22, 229-248.
http://dx.doi.org/10.1080/03081088808817837 - 10. Klein, L. (1950) Economic Fluctuations in the U.S., 1921-1941. Cowles Commission for Research in Economics Monograph No. 11, John Wiley and Sons.
- 11. Maybee, J. (1966) New Generalizations of Jacobi Matrices. SIAM Journal of Applied Mathematics, 14, 1032-1037.
http://dx.doi.org/10.1137/0114083 - 12. Lady, G. and Maybee, J. (1983) Qualitatively Invertible Matrices. Mathematical Social Sciences, 6, 397-407.
http://dx.doi.org/10.1016/0165-4896(83)90069-0 - 13. Popper, K. (1959) The Logic of Scientific Discovery. Harper and Row. (Reprint)
- 14. Lady, G. and Buck, A. (2011) Structural Models, Information and Inherited Restrictions. Economic Modelling, 28, 2820-2831.
http://dx.doi.org/10.1016/j.econmod.2011.08.021 - 15. Buck, A. and Lady, G. (2012) Structural Sign Patterns and Reduced Form Restrictions. Economic Modelling, 29, 462-470.
http://dx.doi.org/10.1016/j.econmod.2011.12.003 - 16. Hale, D., Lady, G., Maybee, J. and Quirk, J. (1999) Nonparametric Comparative Statics and Stability, Princeton. Princeton University Press.
- 17. Samuelson, P. (1947) Foundations of Economic Analysis. Harvard University Press.
- 18. Buck, A. and Lady, G. (2015) A New Approach to Model Verification, Falsification and Selection. Econometrics, 3, 466-493.
http://dx.doi.org/10.3390/econometrics3030466
NOTES

1The degree to which errors in the data could produce such results is briefly noted in [1] .