Atmospheric and Climate Sciences
Vol.3 No.4A(2013), Article ID:38835,7 pages DOI:10.4236/acs.2013.34A002
Effects of Solid Waste on Urban Warming in Warri Metropolis, Nigeria
Department of Geography and Regional Planning, Delta State University, Abraka, Nigeria
Email: efesundayighovie@yahoo.com, akosuakoyoo@yahoo.com, collinsojoh@yahoo.com
Copyright © 2013 Sunday Ighovie Efe et al. This is an open access article distributed under the Creative Commons Attribution License, which permits unrestricted use, distribution, and reproduction in any medium, provided the original work is properly cited.
Received September 20, 2013; revised October 17, 2013; accepted October 25, 2013
Keywords: Urban Warming; Waste Generation; Urban Heat Island; Warri Metropolis
ABSTRACT
This study examined the effects of solid waste on urban warming in Warri metropolis. To achieve this, the study generated data from field measurements of volume of waste generated and greenhouse gases. The data were collected from five (5) major waste dump sites in Warri metropolis. The data generated were analysed using bivariate correlation and multiple regression. Results obtained revealed that 25.1% of waste generated in Warri metropolis was found in the commercial areas of the metropolis while 4.3% of the waste generated was recorded in the low density Areas, 19.7% of the waste generated was found in the high density area (Okumagba, Ugborikoko, Enerhen village, Airport road and upper/lower Eredjuwa) and the remaining 51.9% was generated in the industrial, traditional and fringe zones of Warri metropolis. Warri metropolis has an urban bias of 4.16˚C. There is a significant relationship between temperature and volume of waste generated at R value of 0.722. The temperature in Warri metropolis is significantly dependent on greenhouse gases emitted at P < 0.05. It is therefore, recommended that programmes to sensitize and sustain the waste management concepts among communities through media be established.
1. Introduction
The waste generation scenario in Nigeria has been of great concern globally and locally [1]. An average Nigerian in his household, institution and industry encounters some tones of solid waste yearly. Several Nigerians have considered it a cheap way of disposing off their solid waste by setting the mixed waste on fire in a little corner in their backyard or in a very open place resulting in the release of Greenhouse Gases (GHG) which is harmful to urban climate.
The rate of waste generation is highly influenced by the income of the populace [1]. In Nigeria, over 25 million tonnes of municipal solid waste are generated annually [2]. The role of methane in global atmospheric changes has received increasing attention recently. Methane from landfills contributes significantly to annual global emissions of (GHG) Greenhouse Gases.
Agbola and Jinadu [3] estimated that each person in Nigeria generates an average of 0.0005 tonnes of waste daily. The amount of solid waste generation rates ranges from less than 0.1 tonnes per capita per year in low income countries to less than 0.8 tonnes per capital per year in high income industrialized countries [4].
In Warri metropolis, some of the dump sites are deliberately set on fire by dump site managers, scavengers and individuals in order to reduce the volume of the waste, to allow more waste to be disposed there. The fire from the waste dump in turn pollutes the atmosphere, thereby increasing the concentration of carbon dioxide (CO2), methane (CH4) etc. in the area. The decomposition of organic materials produces methane, which can cause fire and explosions, and contributes to global warming.
Fire is periodically set on by dump site manager in open dumps, generating smoke and contributing to air pollution. For example, in one of the waste dump sites at the Effurun-PTI express way, fire burned for over 3 days at the local open dump. This could lead to increased urban temperatures in Warri. Furthermore, the waste dump sites in Warri destroy the beauty of the area, thus reducing the aesthetic beauty. It is against this background that there is a need to study the ever increasing contribution of solid waste to urban warming. This paper examines the effects of solid waste generation on urban warming in Warri and environs, so as to provide necessary answers to the questions raised.
2. Study Area
Warri metropolis is located between latitude 5˚30'N and 5˚35'N and Longitude 5˚29'E and 5˚48'E. The areal expansion of Warri during the past two decades has been remarkable. Warri has grown to cover the surrounding towns of Effurun, Ekpan, Enerhen, Edjeba, Ogunu, Jakpa, Ovwian-Aladja, Udu Road, etc. with an areal expansion of over 100 sqr.km [5]. This areal expansion has led to increase in temperature and precipitation in the area [6].
The area is characterized by hydromorphic soils, which is a mixture of coarse alluvial and colluvial deposits. The indiscriminate dumping of waste on the soil enhances anaerobic processes more, leading to the release of (CH4) methane to the atmosphere resulting to urban warming.
The area is characterized by tropical equatorial climate with mean annual temperature of 32.8˚C and annual rainfall amount of 2673.8 mm. Rainfall period ranges from January-December, with the minimum value of 8.2 mm in January and over 536.6 mm in September. There are high temperatures of 36˚C and 37˚C in the heavily built up and traffic congested areas of Enerhen junction, Enerhen road area, Estate, Okere road areas, Jakpa junction, Jakpa roads areas, Hausa quarters and Igbudu market areas respectively [7]. The temperature has led to an increase in urban micro heat island.
Warri metropolis is one of the rapidly growing cities in Nigeria, with a population rising rapidly from 19,526 in 1933, 55,256 in 1963, 280,000 in 1980, 500,000 in 1991 to 536,023 in 2006 [5]. The population growth will lead to an increase in the amount of solid waste generated which will potentially escalate Methane emission from solid waste and further leads to urban warming
3. Conceptual Issues
The links between urbanization, waste and global climate change are complex [8]. The irregular dumping of waste will tend to increase temperatures in the city thus causing urban warming. One of the most well-known anthropogenic climate modifications is the phenomenon of urban heat Island (see Figure 1).
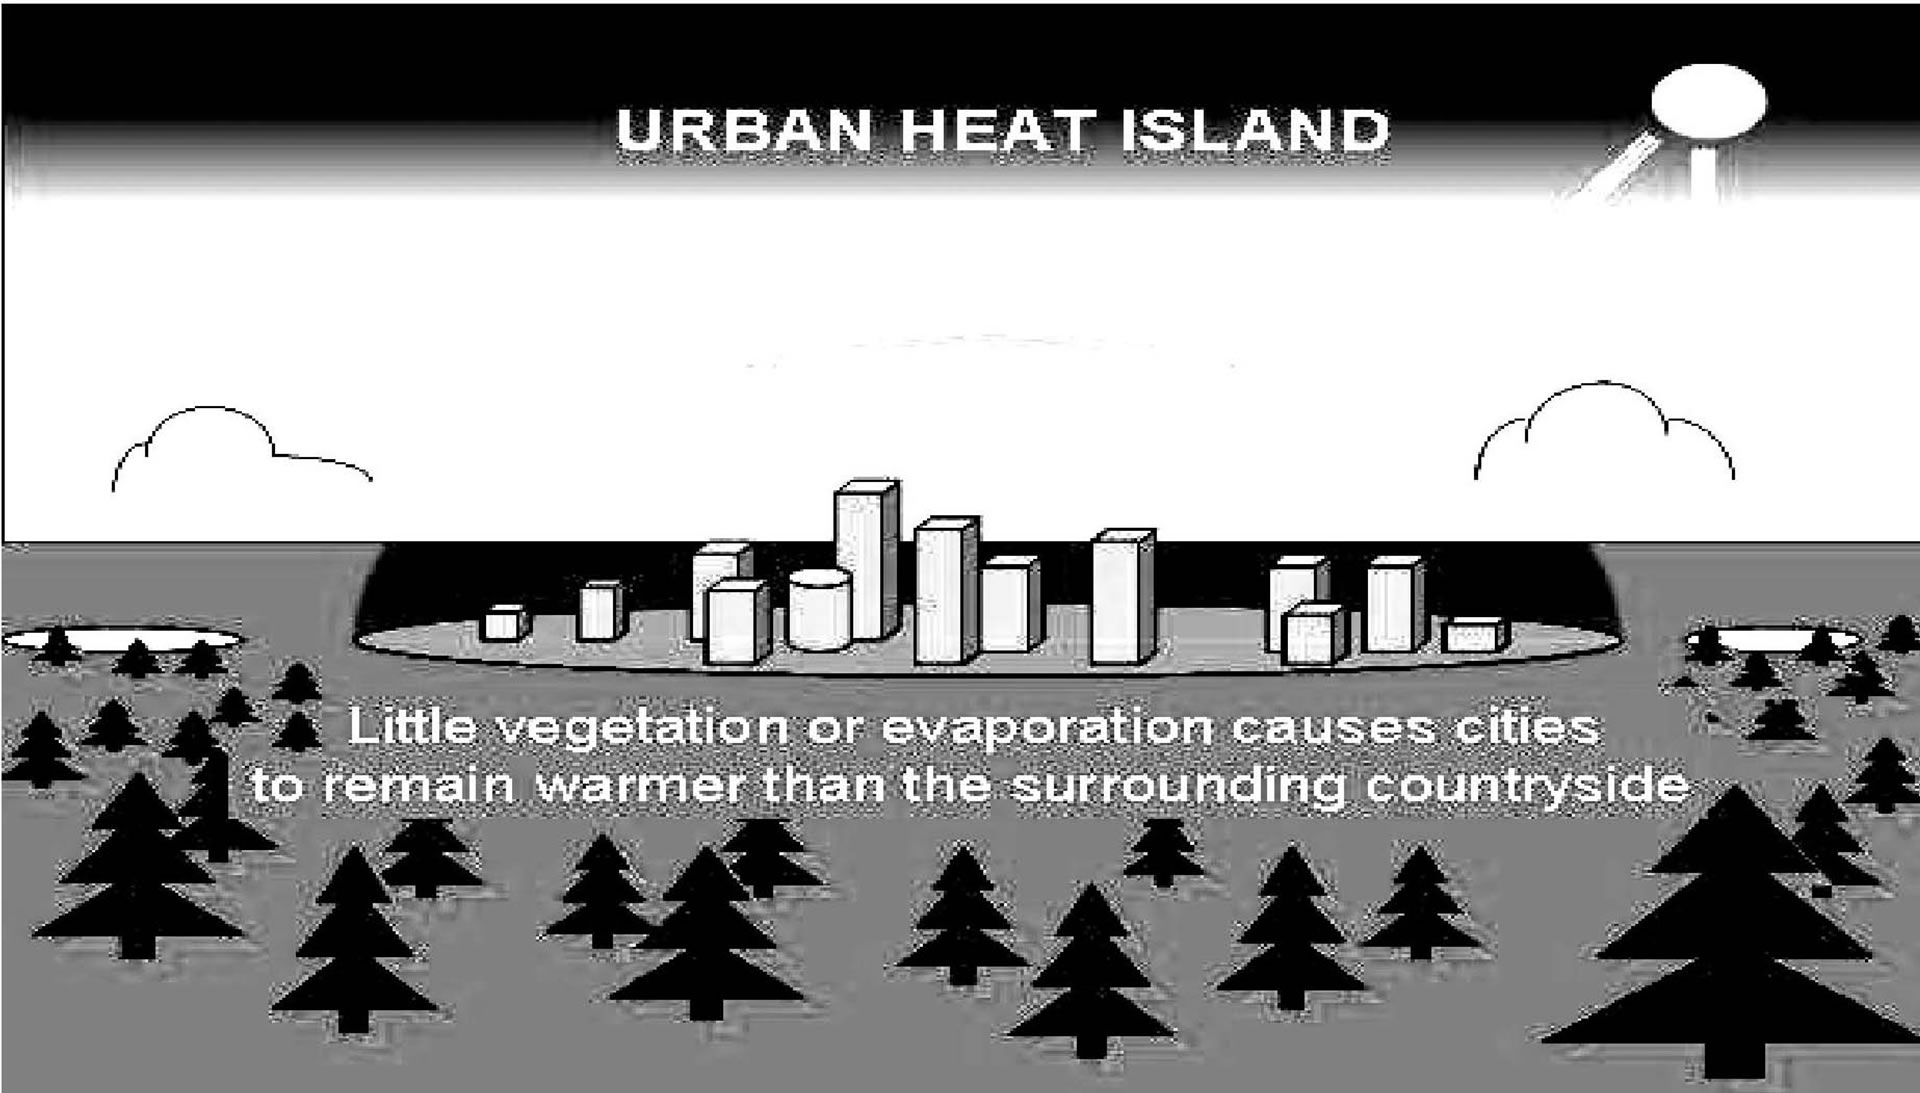
Figure 1. Urban heat island.
The best-known urban effect of such development is urban warming; globally cities are almost always warmer than the surrounding rural area [9]. The magnitude of urban warming is highly variable over both time and space. According to Fuchs [10] the main cause of urban heat island is the modification of the land surface by urban development, waste heat generated. The form and intensity of the UHI varies temporally and spatially depending on local/regional meteorological, geographical, and urban development characteristics [11] and is a complex function of many interacting variables [12].
Methane is the most significant greenhouse gas produced in the disposal and treatment of municipal and industrial solid waste is methane [13]. Methane (CH4) is generated as a result of degradation of organic material under anaerobic conditions. Part of the CH4 generated is oxidised in the cover of the solid waste disposal sites, or can be recovered for energy or flaring. The CH4 actually emitted from the solid waste disposal sites will hence be smaller than the amount generated.
The major factors affecting methane (CH4) emissions from municipal solid wastes are mainly, the amount of waste generated, the composition of the waste, the conditions under which the waste is disposed, and the climate of the region under study [14]. Moreso, all the factors, except the last, are dependent one way or the other on the socio-economic characteristics of the region.
4. Methods and Materials
The procedure adopted for the collection of data was full range of concurrent temperatures, GHG emissions and waste measurements. The temperature measurement was carried out at an intermediate standard observation hour of 900, 1200, 1500 and 1800 GMT. These hours selected for measurement is in line with the World Meteorological Organisation standards [15]. The temperature reading was taken at 1.5 m above waste dumps at the four major waste dump sites for a period of two months (January and February) on a weekly basis in 2011.
The greenhouse gases were measured during early hours of morning (7 am) and evenings (7 pm). This time duration were selected as a result of the volatile nature of the gases. For the Hydrocarbons/volatile organic compounds (CxHy/VOC), Nitrogen Oxides (NOx), Sulphur Oxides (SOx) and Carbon Monoxide (CO) measurements, a Testo 350 flue gas analyser was used. It performs automatic analysis of ambient air through the use of physical properties, giving cyclic or continuous output signal. Air is continuously extracted from the atmosphere and the sample is sent to the analyser for the determination of the pollutant gas of interest.
Moreso, measurement of waste volumes was carried out at the five major waste dump sites in 25 neighbourhoods on weekly basis for two (2) months. The five (5)
wastes dump sites are as follows; Igbudu market, Orhuwhorun, Iyara, Army barracks and Okuokoko. To ensure adequate measurement the quadrat technique was adopted where a quadrat of 1 m × 1 m is thrown on the waste at each sample sites, thus making a total of 1458 quadrats in all (see Table 1).
Before this was done, the area of waste occupancy was measured using a measuring tape. After which, the waste in the selected quadrat area was scooped and further placed into a trash bin whose weight has been measured already. This was done so as to anticipate the actual volume of the waste scooped. In doing so the trash bin was suspended on a spring balance instrument, so as to get the volume of the waste. Thereafter, the volume of the trash bin was subtracted, so as to get the net volume of the waste. Furthermore, the net volume was multiplied by the number of quadrat squares in the area occupied by waste. Thereafter, the sample was used to multiply the number of quadrat squares in the study site to get the total volume of waste generated.
The waste scooped into the waste bin was further segregated to identify the various waste categories using alphabetical notation such as follows: A = Leaves, B = Paper, C = Metals, D = Glass, E = Rags, F = Plastics, G = Dust, H = Wood, I = Moisture (Organic waste). These alphabetical notations were used based on convenience and as the typical nature of solid waste in Nigerian cities [16]. After the segregation and separation of the waste, it was further measured so as to get the volume of the various waste categories. To ensure an adequate study on the distribution of waste in Warri metropolis, waste bins were placed in a household in each of the twenty-five (25) neighbourhoods. These waste bins were measured on a weekly basis for two months and the net volume of the waste were measured and recorded.
Data on temperature and volume of waste were analysed using the bivariate correlation analysis. While the data on temperature and greenhouse gases emitted were analysed using the multiple regression analysis. These data was entered in Statistical Package for Social Sciences (SPSS) version 19 and double checked before analysis.
5. Results and Discussion
Table 2 shows the household waste generated in Warri metropolis.
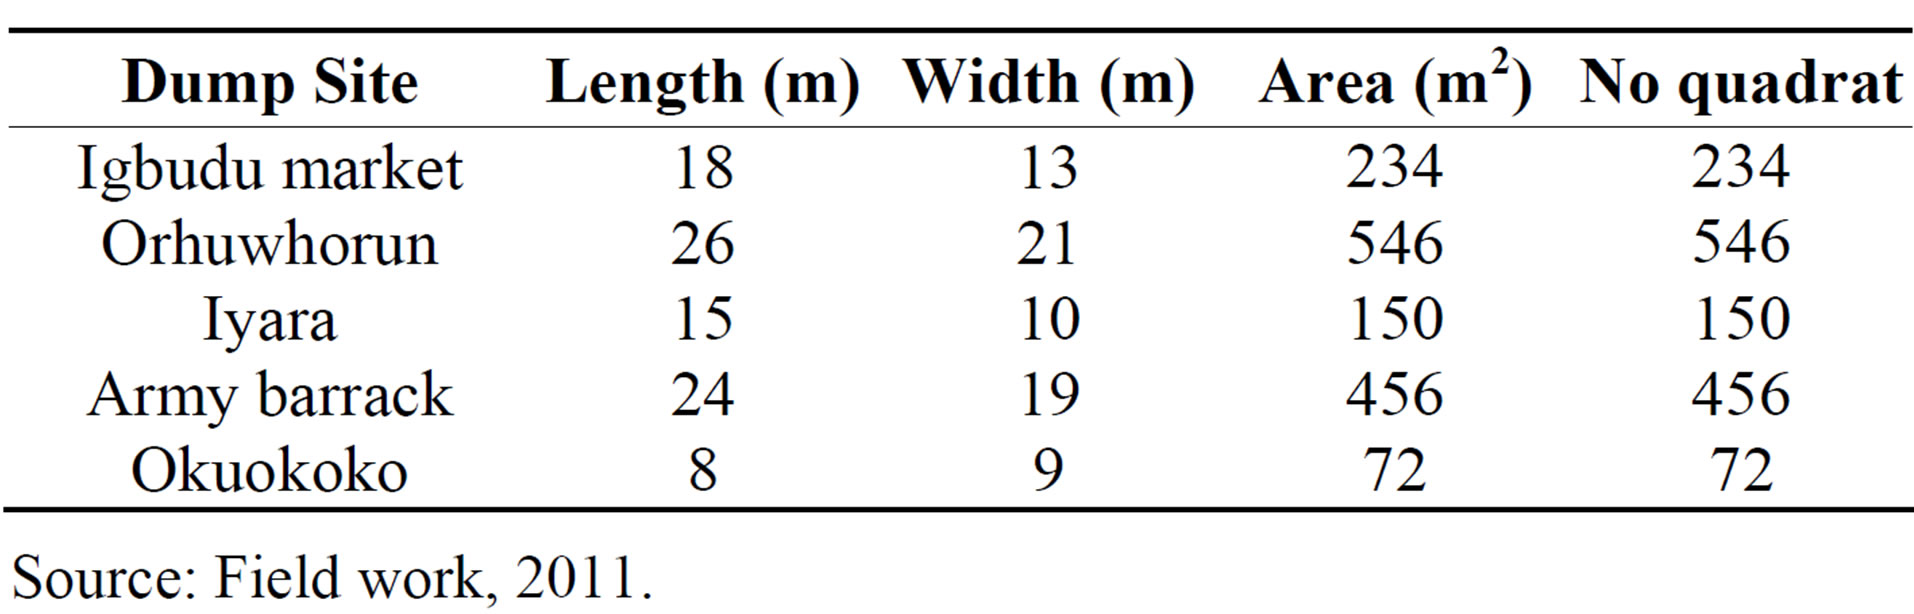
Table 1. Land size occupied by waste at the varying dump site.
Source: Field work, 2011.
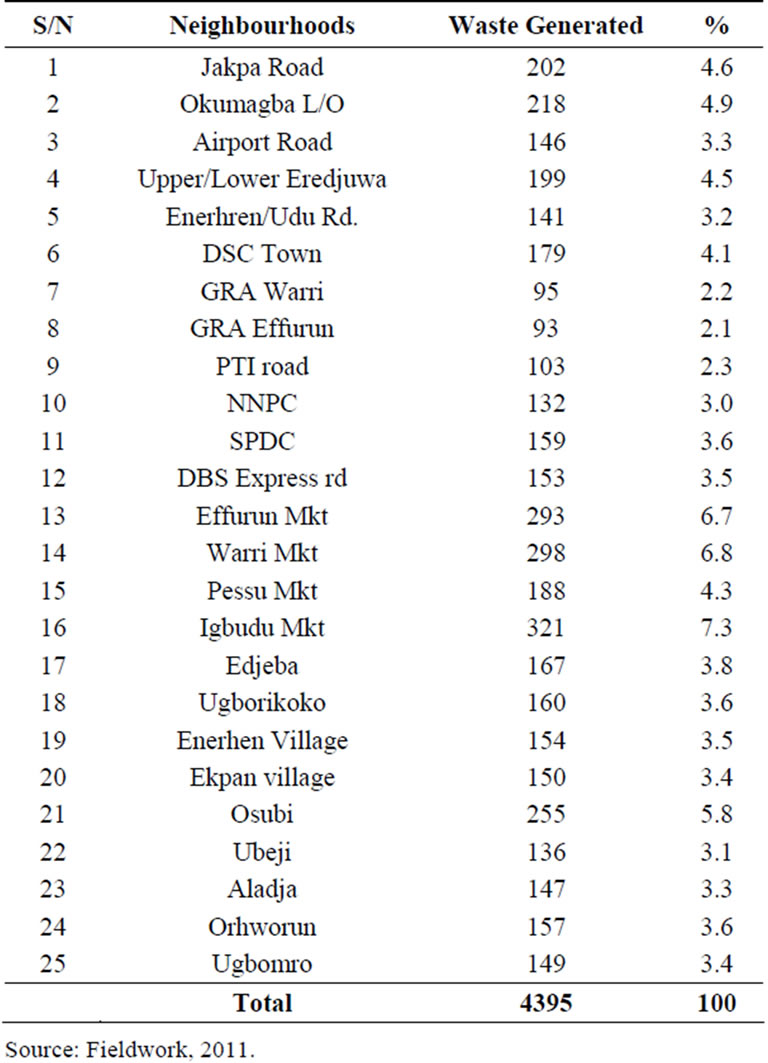
Table 2. Neighbourhood waste generation volume in Kg.
Source: Fieldwork, 2011.
It is revealed that 25.1% of waste generated was recorded in the market areas of the metropolis while 4.3% of the waste generated was recorded in the Government Reserved Areas. Moreso, 19.7% of waste were generated in the (Okumagba, Ugorikoko, Enerhen village, Airport road and upper/lower Eredjuwa) core areas. The residential neighbourhoods around the market areas tend to generate more waste as compared to other areas; this is because of the large commercial activities taking place in the various market squares. The Residents within areas of GRA, Jakpa road, PTI road, NNPC etc. generate a smaller quantity of waste owing to the low population distribution of these areas.
Table 3 shows the volume of waste generated at the various waste dump sites in Warri and environs. More waste is deposited in Army barracks dump site than the other dump sites. This is as a result of the increased activities of waste scavengers and waste disposal agencies that come there to deposit waste.
Table 4 reveals that in the high density residential areas, represented by Jakpa road, Okumagba layout, Airport Road, Upper/Lower Erejuwa, Enerhen/Udu Road etc, metals, wood, glass, and plastics constitute the largest components of solid waste generated by the people. They constitute 30.3%, 14%, 11.4 and 10.3% respectively, while
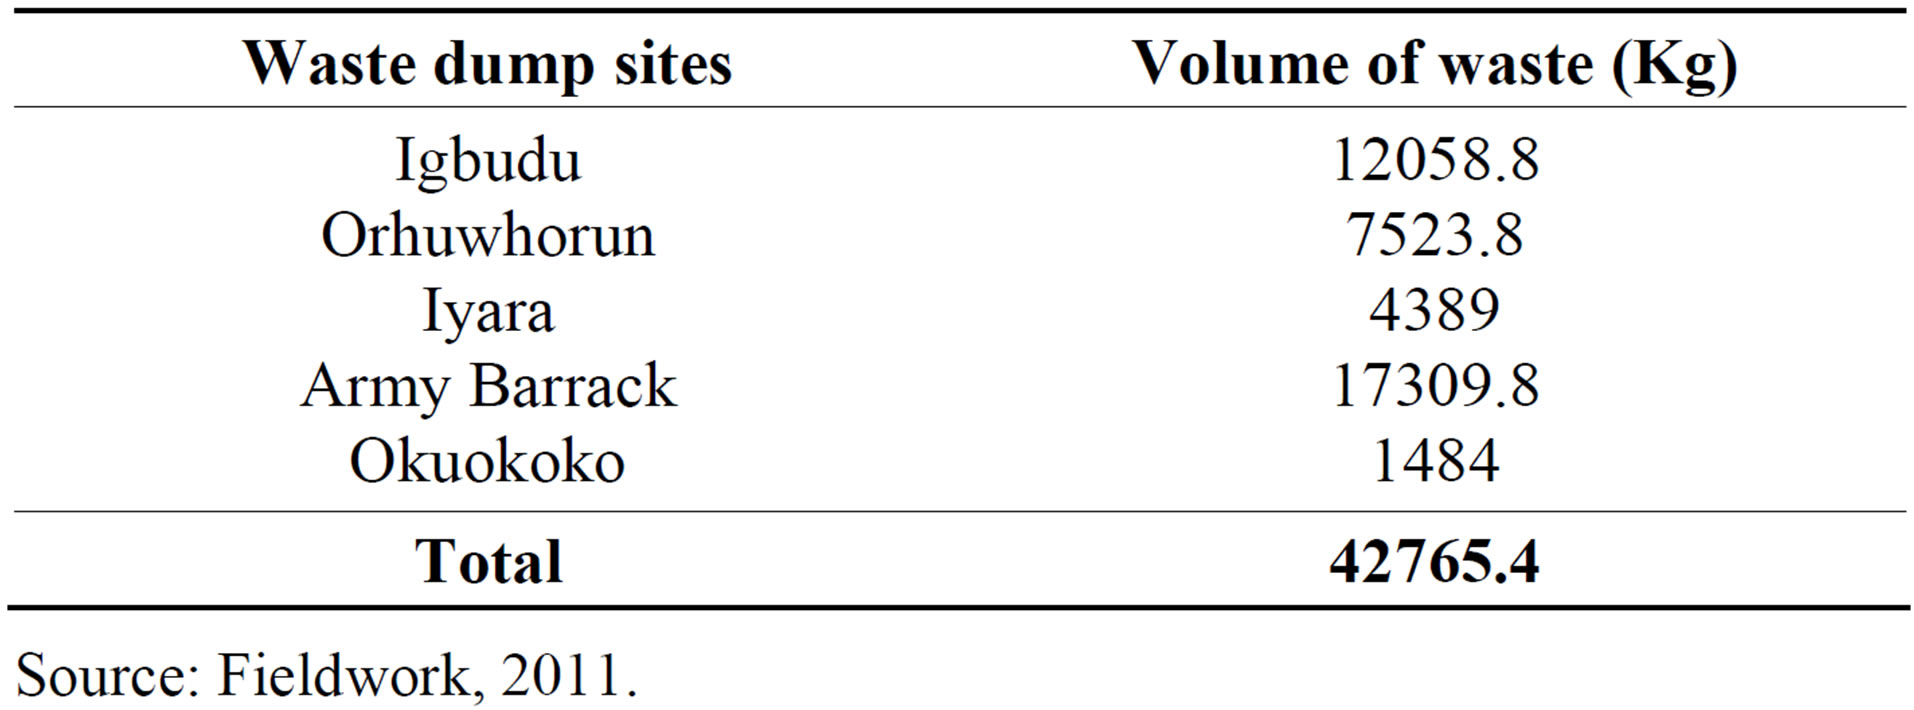
Table 3. Volume of waste generated in the major dump sites.
Source: Fieldwork, 2011.
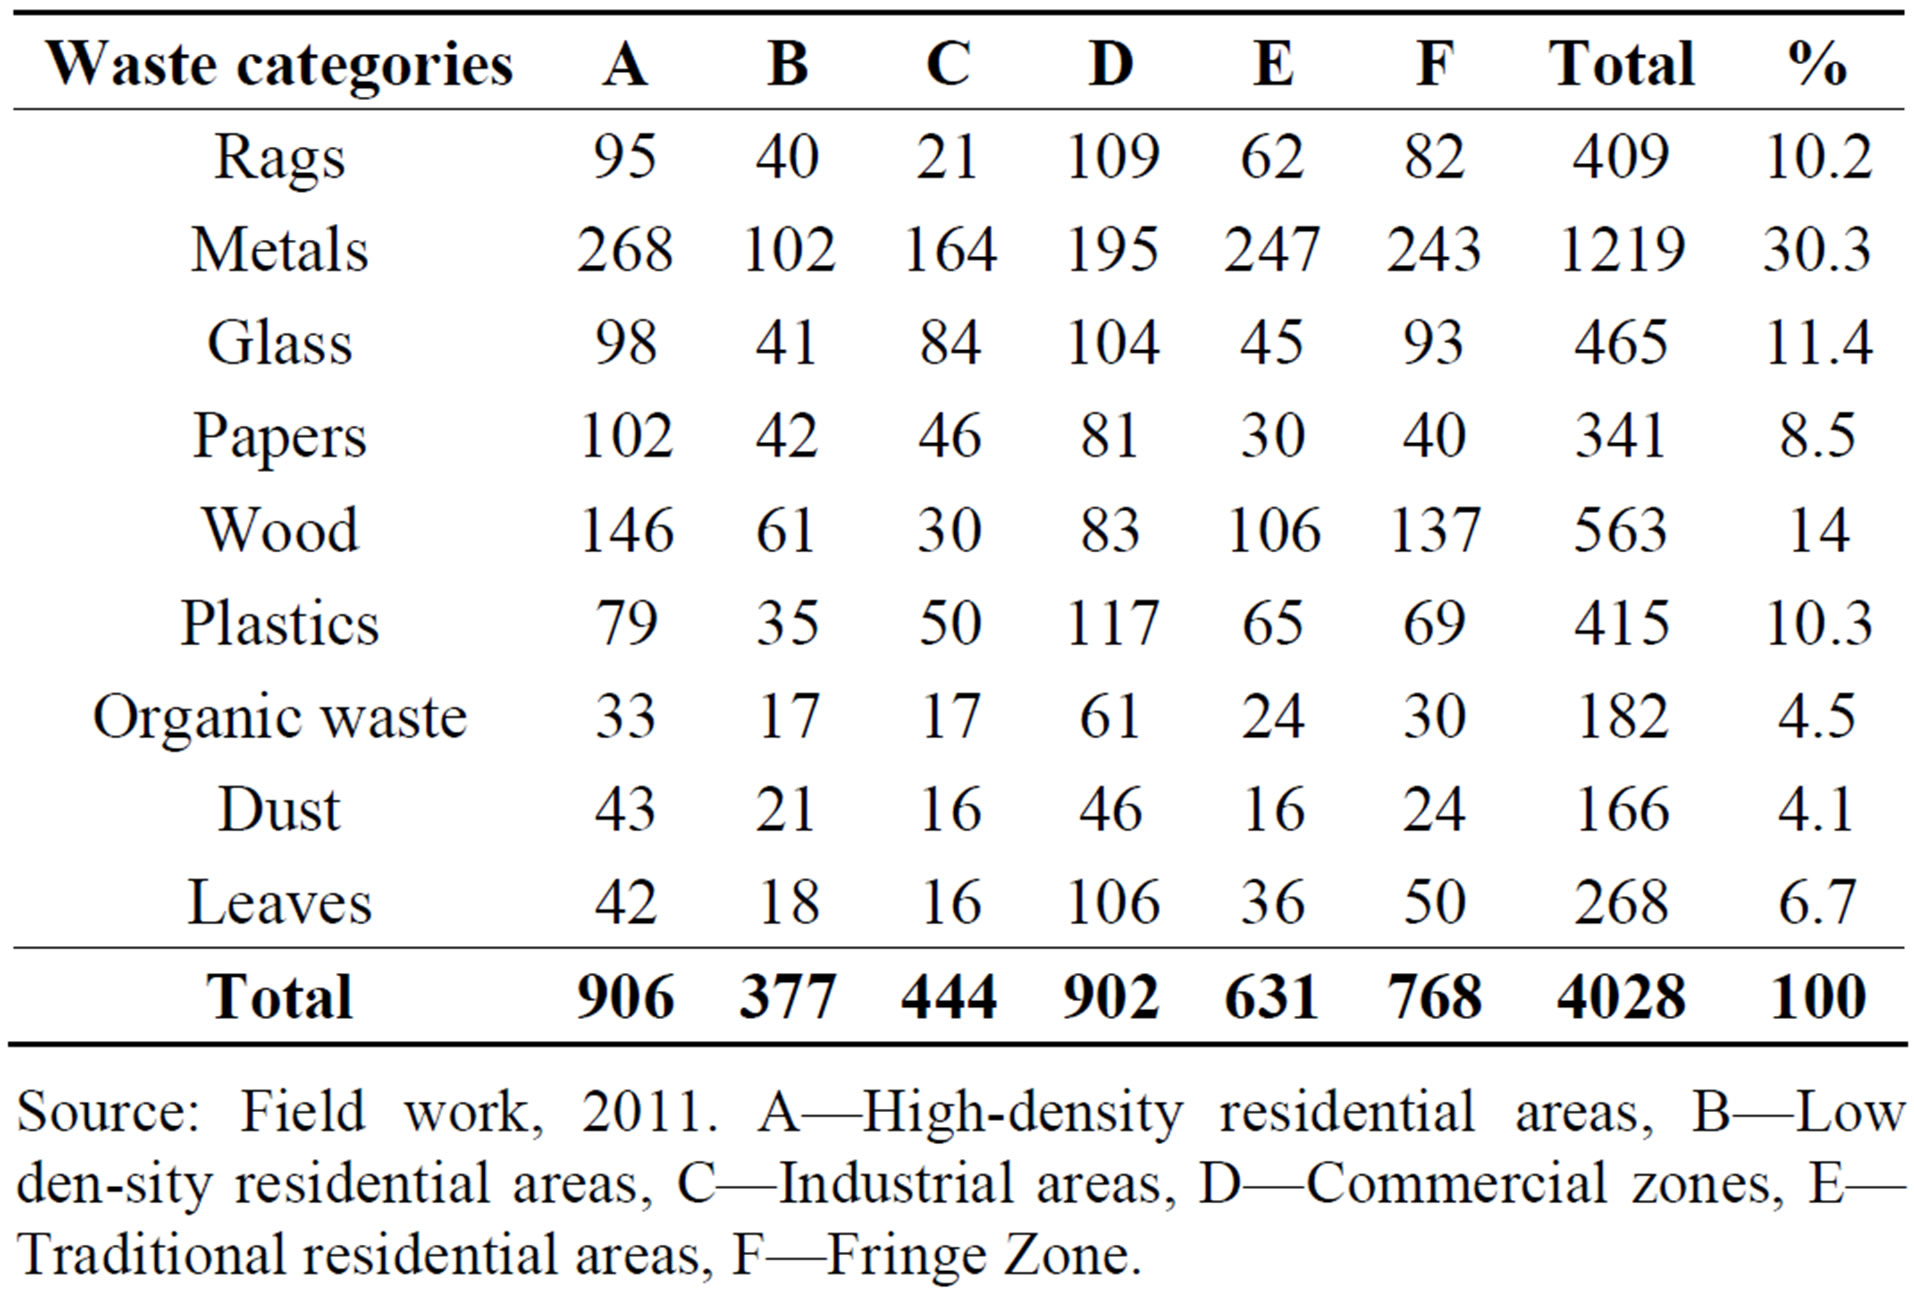
Table 4. Household waste categorization in Warri Metropolis in volume (Kg).
Source: Field work, 2011. A—High-density residential areas, B—Low den-sity residential areas, C—Industrial areas, D—Commercial zones, E— Traditional residential areas, F—Fringe Zone.
leaves, rags, papers, dust and organic waste amounted to only 44% of the total waste generated. However, the low density area represented by Delta Steel Town, G.R.A at Warri and Effurun, PTI Road etc, Metal waste constitutes the largest components of solid waste generated by the people. While leaves, metals, plastics, dust, wood and organic waste amounted to only 29.1% of the total waste generated. The analysis of the solid waste data reveals that there is a high percentage of metal waste generated which is evident at 30.3%. This high waste generation can be likened to socio-economic characteristics and household factors in the area.
Table 5 shows that the volume of waste correlated positively with temperature at R = 0.722. This implies that 72% of waste generated is associated to an increase in temperature. If the waste generation in Warri metropolis increases, there will be a corresponding increase also in the temperature. Waste generation triggers temperature increase [17].
Table 6 revealed that ambient temperature of 33.6˚C is the highest in the study area and this is observed in the high density areas (Jakpa road, Okumagba layout, Airport Road, Upper/Lower Erejuwa, Enerhen/Udu Road) while in the fringe areas (Osubi, Ubeji, Aladja, Orhowhorun and Ugbomro) has a temperature of 31.3˚C. With this observation, it can be stated that the core areas of Warri metropolis have higher temperatures more than the exterior areas because of its socio-economic activities.
Figure 2 shows the urban heat island characteristics in Warri and environs. The study revealed that the Urban Heat Island has an increasing trend over the years with an increase rate of population. The increase in urban heat Island result in an increase in urban warming alongside with the rate of greenhouse gases (GHG) emitted. From the UHI trend, there has been an increase of 1.05˚C between 1933 and 2006 and it was observed that Warri has a warm bias of 4.18˚C.
Table 7 reveals that most greenhouse gases are emit-
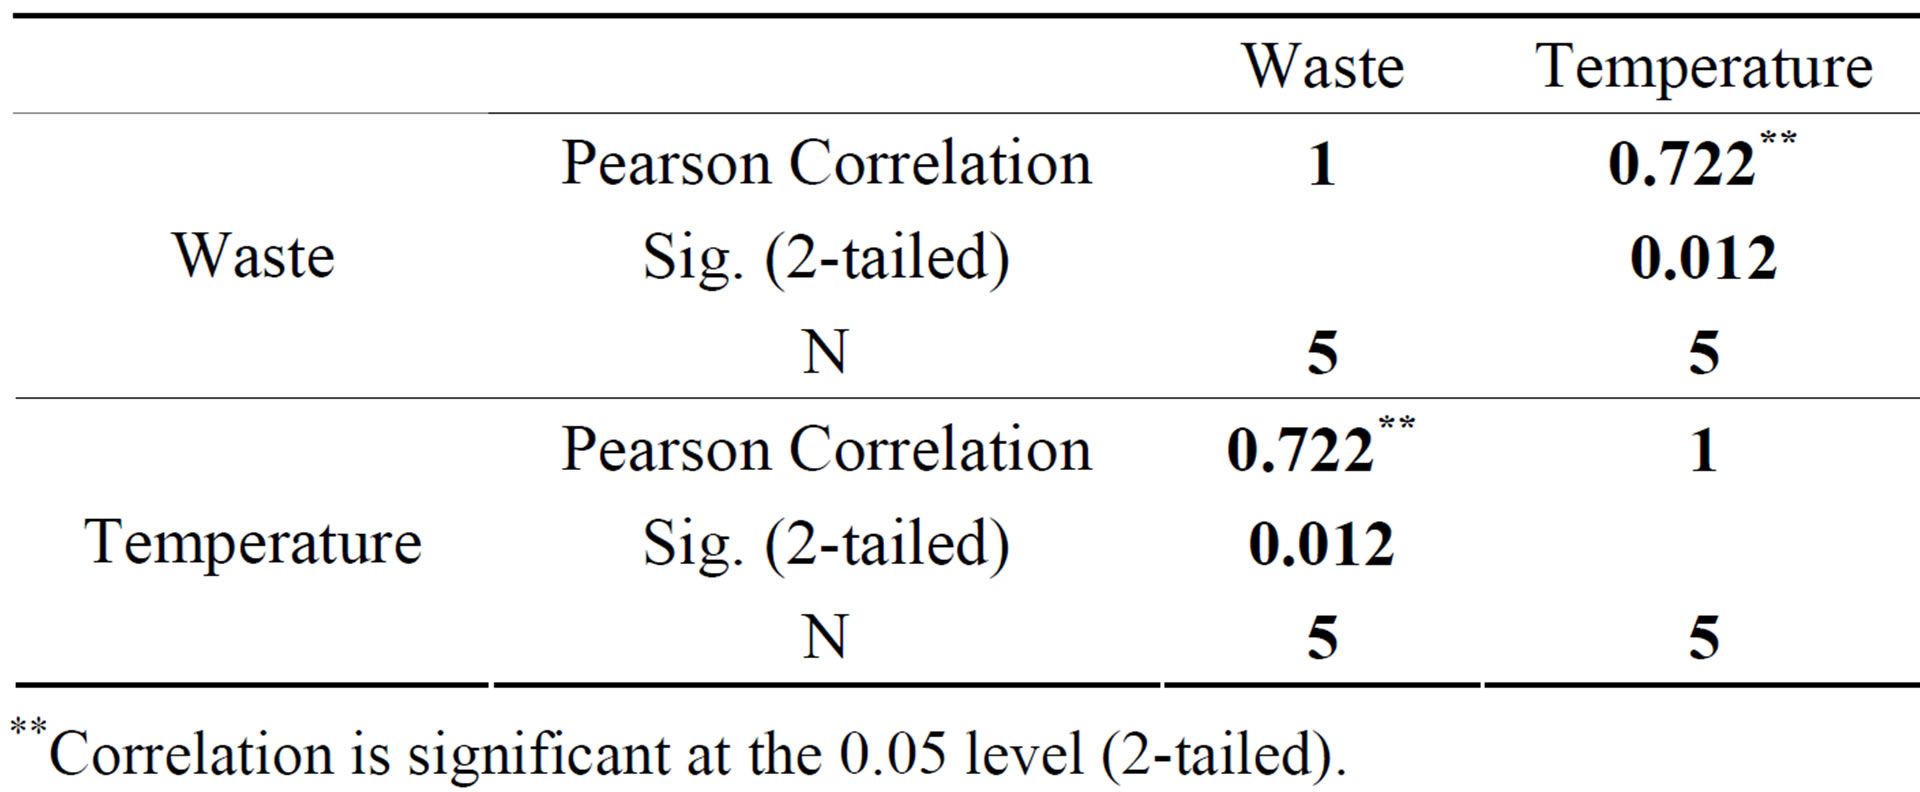
Table 5. Correlation model summary.
**Correlation is significant at the 0.05 level (2-tailed).
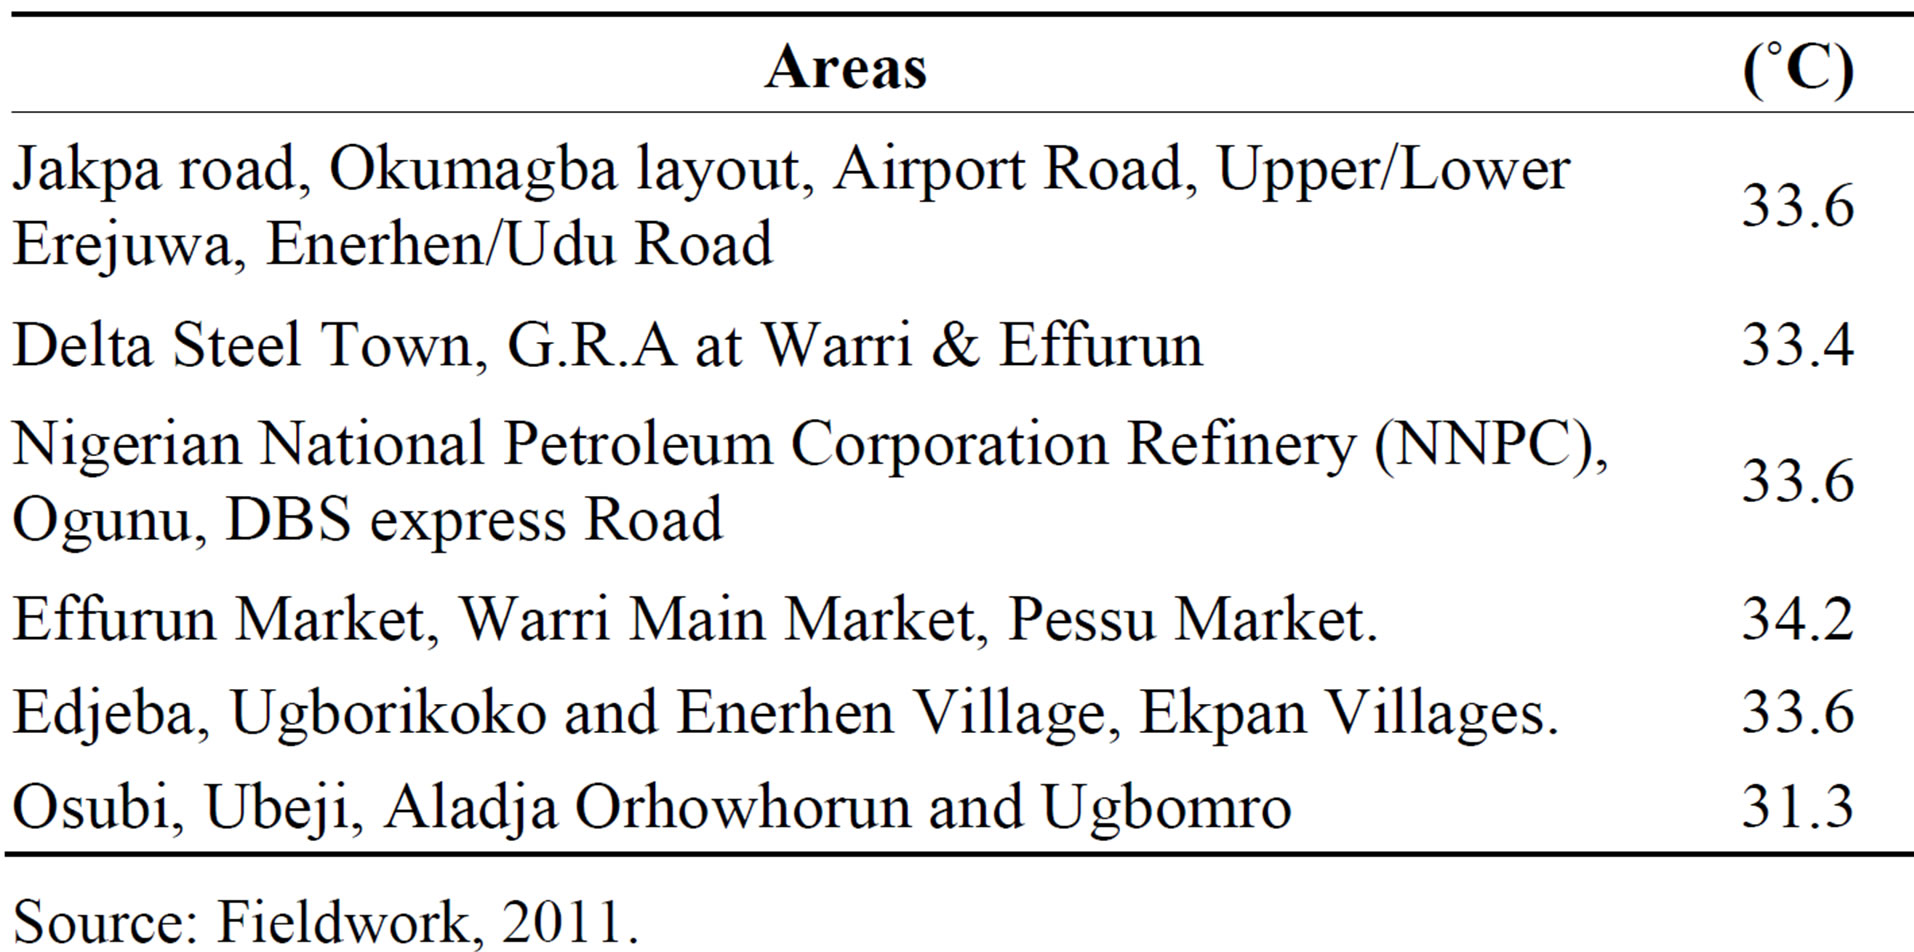
Table 6. Ambient temperatures in the various areas in Warri and environs.
Source: Fieldwork, 2011.

Figure 2. Urban heat island trend in Warri and environs.
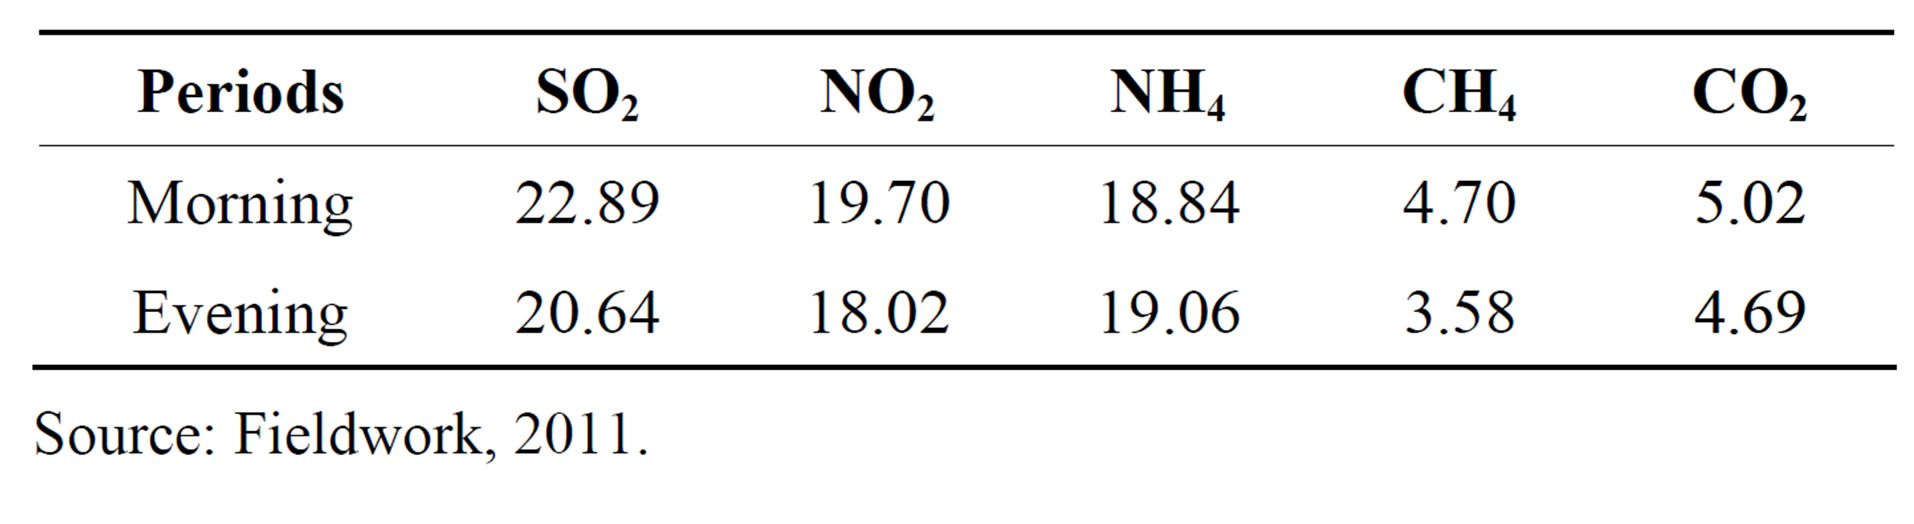
Table 7. Periodical mean volume of greenhouse gases (µ/m3) emitted in Warri.
Source: Fieldwork, 2011.
ted during the morning period more as compared to the evening period. This is as a result of their volatile nature. However, more sulphur dioxide (SO2) gas is emitted during morning and evening periods than any other gas. Succinctly, methane and carbon dioxide gases are least observed because of their high volatile rate.
Table 8 reveals that sulphide (SO2) occupies 31.7% of the volume of greenhouse gases; while methane (CH4) occupies 6.0% of the volume of greenhouse gases. However, methane (CH4) and carbon-dioxide gases are emitted more in the market areas (Igbudu and Iyara) that have more population and where more waste is generated.
This growth in concentrations of greenhouse gases is caused by human activities, including burning of fossil fuels, industrial processes, livestock rearing, agriculture and waste disposal [13]. Thus, population growth has been one of the major factors in causing carbon emissions and GHGs in both developed and developing countries [18].
Table 9 reveals that there is a correlation with R = 0.537 between temperature and the greenhouse gases emitted. However, the r2 value indicates 0.288 which implies that 28.8% of the temperature increase is attributed to methane, carbon-dioxide, Ammonia, Nitrate and sulphide gases in Warri and environs. At P < 0.05, the model is significant and this implies that increase in temperature in Warri is significantly dependent on the greenhouse gases emitted.
Waste Management
Approaches to waste management through community structures should be encouraged at various levels: individual, household, community, LGA and State. The biodegradable/organic solid wastes could be utilized for generation of energy depending upon their calorific value (energy content) and other relevant parameters. The solid wastes rich in organic matter could also be used for generation of biogas by anaerobic digestion. Energy may also be recovered through incineration of solid wastes. Anaerobic digestion is a process of decomposition of organic wastes in the absence of oxygen. The organic wastes could be hydrolysed, liquefied and gasified. The gases can be used for fuel and lighting and the mineralized residue can be used as rich manure. There will be appreciable saving in recurring costs because of utilization of this biogas as manure and electricity. Engineering design, cost and environmental impact assessment are generally the deciding factors in site selection. The parameters in selection of these disposal sites are to:
1) Minimize health risks2) Minimize adverse environmental impacts3) Minimize cost and 4) Maximize public acceptability.
Certain specified areas are to be avoided for disposal of solid wastes and more particularly for hazardous wastes so as to minimize environmental impacts including contamination of surface and ground water.
These are: Eco-sensitive areas, Existing zones of urban and rural, development, Prime agriculture land, Fresh water wetlands, Visual corridors of scenic rivers, Riverine and dam related areas. Shell Petroleum Development Company and Ministry of Environment in the new developmental plan for Warri and environs has mapped out new waste dump sites (see Figure 3).
6. Conclusion
The study revealed an increased urban warming in Warri metropolis. It was observed that areas with increasing population and socio-economic activities tend to generate more waste which in turn leads to higher temperatures. The review of neighbourhood solid waste data in Warri and environs indicates that 25.1% of waste generated is from the commercial area while 4.3% of waste generated is from the low density areas and 19.7% of the waste generated is from the high density areas (Okumagba,
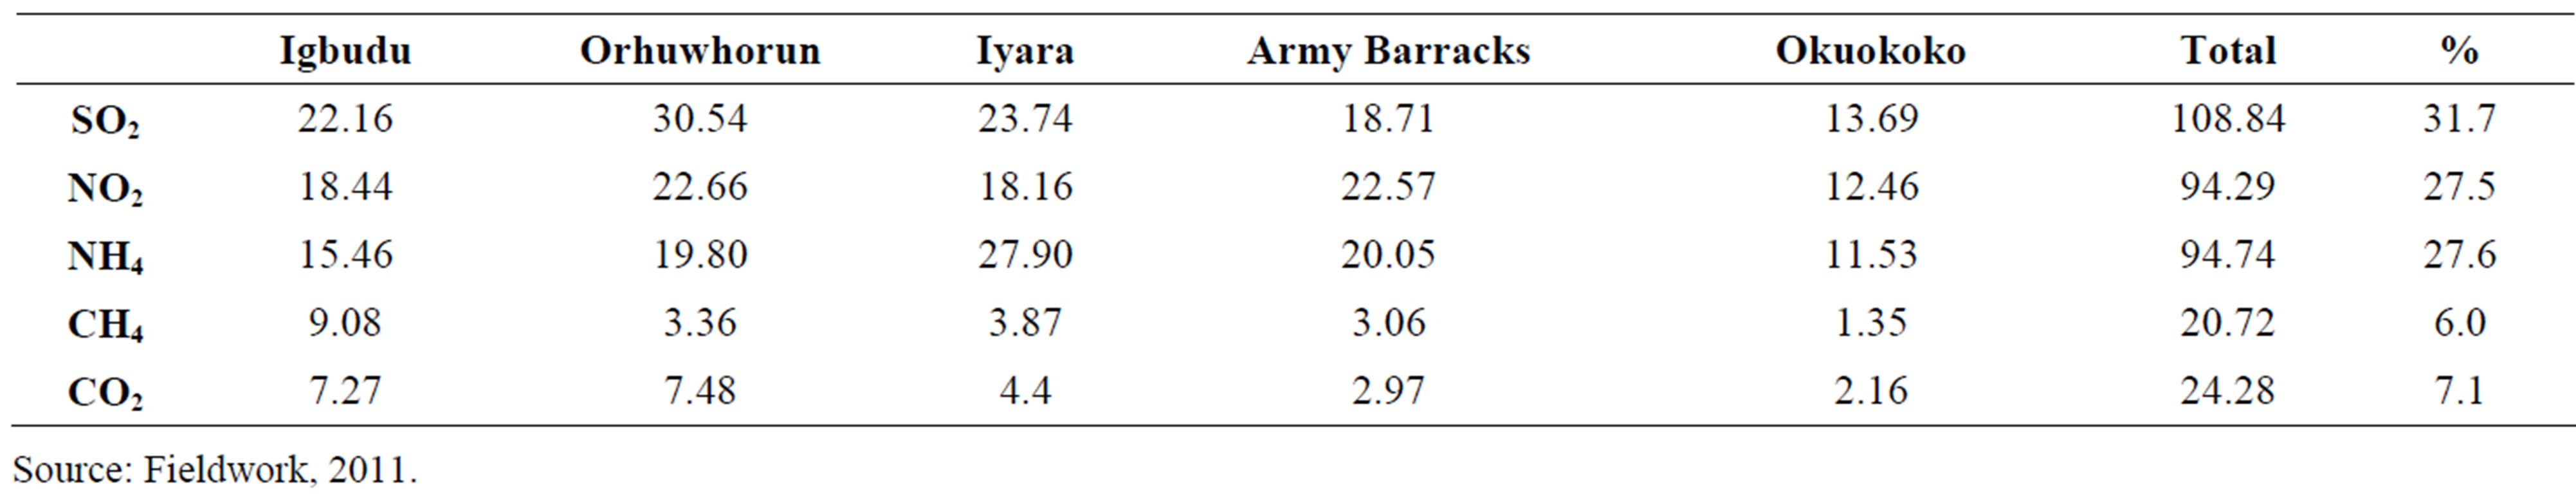
Table 8. Mean volume of greenhouse gases (µ/m3) emitted in Warri and environs.
Source: Fieldwork, 2011.
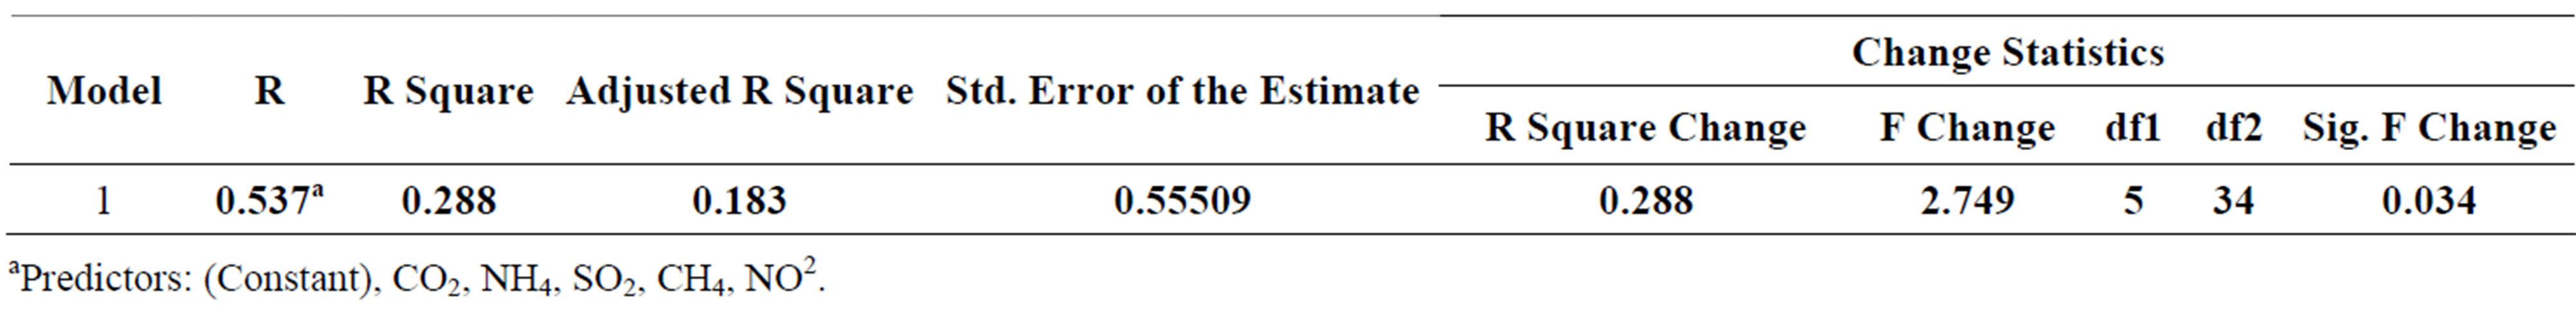
Table 9. Correlation coefficient explaining the relationship between temperature increase and greenhouse gases.
aPredictors: (Constant), CO2, NH4, SO2, CH4, NO2.

Figure 3. Map of Warri metropolis showing proposed site for waste dump sites source: SPDC [18], 2005.
Ugorikoko, Enerhen village, Airport road and upper/lower Eredjuwa). This is an indication that more waste is generated in the high density areas as compared to other zones in the study area. Greenhouse gases are emitted more in the morning than in the evening and (SO2) occupies the largest volume of greenhouse gases; while methane occupies the least volume of greenhouse gases. Methane (CH4) and carbon-dioxide gases are emitted more in the commercial and market areas of the metropolis. These concentrations of methane (CH4) and carbon-dioxide (CO2) gases are believed to be caused by human activities, including industrial process and waste disposal [13]. Although, the results of the study may appear to be too far in the future for immediate action but they are useful for consideration in the climate planning and waste monitoring. Thus, it is recommended that developmental programmes to sensitize and sustain the waste management concepts among communities through media and established environment friendly technologies should be needed.
REFERENCES
- J. O. Babayemi and K. T. Dauda, “Evaluation of Solid Waste Generation, Categories and Disposal Options in Developing Countries: a case Study of Nigeria,” Journal of Applied Science Environmental Management, Vol. 13, No. 3, 2009, pp. 83-88.
- V. I. Ogu, “Private Sector Participation and Municipal Waste Management in Benin City, Nigeria,” Environment and Urbanization, Vol. 12, No. 2, 2000, pp. 103-117. http://dx.doi.org/10.1177/095624780001200209
- T. Agbola and A. M. Jinadu, “Community Reactions and Environmental Impact Assessment of a Landfill Site in an Indigenous African City,” In: T. Agbola, Ed., Environmental Planning and Management: Concepts and application to Nigeria. Ibadan Constellation Books, Ibadan, 2006, pp. 114-145.
- J. M. Bogner, A. Ahmed, C. Diaz, A. Faaij, O. Gas, S. Hashimoto, K. Mareckova, R. Pipatti and T. Zhang, “Waste Management,” In: B. Metz, O. R. Davidson, P. R. Boseh, R. Dave and L. A. Meyer, Eds., Climate Change 2007: Mitigation Contribution of Working, 2007.
- S. I. Efe and C. O. Ojoh, “Spatial Distribution of Malaria in Warri Metropolis,” Open Journal of Epidemiology, Vol. 3, No. 3, 2013, pp. 118-124. http://dx.doi.org/10.4236/ojepi.2013.33018
- S. I. Efe, “Urban Effects on Precipitation Amount and Rainwater Quality in Warri Metropolis,” Ph.D Thesis, Department of Geography and Regional Planning, Delta State University, Abraka, 2005.
- S. I. Efe, “Urban Warming in Nigeria Cities: The Case of Warri Metropolis,” African Journal of Environmental Studies, Vol. 3, No. 1-2, 2002, pp. 160-168.
- R. Sánchez-Rodríguez, K. Seto, D. Simon, W. Solecki, F. Kraas and G. Laumann, “Science Plan: Urbanization and Global Environmental Change IHDP Report 15 International Human Dimensions Programme on Global Environmental Change, Bonn,” 2005. http://www.ihdp.org http://www.ugec.org
- A. O. Eyefia, “Urban Climate Characteristics of Benin City, Edo State, Nigeria,” MSc. Dissertation, Department of Geography and Regional Planning, Delta State University, Abraka, 2010.
- D. Fuchs, “Spain Goes Hi-Tech to Beat Drought,” The Guardian, 2005. www.guardian.co.uk/world/2005/june/28/Spain/wather
- T. R. Oke, “Boundary Layer Climates,” Meth and Co. Ltd., London, 1981.
- I. D. Stewart, “Influence of Meteorological Conditions on the Intensity and Form of the Urban Heat Island Effect in Regina,” Canadian Geographer-Geographe Canadien, Vol. 44, No. 3, 2000, pp. 271-285. http://dx.doi.org/10.1111/j.1541-0064.2000.tb00709.x
- R. O. Yusuf and M. O. Oyewunmi, “Qualitative Assessment of Methane Generation Potential from Municipal Solid Wastes: A Case Study,” Environmental Research Journal, Vol. 2, No. 4, 2008, pp. 138-144.
- A. Aboyade, “The Potential for Climate Change Mitigation in Nigeria Solid Waste Disposal Sector: A Case Study of Lagos,” An Unpublished MSc Dissertation, Department of Environmental Strategy, Lund University, 2004.
- IPCC, “Climate Change 2001. The Scientific Basis. Contribution of Working Group I to the 3rd Assessment Report of the IPCC,” Cambridge University Press, Cambridge, 2001.
- M. K. C. Sridhar, “From Urban Wastes to Sustainable Waste Management in Nigeria: A Case Study,” In: F. A. Matt, A. Ivbijaro, F. Akintola and R. U. Okechukwu, Eds., Sustainable Environmental Management in Nigeria, Chapter 20, Mattivi Productions, Ibadan, 2006, pp. 337- 353.
- B. O’Neill, C. F. Landis, M. Kellar and W. Lutz, “Population and Climate Change,” Cambridge University Press, London, 2001.
- Shell Petroleum Development Company [SPDC], “Community Issues Nigerian Brief,” Public Affairs division SPDC Ltd., Lagos, 2005.