Soft Nanoscience Letters
Vol.3 No.1(2013), Article ID:26379,4 pages DOI:10.4236/snl.2013.31002
On the Thermal Conductivity of Single-Walled Carbon Nanotube Ropes
![]()
1Department of Physics and Astrophysics, University of Delhi, Delhi, India; 2Department of Physics, Shyamlal College, University of Delhi, Delhi, India; 3Department of Physics, Deshbandhu College, University of Delhi, New Delhi, India.
Email: sptewari@physics.du.ac.in
Received September 29th, 2012; revised October 29th, 2012; accepted November 8th, 2012
Keywords: Thermal Conductivity; Single-Walled Carbon Nanotube Ropes; Phonon-Phonon Scattering and Interaction; Dynamical Model
ABSTRACT
Recently measured thermal conductivity in single-walled carbon nanotube ropes in the temperature range 8 - 350 K has been explained using an anisotropic dynamical model which not only takes into account the quasi two-dimensional nature of the folded graphene sheets that forms the nanotubes, but also the intertube coupling, in addition to the phonon frequency and dimensionality dependent relaxation time of phonon-phonon scattering and interaction.
1. Introduction
Thermal conductivity in bulk samples of single-walled carbon nanotube (SWNT) ropes in the temperature range 8 - 350 K, have been reported by Hone et al. [1]. The observed thermal conductivity is predominantly due to phonons: the contribution of electrons is less than two orders of magnitude in the entire temperature range [2]. The temperature dependent values of the thermal conductivity are much larger than that of crystalline fullerene, another allotrope of carbon [3]: at low temperature ~8 K it is more than an order which keeps increasing with increasing temperature and becomes more than two orders of magnitude at 300 K. It is smaller than the thermal conductivity of graphite along the z-direction [3] in the temperature range 8 - 150 K, beyond which, it exceeds and becomes almost twice that of graphite at 300 K. However, it is much lower than the thermal conductivity of graphite in the basal plane, in the temperature range 8 - 300 K. It is therefore, apparent that the folding of graphene sheets into a bucky ball or right circular cylindrical tubules, results in a remarkable change in its thermal conductivity, as is evident from the experimental measurements.
SWNT ropes consist of bundles of aligned SWNT of diameter around 1.25 nm. Each SWNT is in proximity with other SWNT and therefore, are bound to one another and give rise to three-dimensional dynamical modes, unlike the case of isolated SWNT, where, the dynamical modes are essentially two-dimensional because of thefolding of a graphene sheet into a capillary. The dynamics of a SWNT has been studied theoretically using a simplified model of the tube, and the appropriate dynamical matrix diagonalized, to obtain its vibrational modes [4]. However, there is hardly any theoretical work which attempts to explain the observed temperature variation of thermal conductivity in SWNT ropes, because of its complexity. One must nevertheless, try to understand the phenomenon because of its commercial utility and also, for academic purposes, which will lead to the understanding of its different physical properties. An attempt here, is therefore, made to understand both the thermal conductivity and its intimately related quantity, the specific heat [5,6] using different physical dynamical models, and then try to fix the dynamical model, using the basic physics of the sample, to explain consistently both the temperarure dependent thermal conductivity and the specific heat variation of the sample.
In the next section is briefly described the mathematical formalism, followed by the results and discussions of the computations. Important conclusions are recorded in the final section.
2. Mathematical Formalism
Thermal conductivity is expressed as:
 (1)
(1)
where  is the thermal conductivity in the
  direction
  (
( represent the directions in the Cartesian coordinates and also the polarization of the phonons).
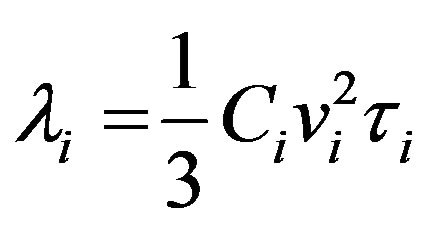 (2)
(2)
where ,
,  and
and  are the specific heat, velocity and the relaxation time of the phonons respectively in the
  direction.
Expressing specific heat in terms of phonon frequency distribution function (FDF),  , and the average number of phonons of energy
 ,
,
the expression for thermal conductivity turns out to be:
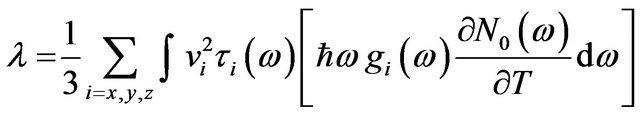 (3)
(3)
Different dynamical models of phonons are used to compute the specific heat and thermal conductivity.
2.1. Debye Model
The phonon FDF in this model is given by the relation.
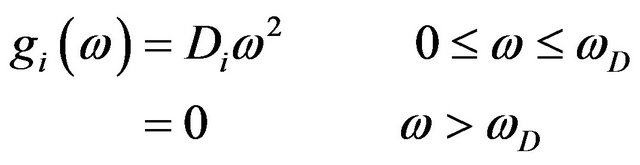 (4)
(4)
2.2. Extended Debye Model
In this model [7-9] the material anisotropy is introduced using different cutoffs for the allowed maximum energy of the phonons.
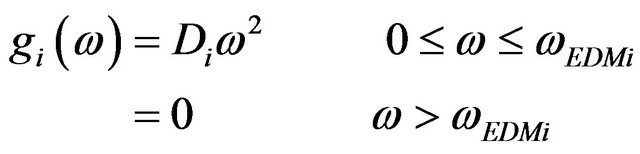 (5)
(5)
where
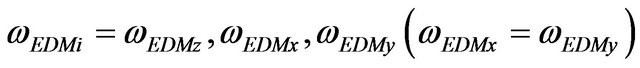
and the limit of FDF along the z axis and perpendicular to it ( i.e. in the x-y plane) are different.
2.3. Anisotropic Model
The phonon FDF, , in a given direction i, in the suggested dynamical model [10,11] is given as follows:
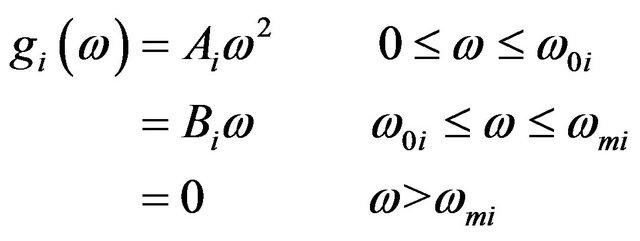 (6)
(6)
where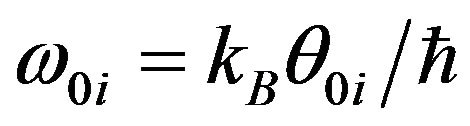 ,
,  ,
,  is the Boltzmann constant and
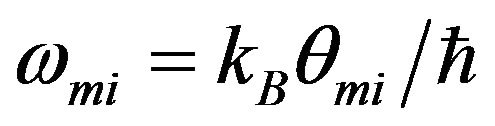
where h is the Planck’s constant.  and
and  are the characteristic temperatures that define the extent of three-dimensional and two-dimensional modes region respectively, in a given direction i. Here
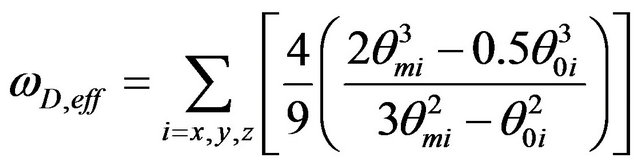
  is the maximum value that two-dimensional modes can have, i = x, y, z. Substituting expression (6) in Equation (3), one gets the final expression of thermal conductivity:
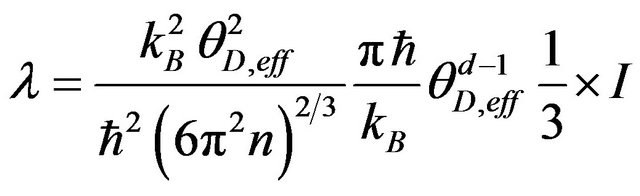 (7)
(7)
where  is the number density of SWNT ropes.
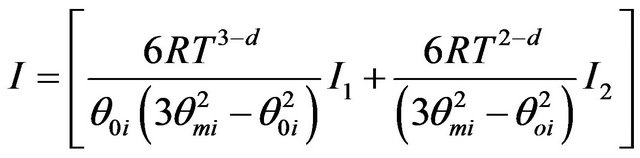
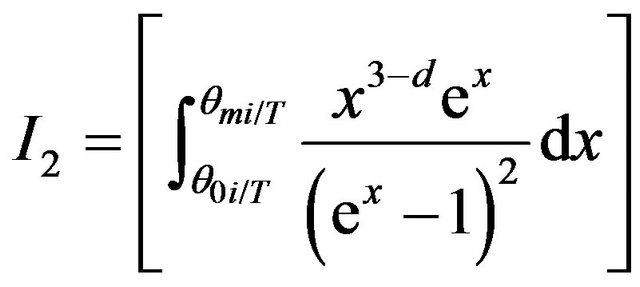
And  and
and  are as follows:
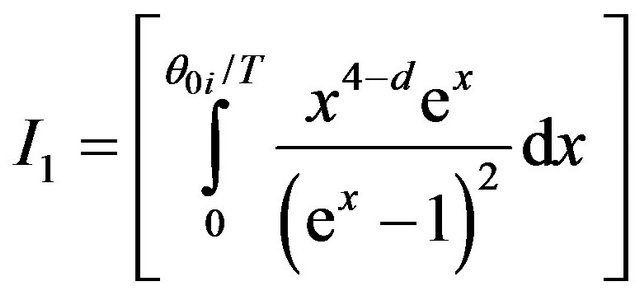
and
where the relaxation time is given by
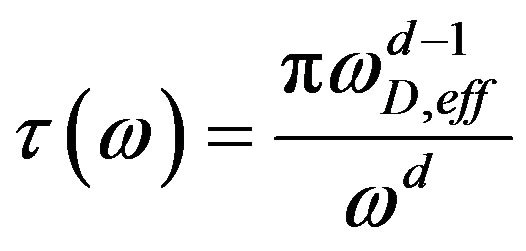 (8)
(8)
where
 (9)
(9)
3. Results and Discussions
We consider three dynamical models, which increasingly take into account the realistic nature of the SWNT ropes sample. The first model is celebrated isotropic threedimensional Debye model, which ignores the presence of anisotropic nature of the SWNT ropes. The model is given by expression (4) which when used in expression of the specific heat contained in expression (3), to compute the temperature variation of specific heat, one finds that the Debye temperature of 1500 K yields the specific heat in the temperature range 2 - 300 K, as shown by small dash curve (- - - - - -) in Figure 1. It is the model which yields Dulong Petit law i.e. the value of 3R at high temperatures in agreement with the experimental results shown by solid squares (■ ■ ■ ■); but at low temperatures yields quite different temperature variation of spe-
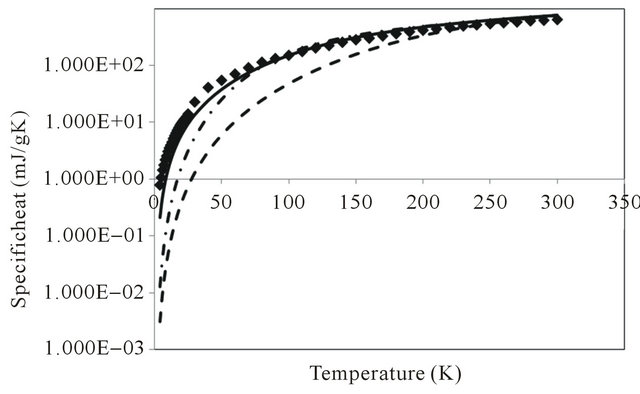
Figure 1. Specific heat of single-walled carbon nanotubes in the temperature range 2 - 300 K by different models: (a) Experimental values squares (■ ■ ■ ■); (b) Debye model dash (- - - - - -); (c) Extended Debye model dash dot (- .-. -. -. -.) and (d) Anisotropic model solid line ( _________ ).
cific heat: the computed values are increasingly much lower than the corresponding experimentally observed values of specific heat in the entire temperature range down to 2 K. In order to take into account the anisotropy present in the system, one can use expression (5), which is referred to as “Extended Debye model” (EDM) where there are two values of , one along the basal plane and other perpendicular to it i.e.
and
respectively. The computed values of specific heat have been shown by large dash curve (___ ___ ___).
The EDM yields closer values to experimental ones in the temperature range 60 - 300 K, but gives much lower values at lower temperatures , even though these values are much higher than those given by isotropic Debye model. Finally, the anisotropic model given by expression (6) which not only takes into account the anisotropic planar modes reminiscent of graphene modes, but also the intertube coupling, which gives rise to three-dimensional dynamical modes at small values of frequencies, has been used to compute the specific heat. One finds that
 ;
; and
and  yields the best possible values of the specific heat as shown in Figure 1 by solid line (__________). As is evident from the Figure, this model explains quite well the temperature variation of specific heat in the entire temperature range 2 - 300 K (and is far superior to Debye and Extended Debye model). We therefore, use this model to study the temperature variation of thermal conductivity of SWNT ropes.
Thermal conductivity, unlike the study of specific heat in the present problem where number of phonons is fixed, involves phonon-phonon scattering and phonon-phonon interaction, which gives rise to phonon mean free path or phonon relaxation time
 . One has to use an appropriate form for the relaxation time. Taking a cue from thermal conductivity when phonon distribution function is three-dimensional Debye type, one can suggest the form of
 to be that given by expression (8) where, d is introduced as a variable having the physical connotation of the dimensionality of the system. For d = 2, the expression corresponds to three-dimensional case [5]. Using this form of
  in expression (3), one gets the final expression of thermal conductivity given by expression (7). Using the various values of the physical parameters
  obtained from the specific heat study and
 , the thermal conductivity is computed for different values of d, and its temperature dependent variation is plotted in Figure 2. As is evident from Figure 2, when
  the computed values given by solid curve (__________) explains reasonably well the temperature variation of thermal conductivity from 8 K to ~150 K. Above 150 K, experimental values are somewhat higher and maximum percentage deviation is ~ 40% at 300 K.
Since  represents a two-dimensional nature of the system, it therefore appears that at high temperatures the behavior of thermal conductivity in SWNT ropes approaches that of two-dimensional material while at low temperatures, it corresponds to quasi two-dimensional because of the curvature of graphene sheets.
4. Conclusion
One may conclude that, it is possible to explain consistently both, the observed temperature variation of specific heat and thermal conductivity of SWNT ropes, us-
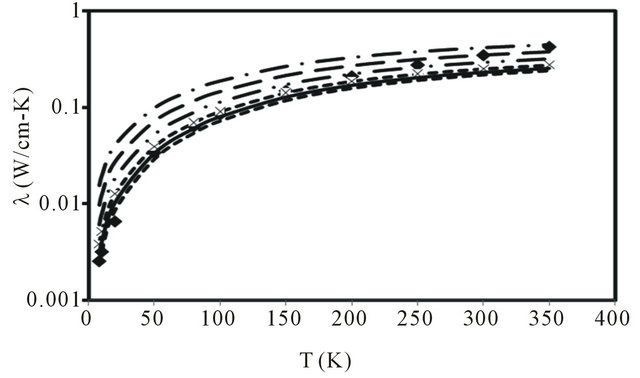
Figure 2. Thermal conductivity of single-walled carbon nanotubes in the temperature range 8 - 350 K for different values of d: (a) Experimental values by squares (■ ■ ■ ■); (b) d = 0.7 round dots (··········); (c) d = 0.75 solid line (__________); (d) d =0.8 small dashes cross (- - - -´- - - -); (e) d = 0.9 long dash double dot ( ___.. ___.. ___ ); (f) d=1 long dash ( ___ ___ ___ ); (g) d = 1.1 long dash dot(___. ___. ___).
ing an appropriate anisotropic dynamical model and a suitable form of relaxation time that represents phononphonon scattering and interaction. The anisotropic dynamical model takes into account the presence of surface modes on the curved graphene sheets and intertube coupling. Further, the relaxation time, which is related to phonon mean free path, due to the phonon phonon interaction is found to be dependent both on phonon energy and the dimensionality. Its form also indicates the quasi two dimensional nature of SWNT ropes.
REFERENCES
- J. Hone, M. Whitney, C. Piskoti and A. Zettl, “Thermal Conductivity of Single-Walled Carbon Nanotubes,” Physical Review B, Vol. 59, No. 4, 1999, pp. R2514-R2516.
- J. Hone, M. C. Llaguno, N. M. Nemes, A. T. Johnson, J. E. Fischer, D. A. Walters, M. J. Casavant, J. Schmidt and R. E. Smalley, “Electrical and Thermal Transport Properties of Magnetically Aligned Single Walled Carbon Nanotube Films,” Applied Physical Letters, Vol. 77, No. 5, 2000, pp. 666-668. doi:10.1063/1.127079
- J. R. Olson, K. A. Topp and R. O. Pohl, “Specific Heat and Thermal Conductivity of Solid Fullerenes,” Science, Vol. 259, No. 5098, 1993, pp. 1145-1148. doi:10.1126/science.259.5098.1145
- R. Saito, T. Takeya, T. Kimura, G. Dresselhaus and M. S. Dresselhaus, “Raman Intensity of Single-Walled Carbon Nanotubes,” Physical Review B, Vol. 57, No. 7, 1998, pp. 4145-4153.
- S. P. Tewari, P. Silotia and K. Bera, “Role of Collective and Localized Modes on the Temperature-Dependent Thermal Conductivity in Polycrystalline C60 Fullerite Compacts,” Modern Physics Letters B, Vol. 11 No. 23, 1997, pp. 1031-1035. doi:10.1142/S0217984997001249
- J. Hone, “Carbon Nanotubes: Thermal Properties,” In: M. Dekker, Ed., Dekker Encyclopedia of Nanoscience and Nanotechnology, Marcel Dekker, Inc., New York, 2004, pp. 603-610.
- S. P. Tewari and P. K. Gumber, “Effect of Crystal Anisotropy in Zinc,” Physica C, Vol. 165, No. 3-4, 1990, pp. 325-327. doi:10.1016/0921-4534(90)90212-W
- S. P. Tewari and P. Silotia, “The Effect of Crystal Anisotropy on the Lamb Mossbauer Recoilless Fraction and Second-Order Doppler Shift in Zinc,” Journal of Physics: Condensed Matter, Vol. 1, No. 31, 1989, pp. 5165-5170. doi:10.1088/0953-8984/1/31/015
- J. Hone, B. Batlogg, Z. Benes, A. T. Johnson and J. E. Fischer, “Quantized Phonon Spectrum of Single-Walled Carbon Nanotubes,” Science, Vol. 289 No. 5485, 2000, pp. 1730-1733. doi:10.1126/science.289.5485.1730
- S. P. Tewari, P. Silotia, S. Dabas and A. Saxena, “On the Excess Specific Heat of Single-Wall Carbon Nanotube Ropes Due to the Adsorption of Helium Atoms in the Temperature Range 2 - 20 K,” Journal of Nanophotonics, Vol. 2, No. 1, 2008, pp. 1-7.
- P. Silotia, S. Dabas, A. Saxena and S. P. Tewari, “Phonon Distribution of Aligned Multi-Walled Carbon Nanotubes,” Journal of Nanophotonics, Vol. 5, No. 1, 2011, pp. 1-9. doi:10.1117/1.3590198