World Journal of Nano Science and Engineering
Vol.3 No.1(2013), Article ID:29619,11 pages DOI:10.4236/wjnse.2013.31002
Simulation of Structural Characteristics and Depth Filtration Elements in Interconnected Nanofibrous Membrane Based on Adaptive Image Analysis
VTT Technical Research Centre of Finland, Espoo, Finland
Email: mohammad.kazemi@tut.fi
Received February 1, 2013; revised March 7, 2013; accepted March 15, 2013
Keywords: Nanofibrous Membrane; Image Analysis; Local Criteria; Structural Characteristics; Pore Interconnectivity; Depth Filtration
ABSTRACT
Due to their unique structural features, electrospun membranes have gained considerable attention for use in applications where quality of depth filtration is a dominant performance factor. To elucidate the depth filtration phenomena it is important to quantify the intrinsic structural properties independent from the dynamics of transport media. Several methods have been proposed for structural characterization of such membranes. However, these methods do not meet the requirement for the quantification of intrinsic structural properties in depth filtration. This may be due to the complex influence of transport media dynamics and structural elements in the depth filtration process. In addition, the different morphological architectures of electrospun membranes present obstacles to precise quantification. This paper seeks to quantify the structural characteristics of electrospun membranes by introducing a robust image analysis technique and exploiting it to evaluate the permeation-filtration mechanism. To this end, a nanostructured fibrous network was simulated as an ideal membrane using adaptive local criteria in the image analysis. The reliability of the proposed approach was validated with measurements and comparison of structural characteristics in different morphological conditions. The results were found to be well compatible with empirical observations of perfect membrane structures. This approach, based on optimization of electrospinning parameters, may pave the way for producing optimal membrane structures for boosting the performance of electrospun membranes in end-use applications.
1. Introduction
Electrospun nanofibres are attracting considerable attention in the field of membrane applications due to their fundamental structural features and corresponding depth filtration characteristics [1-6]. These features originate mostly from the random deposition of ultrafine fibres in the form of an interconnected porous substrate, resulting in rapid increase in filtration accompanied by reduced permeability loss [7-10]. Characterization of these parameters could pave the way to estimating the relative implantation efficiency of the membranes in demanding applications where the quality of depth filtration is paramount. Lithium battery membranes [11-12], tissue scaffolds [13-14], and separation membranes for fuel cells [15-16] are the most common applications for electrospun membranes for depth filtration.
Tehrani et al. [17] virtually modelled a 3D structure of a fibrous tissue scaffold and introduced a parameter known as scaffold percolative efficiency (SPE) for evaluation of membrane transport properties. The reliability of the algorithm was validated by in vitro experiments. Hossieni et al. [18] modelled the permeability of a 3D nanofibre structure with a C++ program in a slip flow regime. They claimed that, due to the fine diameter of the fibres, the flow field around the fibre was not a continuum regime and establishing a correction factor for the conventional expressions was thus needed. Correspondingly, Hossieni and Tafreshi [19] numerically simulated the pressure drop and the collection efficiency at different aerosol sizes and claimed that their simulation was compatible with the existing correlations.
Sambaer et al. [20] proposed a 3D structure model based on image analysis of a polyurethane nanofibre membrane. They investigated the filtration process in the slip, transition, and free molecular flow regimes while several factors such as particle-fibre interactions, airparticle slip, and sieve and homogenous flow field were considered. Moreover, Jaganatha et al. [21] reconstructed a 3D microstructure based on image analysis to describe the fluid flow behaviour and permeability of a fibrous membrane and compared the results with analytical equations. A review of the related literature revealed that there is no satisfactory correlation between structural characteristics and the permeation-filtration process throughout the depth of a membrane. Exploring the interplay between depth filtration behaviour and structural characteristics expedites the process optimization of electrospinning parameters to produce ideal membranes for demanding applications. The proposed approach involves the evaluation of these properties without the use of the complex theoretical equations typically attributed to depth filtration dynamics, the majority of which have no correlation with processing parameters.
Image analysis is a non-destructive characterization method and, due to its ability to detect individual pores, is beneficial for structural characterizations. The most important advantage of image analysis, particularly with respect to the unique architecture of nanofibres, is the ability to conduct porosity measurements within the depth profile of the image. However, in order to exploit accurate results of quantitative analysis, careful consideration should be paid to morphological features either by means of programming or software implementation. Consequently, previously proposed algorithms [17,22-24] are appropriate only in specific cases, and general process conditions still present key obstacles regarding their effectiveness. These obstacles mainly originate from structural imperfections (beading and solution dripping) and high or low density of fibre deposition. Such measurement obstacles, especially at the nano scale, hinder the precise evaluation of the actual elements involved in depth filtration.
The main objective of this paper is to introduce a robust technique based on image analysis for the quantification of structural characteristics, and to exploit the results to evaluate the permeation-filtration mechanism. To this end, the fibrous network was simulated as an ideal membrane, and the type and sequence of morphological operations in the proposed algorithm were defined such that the deviation of measurements was minimized. Similar to any method based on image analysis, it is important to capture and select the images with possible highest quality and without unexpected noises. Meanwhile, the different fibrous layers in the depth of membrane profile should be distinguished in the selected images. In addition, due to inhomogeneous distributions of fibres throughout the membrane, it is of significance that the images are captured from different regions of a membrane in order to obtaining the highest measurement accuracy. Our technique enables the computation of layered and overall porosity characteristics of electrospun nanofibres in different morphological conditions. Furthermore, the interconnectivity, scaffold percolative efficiency (SPE), optimal pore size (OPS) and their corresponding relation to depth filtration were studied. The reliability of the proposed approach was validated by measurements and through comparison of the structural characteristics of several samples in different morphological architectures. In our last work [25], the preparation and morphological changes in some of these samples were discussed based on electrospinning process.
2. Methodology
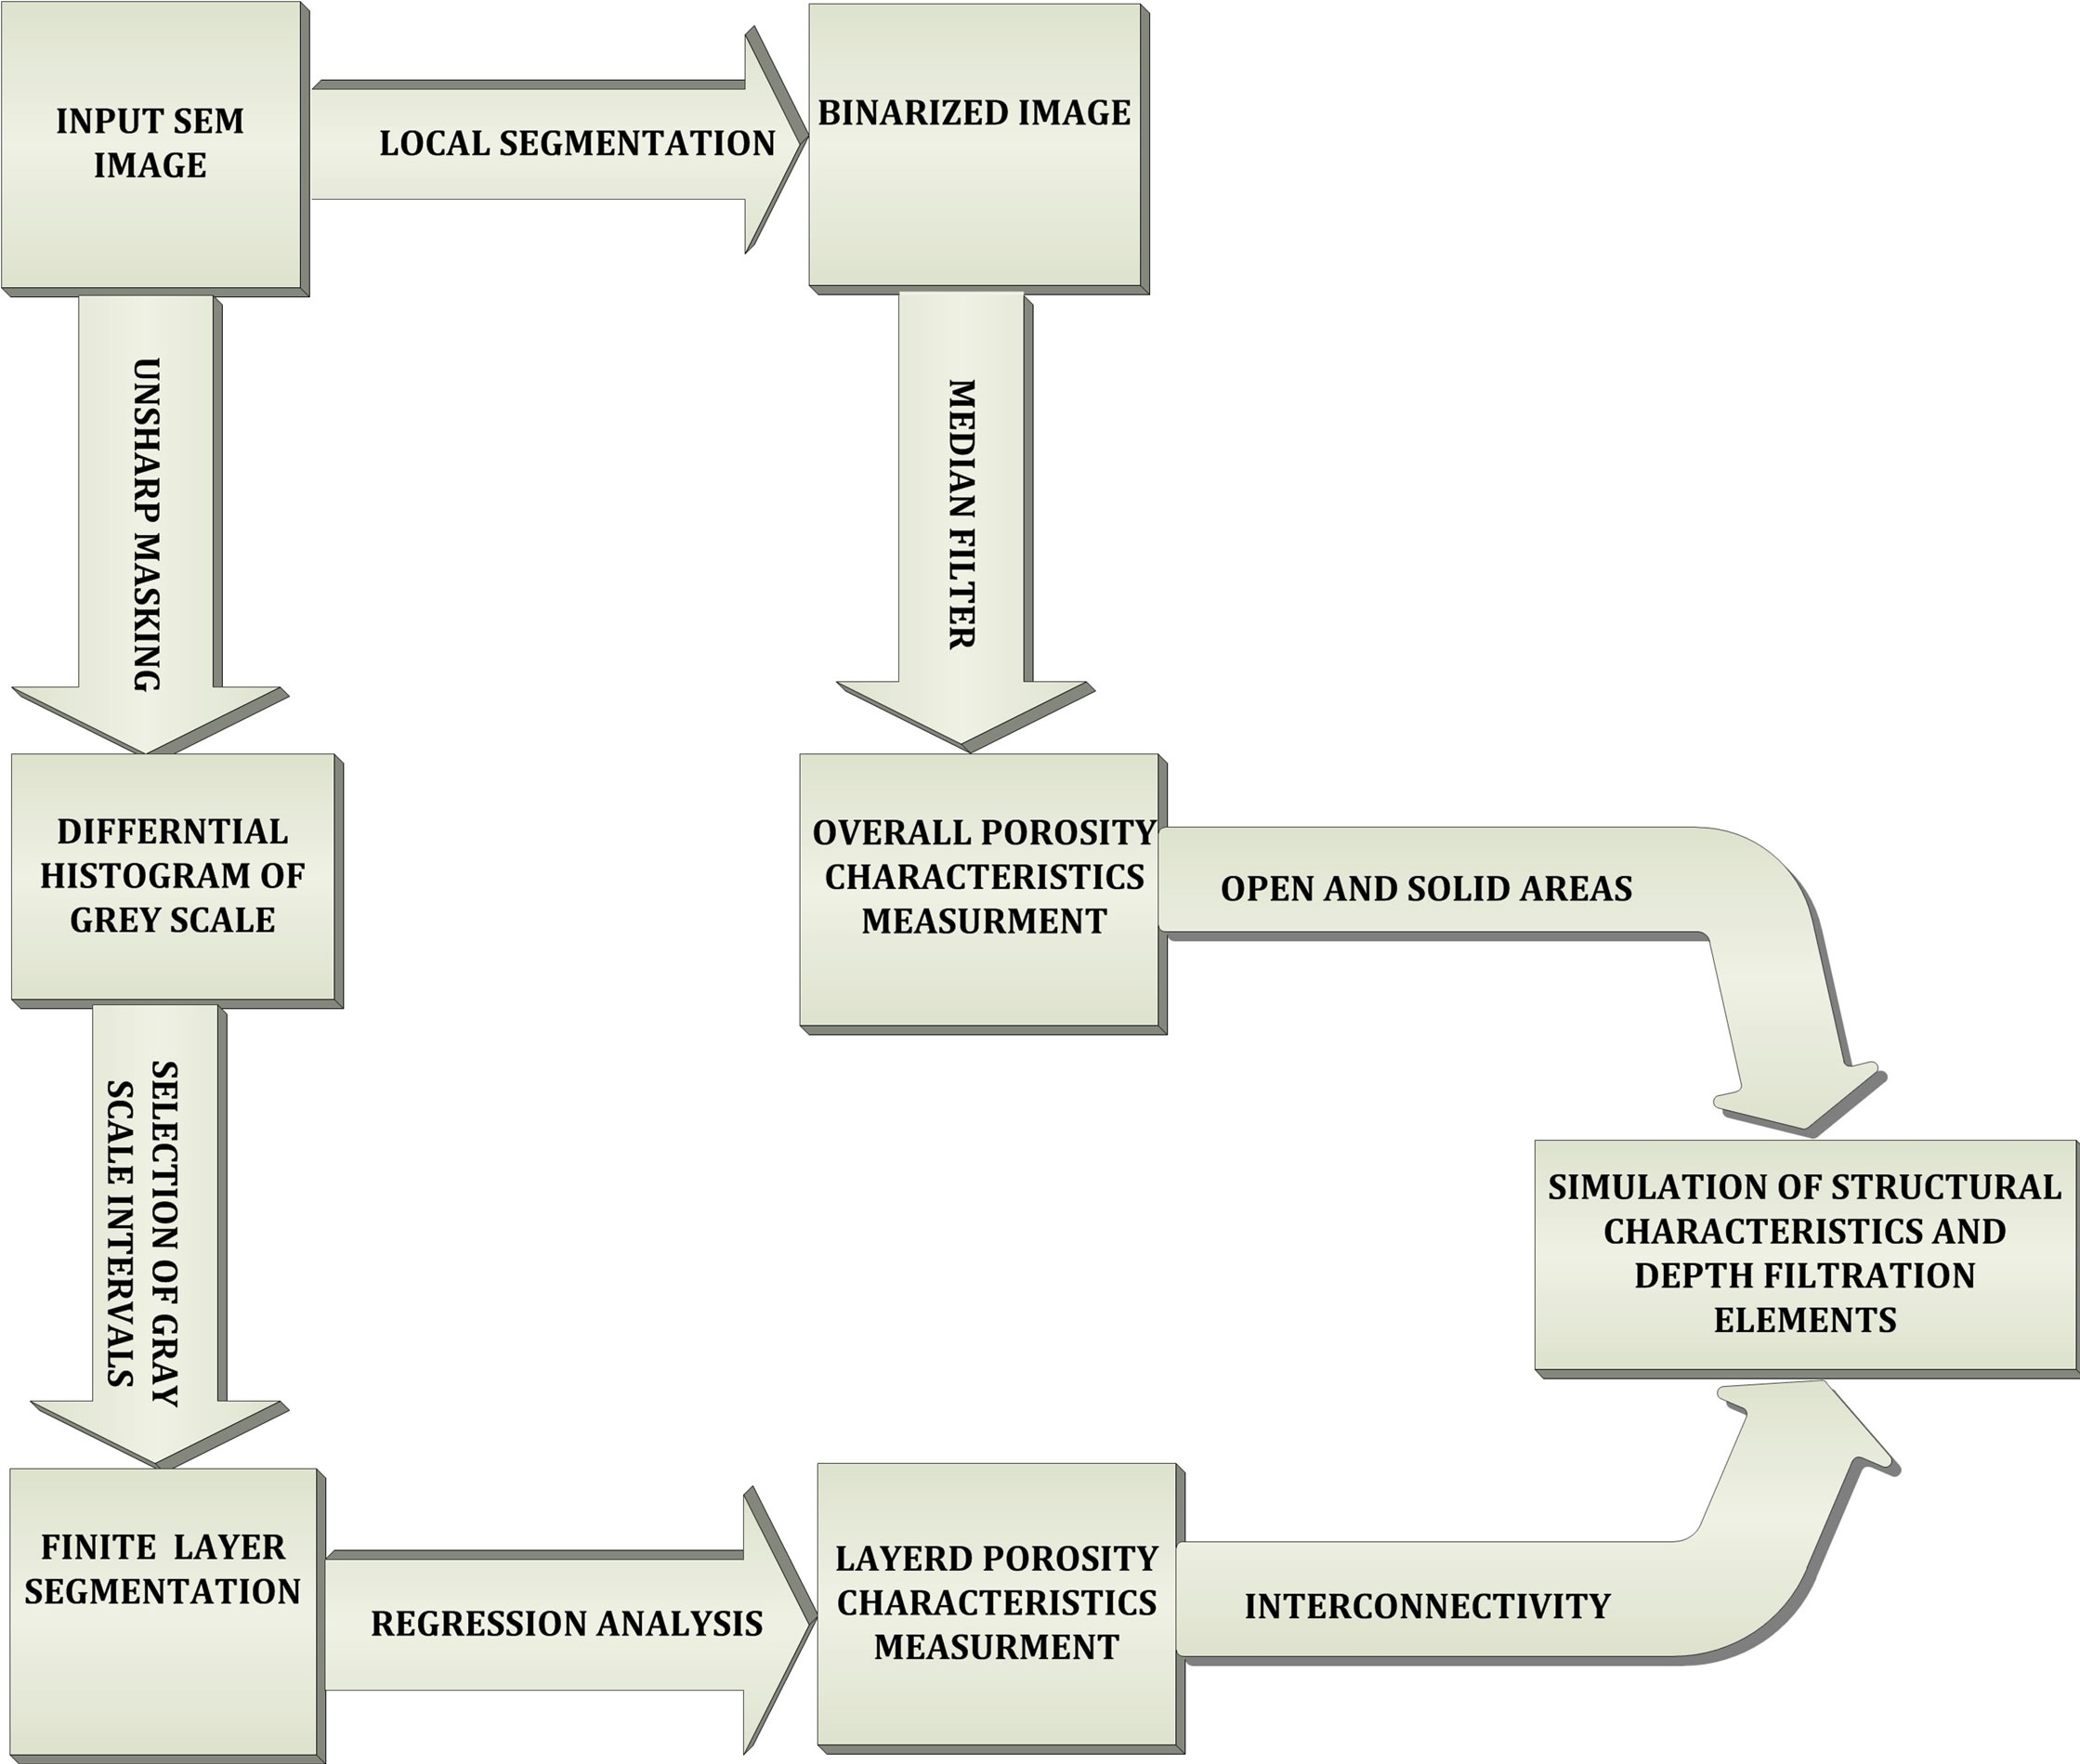
The permeability and filtration properties of a fibrous membrane are determined as a function of three crucial parameters, known as the open area, solid area and interconnection. The proposed method relies on the projection of the open area (overall porosity) and solid area (fibrous network) from the image in the 2D plane. While the interconnection is estimated by the trend of blocking pore channels throughout the depth of the membrane profile [17]. This trend can be identified as an increase in cumulative open area from sublayers to the surface layers at the membrane profile (see Figure 1).
2.1. Segmentation Procedure
The first step of the proposed algorithm involves the precise segmentation of a 256 grey-scale image to binary form using the threshold procedure. Thresholding is a simple but effective process for object segmentation from the image background. The procedure is also essential with regard to obtaining measurement accuracy, and the selections of the following sequences of morphological operations are highly depend on it. Of the aforementioned thresholding methods, only local thresholding seems to meet the structural requirements of a fibrous membrane. This may be due to the multilayered architecture of the membrane, as the intensity gradient of the image is inhomogeneous, varying locally from surface to sublayers. The non-uniform intensity gradient throughout the membrane profile prevents realistic binarization.
The local criterion approach can tackle this segmentation problem by dividing the image into various subimages. The boundaries of local sub-images are determined based on neighbouring pixels within a specific radius, while the threshold values dynamically change over these boundaries [26-30].
In addition, based on the local approach, deviations caused by applying different magnifications are minimized by selecting the radius of the local region proportionally to the change in magnification. Several local thresholding methods have been developed, of which the most commonly applied are mean, median, MidGrey, Bernsen, Niblack and Sauvola [26,31]. Of these methods, Bernsen and Sauvola (as an improved version of Niblack) have inherent advantages for use in high contrast areas. However, Sauvola thresholding is edge-sensitive
 (a)
(a)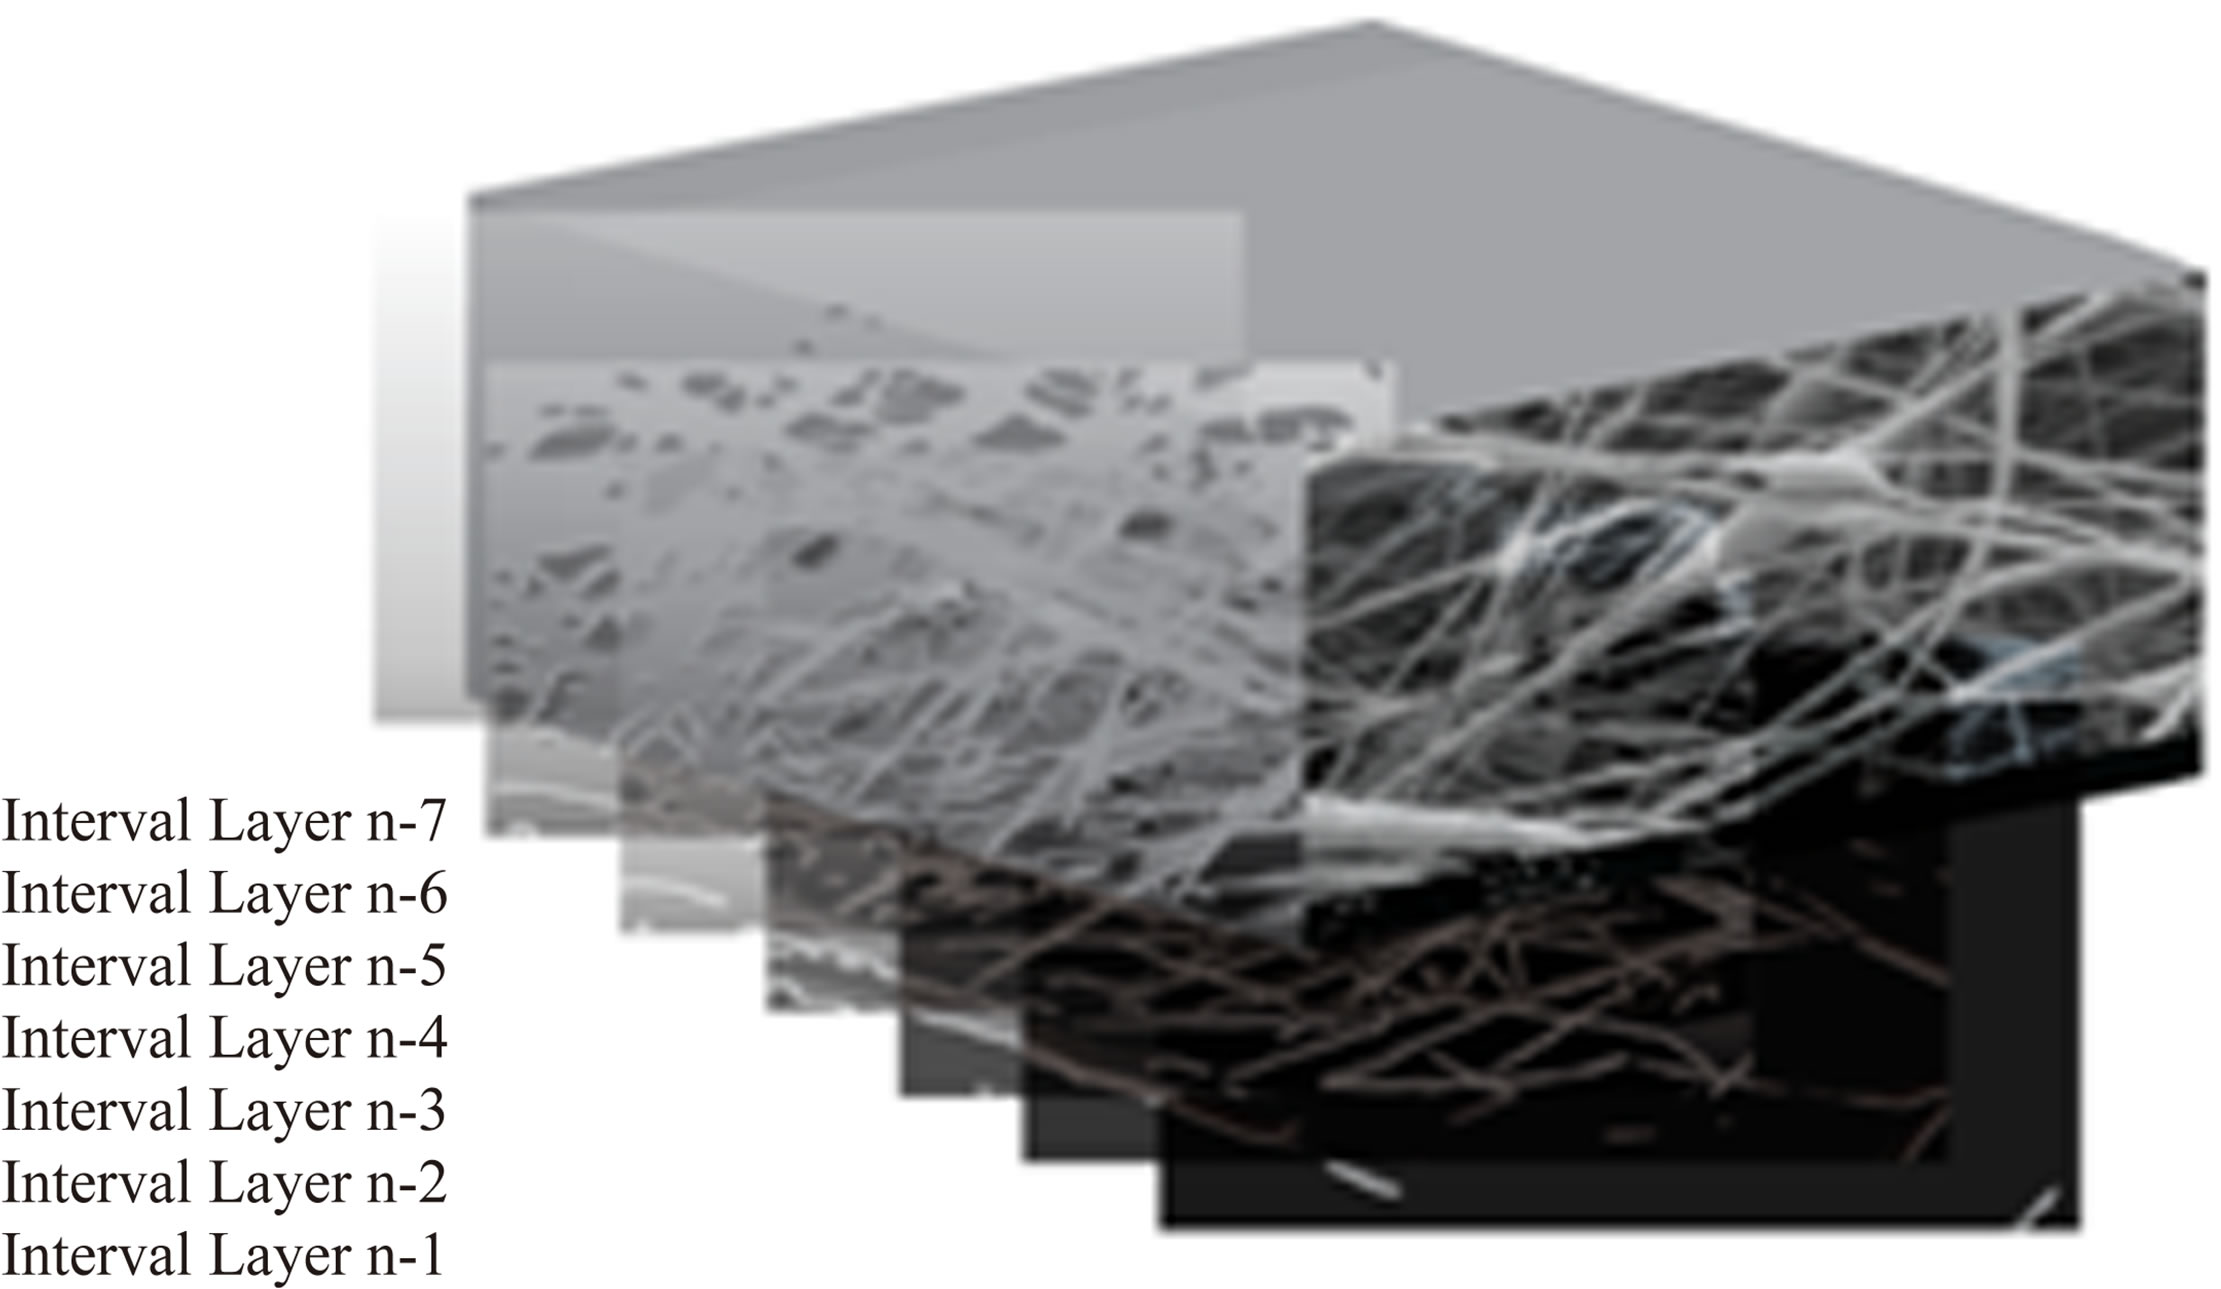 (b)
(b)
Figure 1. (a) Flow chart of the proposed image analysis method; (b) 3D illustration of electrospun membrane segmented by seven cumulative layers (interval layers) from infinite n layers.
and more appropriate for high-contrast regions with some faint connection [26,32-34].
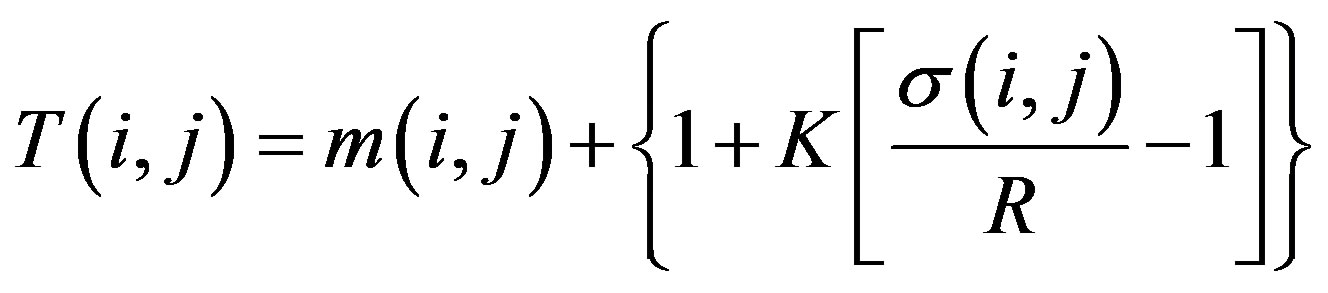
On this basis, the Sauvola method seems to be particularly suitable for fibrous membranes where fibres intersect on several layers forming a porous architectureExperimental observation of nanofibre images confirmed this theoretical concept. As shown in Figure 2, the Sauvola method exhibits structural imperfections (beads, solution dripping) and fibre deposition more realistically than other versions. The local threshold T(i,j) is indicated as a function of the coordinates (i,j) at each pixel calculated from Equation (1) [26]:
 (1)
(1)
where k = 0.5 and R = 128.
2.2. Porosity Characteristics Measurement
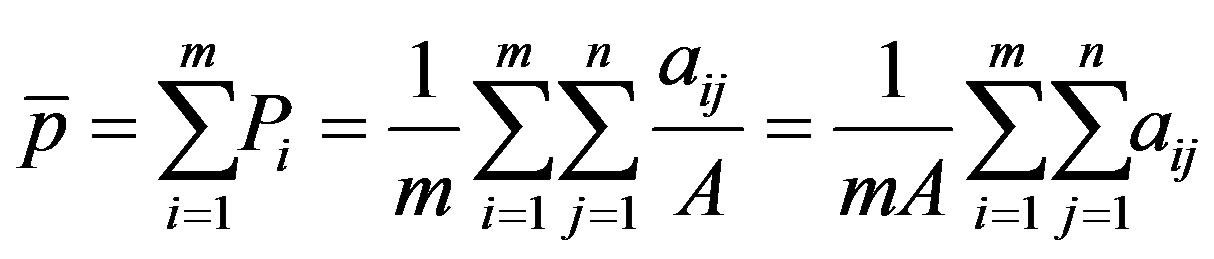
Depending on the preferred accuracy of measurement, m number of images are selected and converted to binarized mode and the mean porosity computed from Equation (2) [17]:
 (2)
(2)
where A is the total scanned area, aij is the pore area j found on the image i of the corresponding nanofibre mat. Pi is the porosity calculated based on the image number (i) and m is the preferred number of images. To reduce image noise and irregular clustering of pixels, applying a median filter as a smoothing morphological operator and defining a minimum cut-off value for recognizing the interested areas is highly recommended. The size (radius)
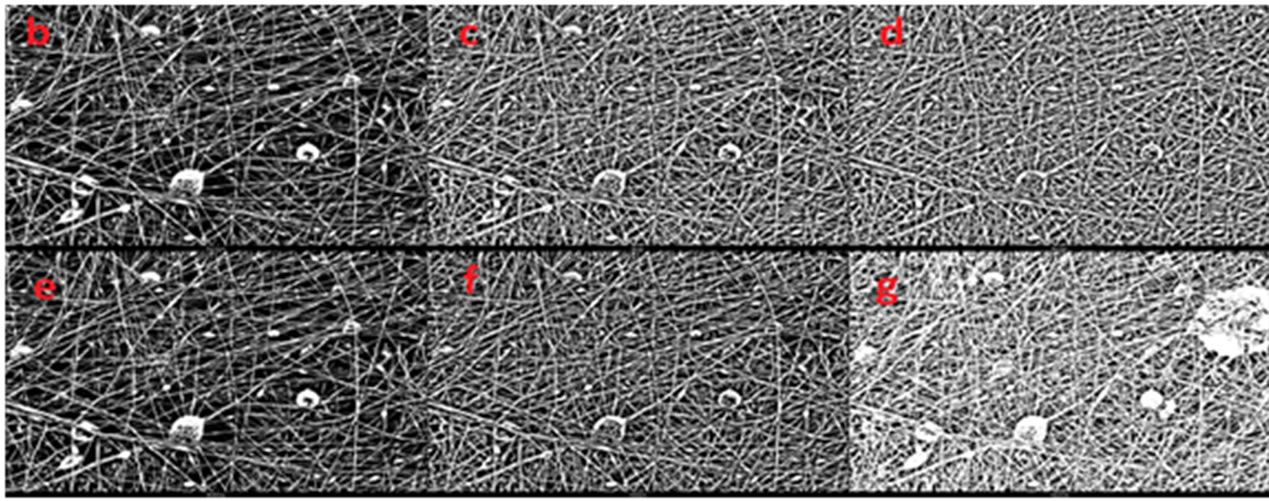
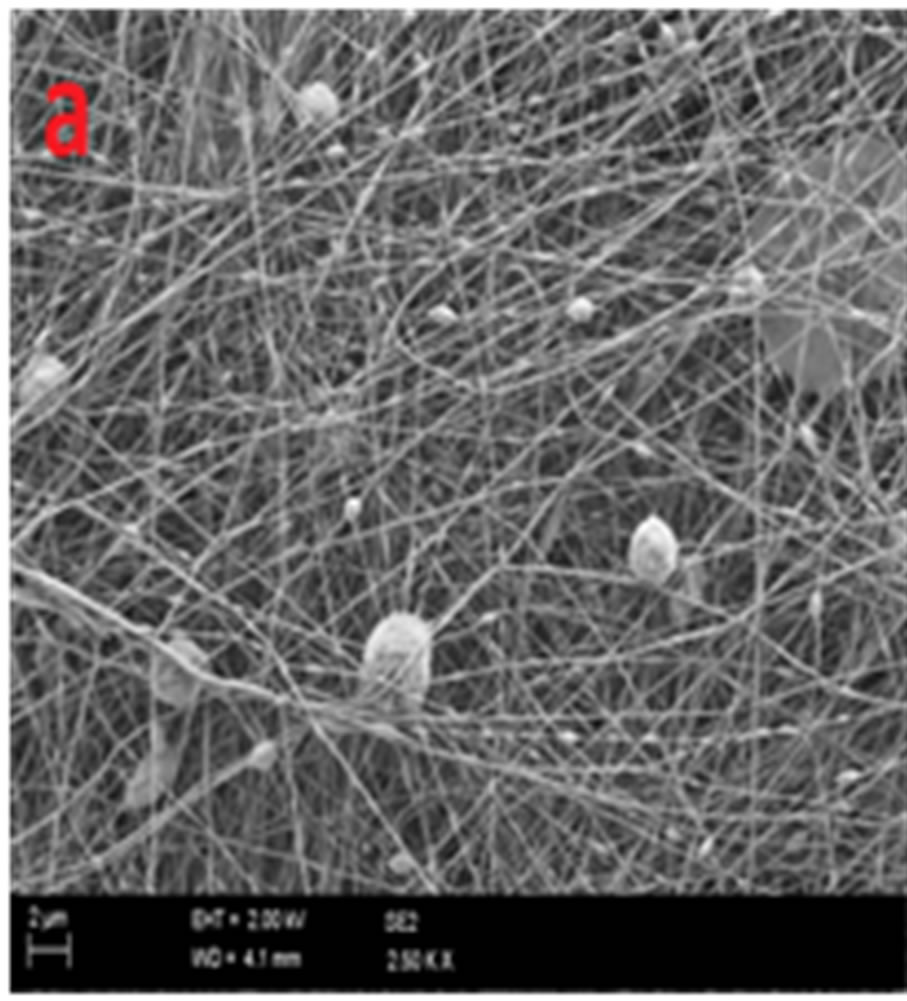
Figure 2. Original and binarized images by different local thresholding methods at radius r = 15, (a) Original SEM image (magnification 2.5 KX); (b) Bernsen; (c) Mean; (d) Median; (e) MidGrey; (f) Niblack; (g) Sauvola.
of local windows for the median filter should be in adherence to the relative ratio of magnification. The pore size was evaluated by measurement of the maximum Feret’s diameter, which is defined as the longest distance between two parallel tangents at an arbitrary angle in the boundary of a pore area [35-37].
2.3. Layered Porosity Characteristics Measurement
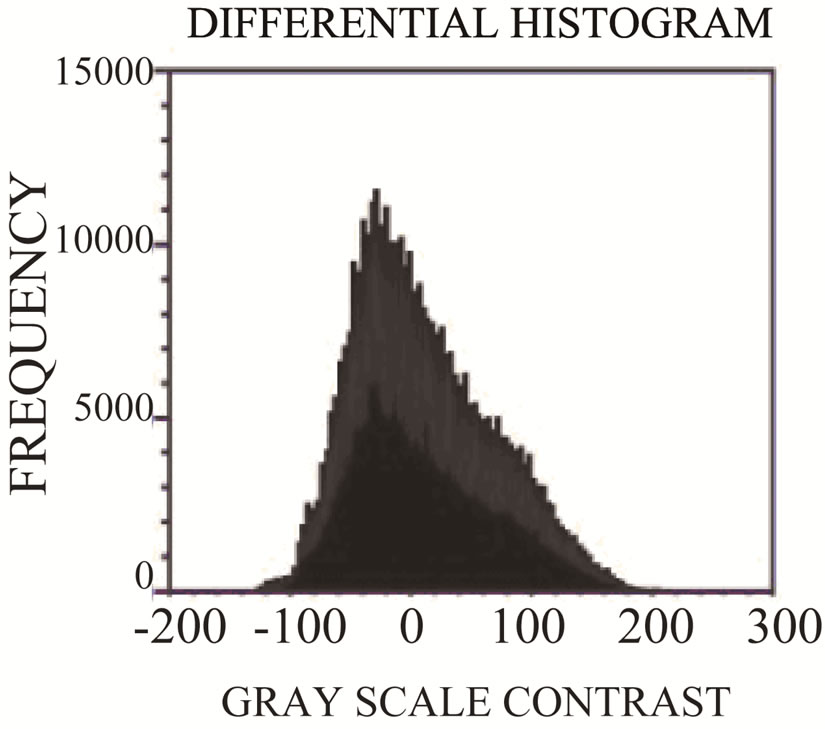
To study the depth filtration behaviour based on solid and open area, the structural elements layer by layer throughout the profile need to be accurately measured. Finding the edge of overlapping layers by analysing the intensity variation at selected local windows seems to be the best approach for layer-by-layer segmentation. One practical method is to use a differential histogram of intensities by applying unsharp masking where the edges of overlapped fibres are more discriminated. Unsharp masking is a manipulating technique used in image processing that achieves edge enhancement by amplifying components that have high intensity [38-40].
In the algorithm, a median filter that is well-known to remove local outliers from images [41,42] is used as the unsharp operator at the selected local window. After unsharp masking, the histogram of grey-scale contrast has a unique feature that can be used to segment the edge of objects from the background locally.
This approach is well-suited for our purposes because the edges of the image (high intensity contrast) are positioned exactly at the layer interface.
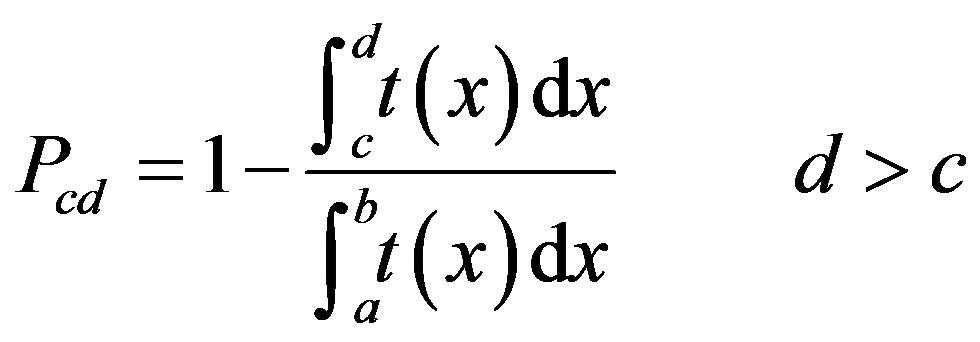
By exhibiting local contrast values, the differential grey-scale histogram provides important statistical parameters for layer-by-layer segmentation (see Figure 3(b)). Theoretically, if we consider the differential histogram as a curve, the area bounded by the x-y (grey-scale contrast-frequency) plane represents the total pixels in the image. By selecting a specific grey-scale interval, the number of pixels within a distinct grey-scale level can be calculated. The result obtained from this integral calculation is the solid area (fibrous network) in a given grey-scale interval. Subtracting this solid area from the total area gives the layered pore area between two points (c and d) of grey-scale contrast. Furthermore, the layered porosity fraction at [c,d] can be calculated from Equation (3):
 (a)
(a)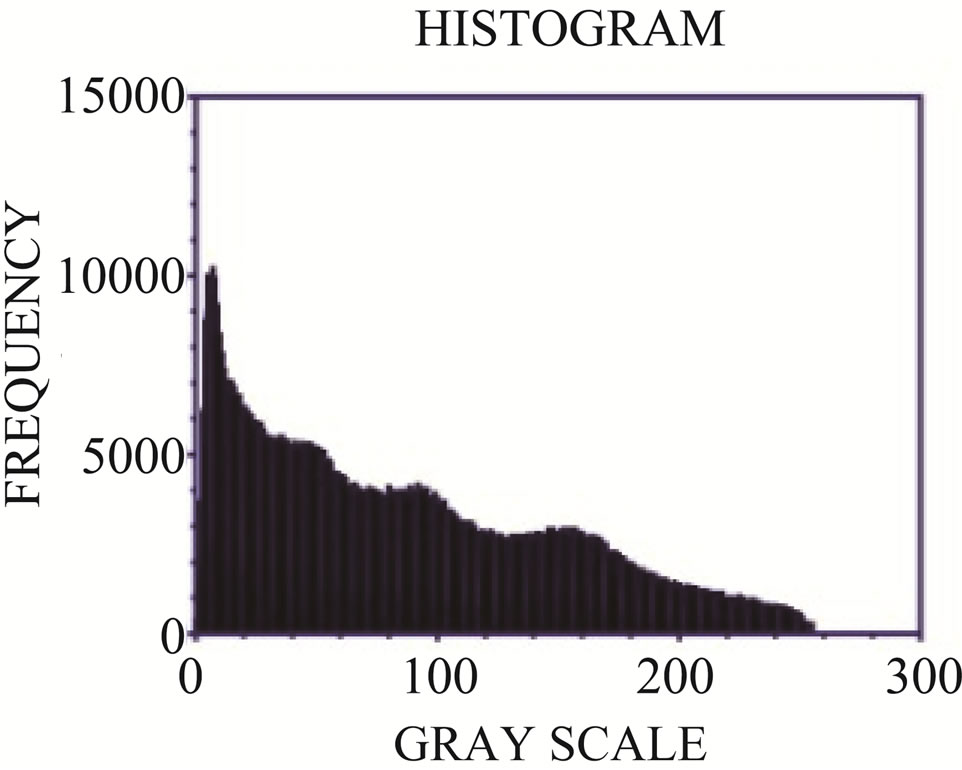 (b)
(b)
Figure 3. Comparison between (a) a grey-scale histogram and (b) a differential histogram of grey-scale contrast after unsharp masking.
 (3)
(3)
where  is the differential histogram curve, b and a respectively are the supremum and infimum of greyscale contrast, and Pcd is the layered porosity fraction at the [c,d] intensity interval.
This approach is well compatible with random deposition of fibre in an electrospinning mechanism in which each nanofibre layer is positioned at different depths throughout the membrane profile and should be identified by a specific interval rather than a discrete value for grey-scale contrast.
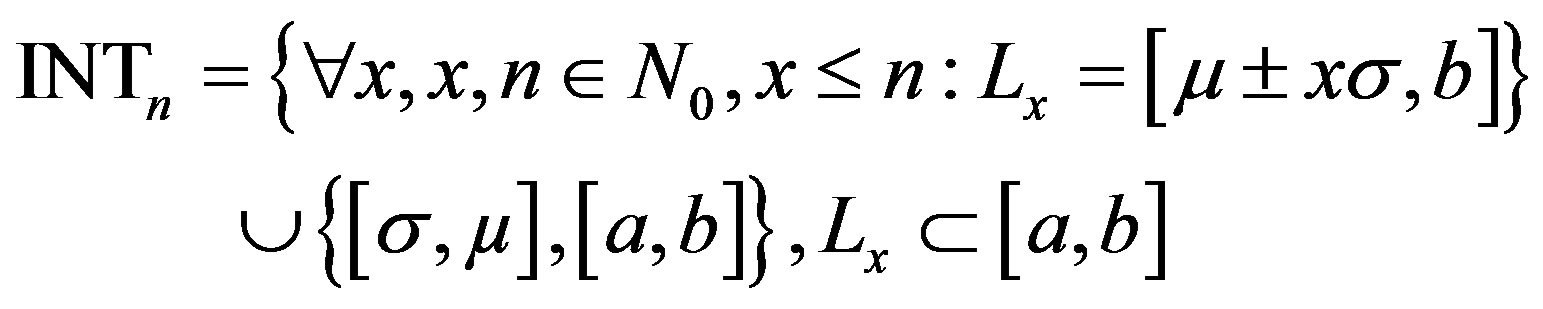
By extracting statistical data such as the mean (μ) and standard deviation (σ) from the differential histogram, it is possible to select the best intervals (INT) that precisely simulate a fibrous network with finite layers. To add the interconnectivity of the layers to the simulation, the interval sequence should be such that each interval overlaps with the previous interval, with the last interval covering the entire range of grey-scale contrast (Equation (4)):
 (4)
(4)
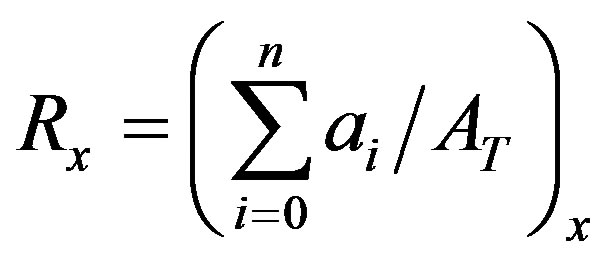
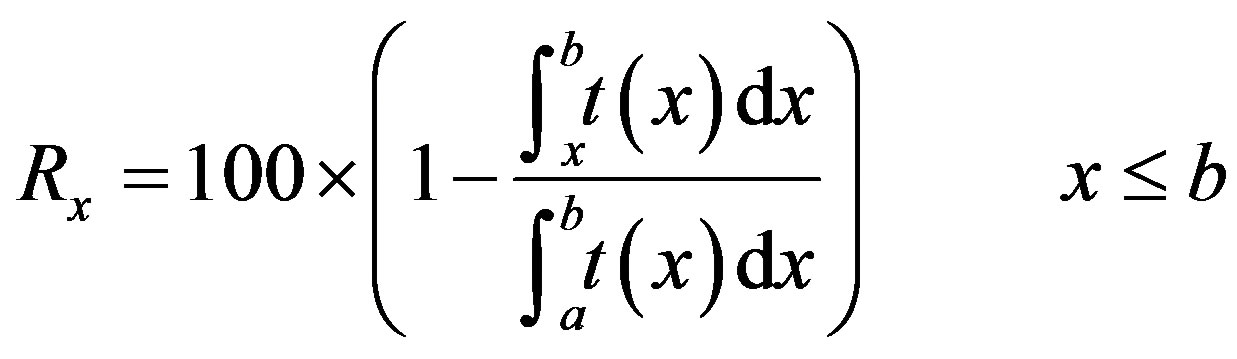
The number of intervals needed for the layered simulation depends on the statistical parameters of standard deviation, mean, supremum and infimum of grey-scale contrast. The slight reduction in pore area due to overlapping of the different layers in the fibrous network can be shown by defining the discrete function Rx exhibited in Equation (5) [17]:
 (5)
(5)
where x is the number of layers,  is the remaining pore area after x layer depositions, and
  is the total area. Overlapping of several layers causes narrowing of the open areas until the penetration channel is totally blocked.
If Equation (5) is substituted by data from the greyscale contrast, from the modelling using a (infimum value) as the sublayer and b (supremum value) as the surface layer, the equation exhibits an increasing trend. This equation can be modified in the form of Equation (6):
 (6)
(6)
From Equations (3) and (6), when x = c and b = d it can be concluded that the numerical value of the blocking open area is equivalent to the layered porosity at depth x in the membrane (Rx = Pxb).
Based on the above, the interconnectivity of the fibrous membrane can be estimated by finding the best fitted curve (trend) derived from regression analysis of layered porosities throughout the depth of the membrane. Based on the bell shape of the grey-scale contrast histogram and related mathematical principals, it was found that dose-response curve is the best model for evaluating the best trends for layered porosities in our simulation (see Figure 4). Dose-response curves are generally used to explain the results of in vitro experiments where the known concentrations of a drug are varied. This template can be extended to any experiment where by variation of a known parameter the corresponding results are compatible with the basic principle of dose-response relations. In the present study, however, the aim was to apply this model to layered porosity only with respect to the regression of results based on mathematical features, as opposed to dealing with dose-response relations. The following two aspects of dose-response regression [43] are of key importance to our simulation:
1) Half way open area (O50): the cumulative layer with a half open area in the membrane
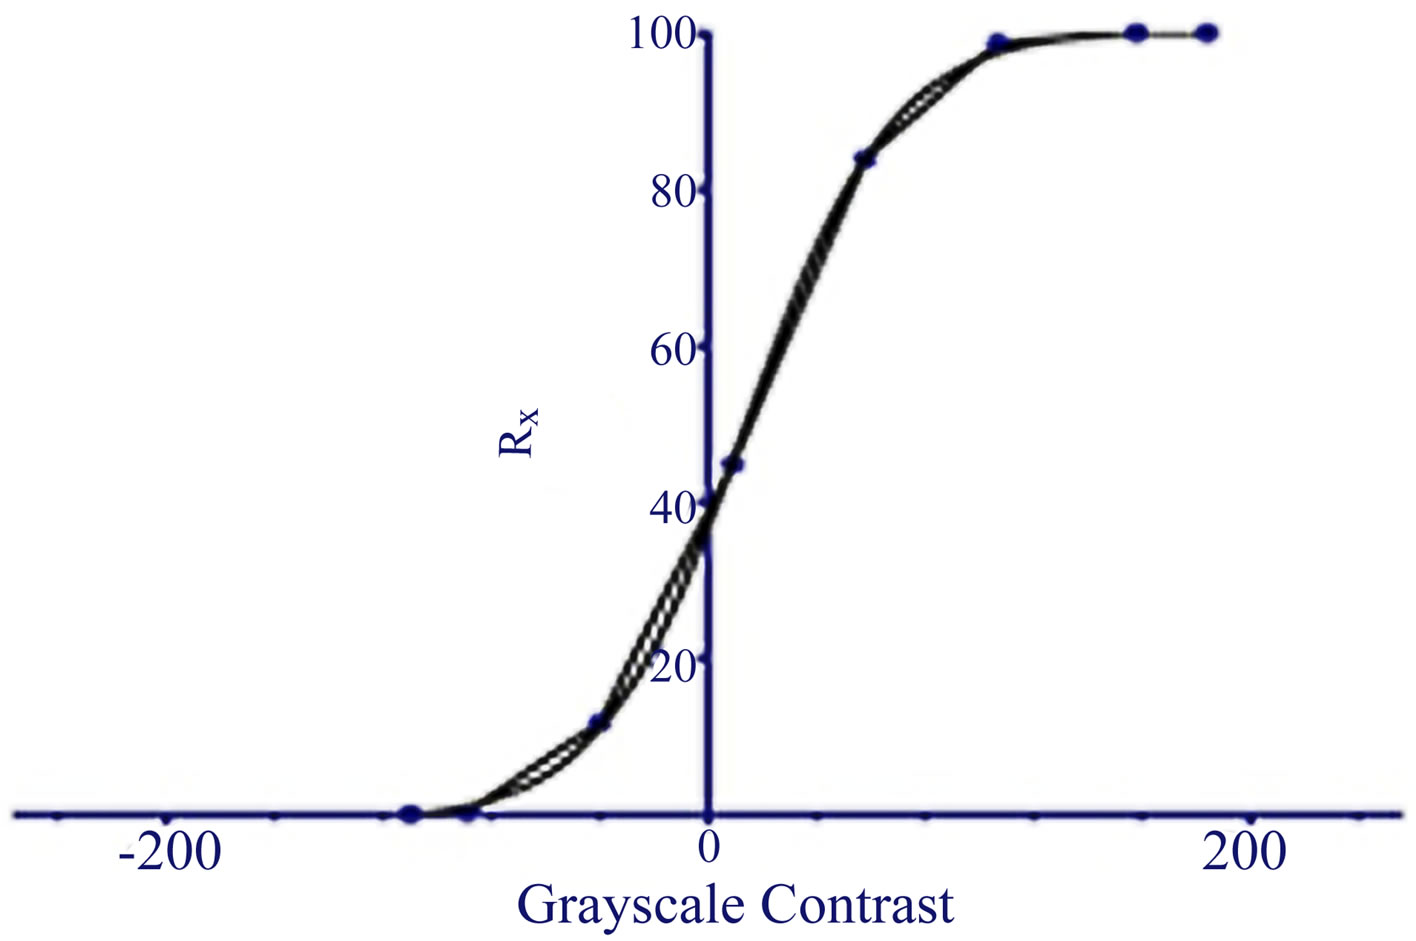
Figure 4. Best-fit (dose-response) curve for layered porosity from non-linear regression analysis.
2) Hill slope (H): the steepness of the dose-response curve is described by the hill slope, where a higher value indicates faster blocking of accessible channels (less interconnectivity), and a low value indicates that the open area narrows moderately (high interconnectivity).
On this basis, H can be assumed to be the reciprocal index of interconnectivity of the membrane. The general model for best fitted curve for layered porosities is illustrated in Equation (7):
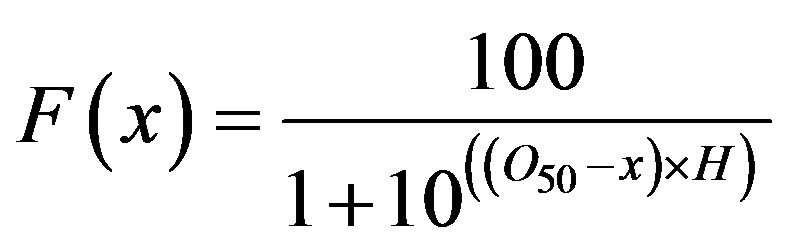 (7)
(7)
where O50 is the half way open area, x is the grey-scale contrast and H is the hill slope of the dose-response curve.
2.4. Intrinsic Structural Properties and Their Relation to Depth Filtration Elements
Tehrani et al. [17] introduced a factor known as scaffold percolative efficiency (SPE) to contribute interconnectivity and mean porosity to the characterization of the permeation properties of an electrospun membrane. They hypothesized that an exponential curve is the best fit for layered porosity regression, and its slope (b) can be assumed as a reciprocal index of interconnectivity. However, the layered porosity measurement via our algorithm revealed that the exponential curve was not sufficiently compatible for exhibiting the layered porosity trend. Therefore, the scaffold percolative efficiency factor (or permeation efficiency constant) was modified via our approach as follows:
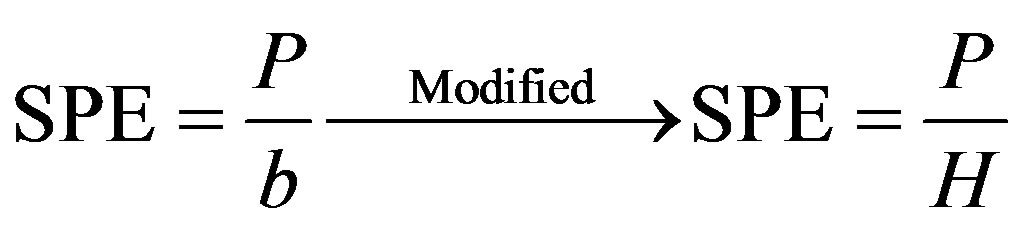 (8)
(8)
where P is the overall porosity, b is the slope of the exponential curve and H is the slope of the best-fit curve.
In depth filtration, regardless of the theoretical and empirical expressions attributed to dynamics and size of particles, the fractural permeation and filtration efficiency are correlated to porosity and solid area fraction (fibrous network). The fractural filtration efficiency is measured by Equation (9) [44]:
 (9)
(9)
where  is the upstream and
  the downstream concentration corresponding to the particle size dp. If it is assumed that each cumulative layer based on its pores size and solid area (fibre network) acts as a discrete filtration element, E(dx), the filtration efficiency of the layer positioned at point x in the depth profile can be determined from Equation (10):
 . (10)
During depth filtration, the rate of change in particle concentration passing through the depth profile is proportional to the concentration and the constant filtration efficiency of the membrane ( ) [45]
 . (11)
In the grey-scale contrast histogram,  represents the interval (area) in which the permeated particles are filtered at depth x in the membrane profile. This area, known as the solid area fraction, is determined by the fraction of fibrous networks at depth x in the membrane profile (Equation (12)):
 . (12)
From Equations (6) and (12), it can be concluded that:
 (13)
(13)
 . (14)
The overall filtration performance of the membrane can be measured from Equation (15) [46,47], where E and P are the filtration and permeation in the membrane.
 . (15)
As represented in Equations (14) and (15), it can be concluded that the permeation efficiency follows an identical trend to F(x) (layered porosities approximation), as well adherence to the negative trend of filtration efficiency in the depth profile of the membrane.
For optimization of the membrane for depth filtration, the permeation and filtration efficiency should be identical to 50% (x = O50, F(x) = 50%). Computing the pore size distribution at this point may facilitate the elucidation of the quality of depth filtration for particles within a specific geometrical range. Furthermore, the quality of depth filtration is dependent on the range of pore size within the membrane. This range can be named as the optimal pore size (OPS) and can be estimated based on the mean pore size of the total and half open areas, and directly correlates to the size of open areas within the interconnected structure.
As mentioned earlier, overall porosity and SPE are estimated based on averages of n arbitrary images captured from several regions within the membrane. However, in the case of depth filtration elements such as F(x) and OPS, due to inhomogeneous distributions of fibres throughout the membrane, the comparison should be done on a regional rather than overall basis. As an example, the reciprocal interconnectivity index and OPS of two images from different membranes shown in Figure 5 are measured and reported as follows respectively: OPS1 = [212 - 482], H1 = 0.03, OPS2 = [370 - 530] and H2 = 0.02. As shown in Figure 5, the trace of the simulated halfway open channel (E = P, F(x) = 50%) can be identified more readily in the projection of total open area (overall porosity) in membrane 2 compared to membrane 1) This is due to the higher interconnectivity and lower tendency for blocking accessible channels of membrane 2) It is noticeable that the OPS parameter is only a comparative index for scaling the interconnected open area which is capable of hosting the transport media in the 3D architecture, but cannot reflect the real optimal particle distribution without consideration of transport media dynamics in depth filtration.
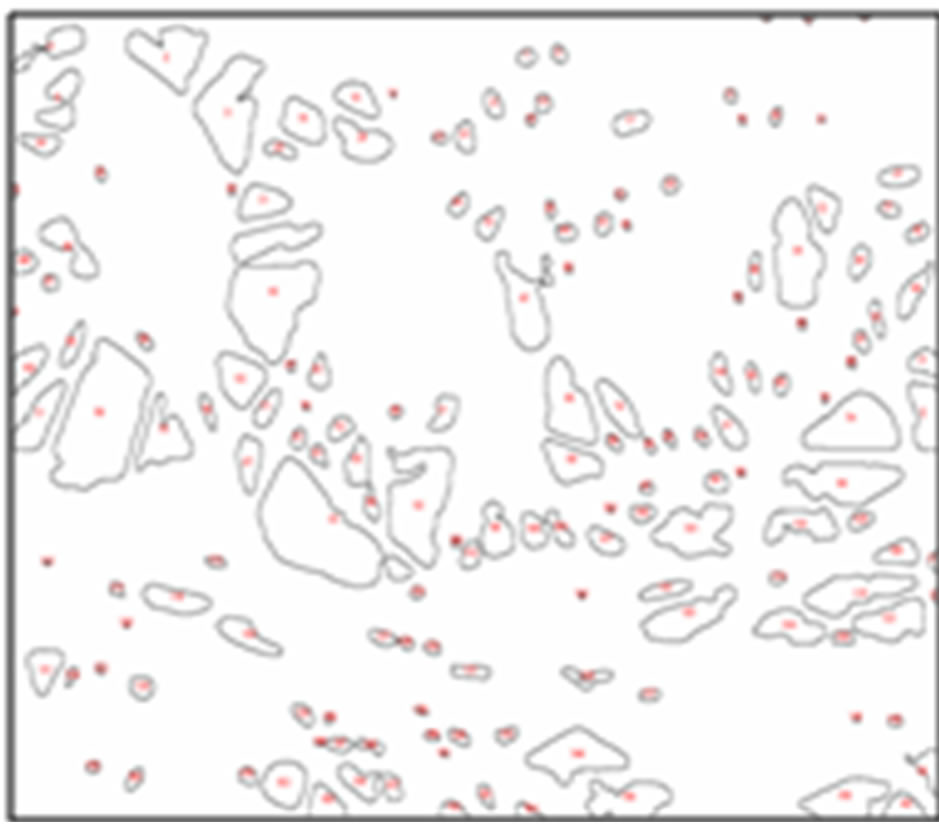
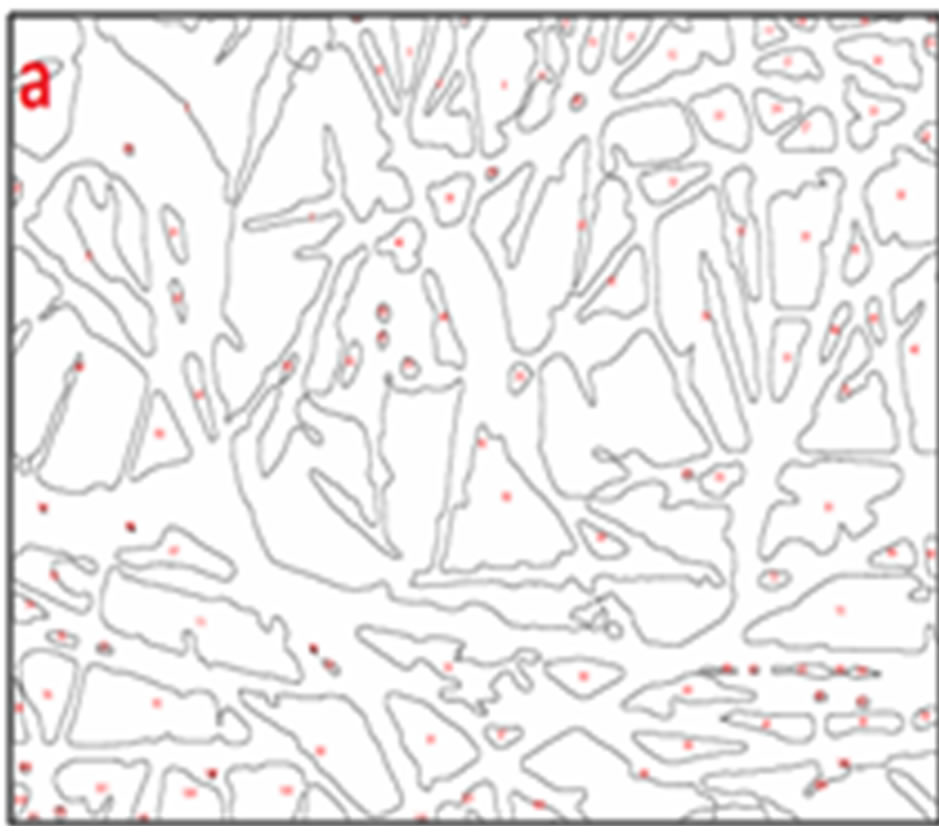
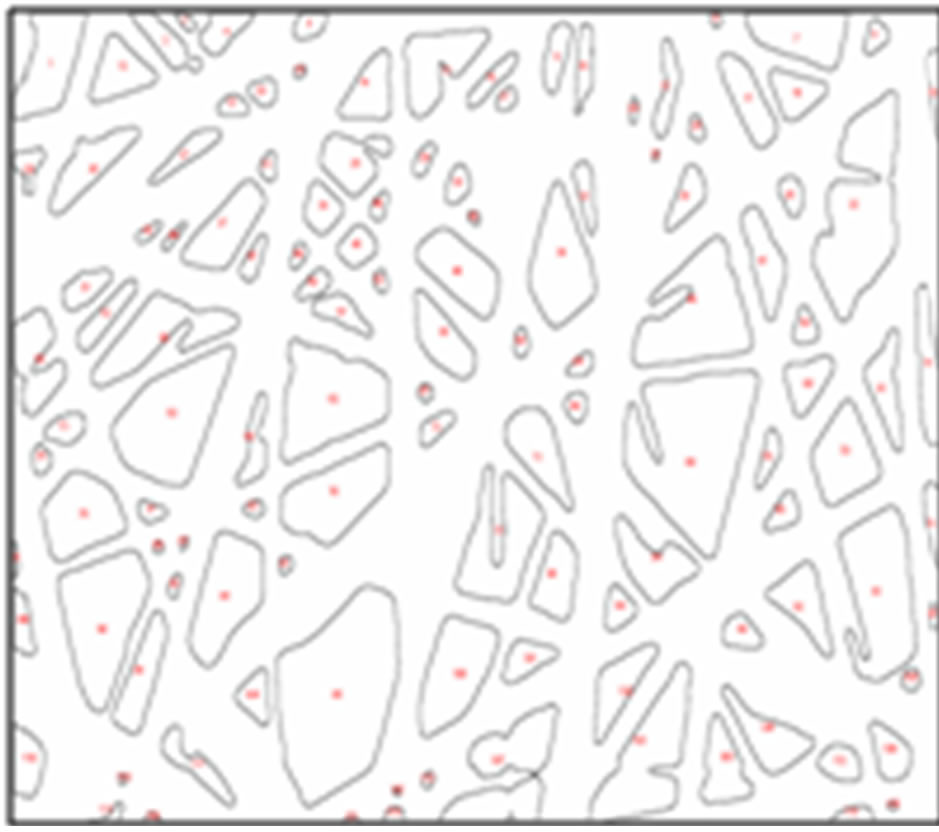
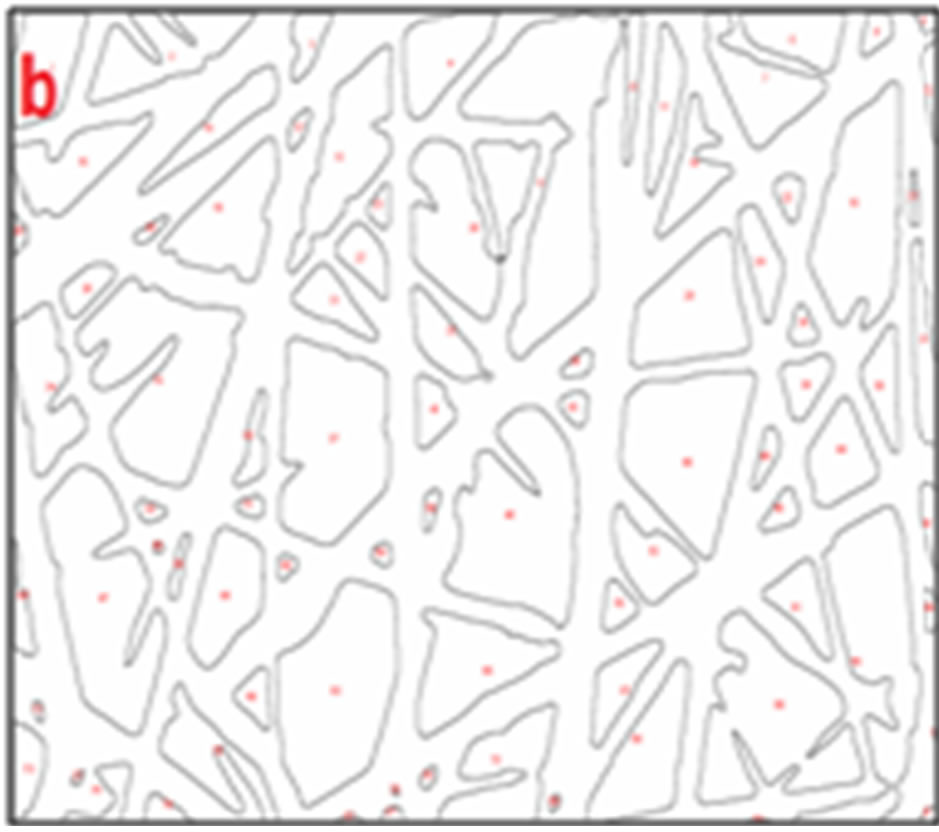
Figure 5: Comparison between simulated open pore areas of (a) the sample image with  and (b) the sample image with
  at the half cumulative layer (x = O50) and the projection of open area in the 2D plane (overall porosity).
3. Method Implementation and Validation
The overall porosity, mean pore size, interconnectivity and SPE of each membrane were characterized based on four FESEM images captured from different areas of the electrospun web. The proposed algorithm was implemented by ImageJ (version 1.43 m), a common-use scientific Java-based software [48], in order to increase its usability in real-time applications. To investigate and affirm the reliability of non-linear approximation of layered porosities, the GraphPad Prism [49] commercial and scientific software was used. The results are discussed and validated based on empirical observations of perfect nanofibre membrane structures. In the case of depth filtration elements such as F(x) and OPS, the measurement and comparison were done on a regional basis. Mean fibre diameters were evaluated based on 40 measurements of each sample membrane.
4. Results and Discussion
As alluded to previously, pore interconnections are formed by random deposition of fibres during the electrospinning process. Based on this phenomenon, pore interconnectivity in electrospun membranes is correlated to the mechanism of fibre deposition and the structural imperfections induced in the fibrous membrane.
However, the significance of each parameter on the variation of interconnectivity is different and mostly depends on the degree of induction of such imperfections. Structural imperfections can be classified in two main groups. Firstly, imperfections that partially influence the structural properties of the membrane; bead structure along the fibre axis and partial solution dripping can be included in this first category.
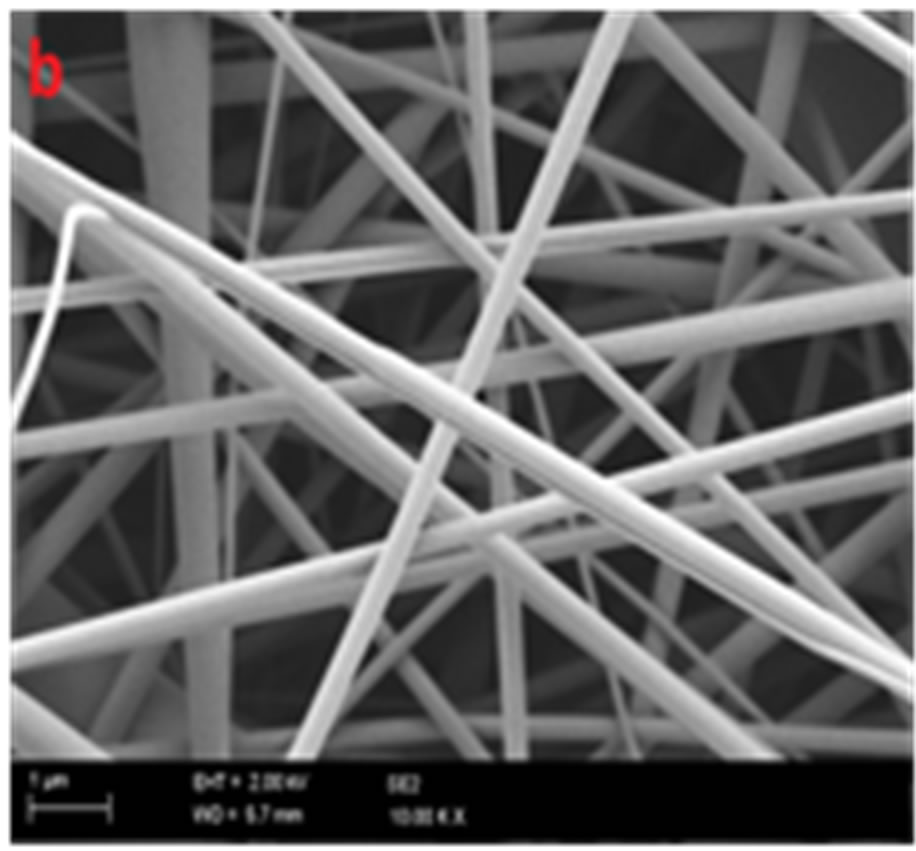
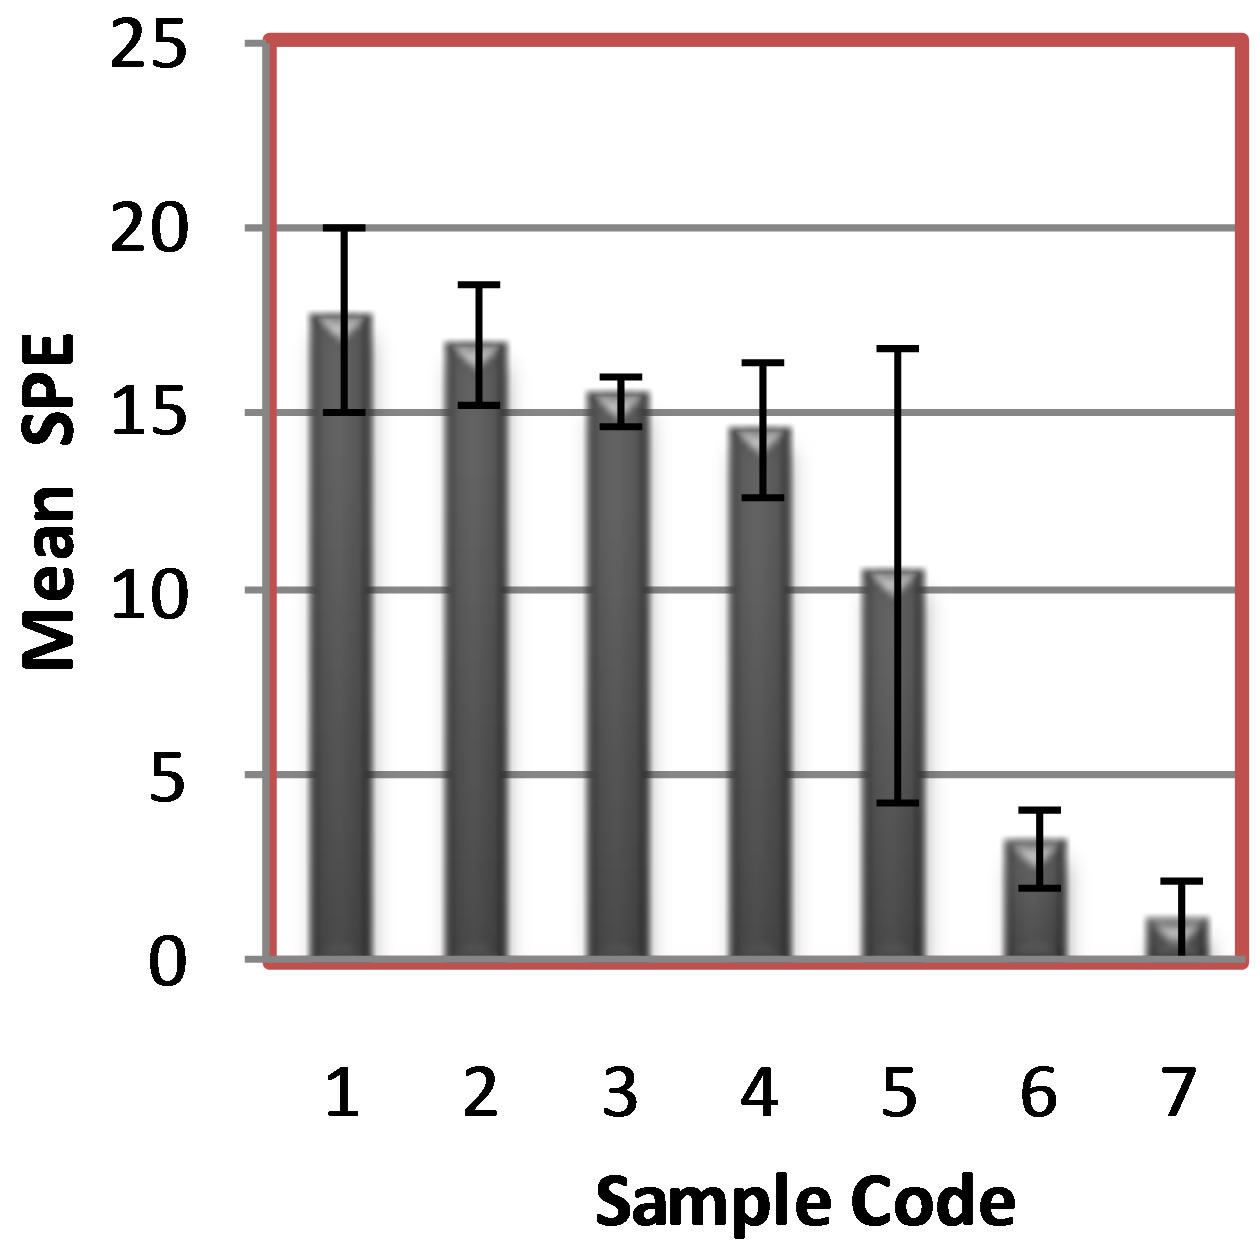
Secondly, structural imperfections that interrupt the entire membrane structure and influence the overall characteristics of the membrane. Examples of the latter include high fibre size and low fibre deposition originating from fundamental processing parameters in electrospinning, leading to induced high degree of imperfections or structural differences in the membrane. To verify the proposed method, the structural characteristics of seven samples with different morphological features were measured and ordered in accordance with their respective scaffold percolative efficiency (SPE), as shown in Figure 6. It was observed that the morphology and structure of the first four samples (1 to 4) came close to fulfilling the perfect criteria for depth filtration due to adequate fibre deposition. In contrast, the last three samples fell well short of these criteria due to low fibre deposition resulting largely from inappropriate processing parameters. The quantification of interconnectivity (see Figure 7(c)) revealed that when fibre size decreased, interconnectivity increased. Membrane 1 compared to membrane 2 and
 (a)
(a) 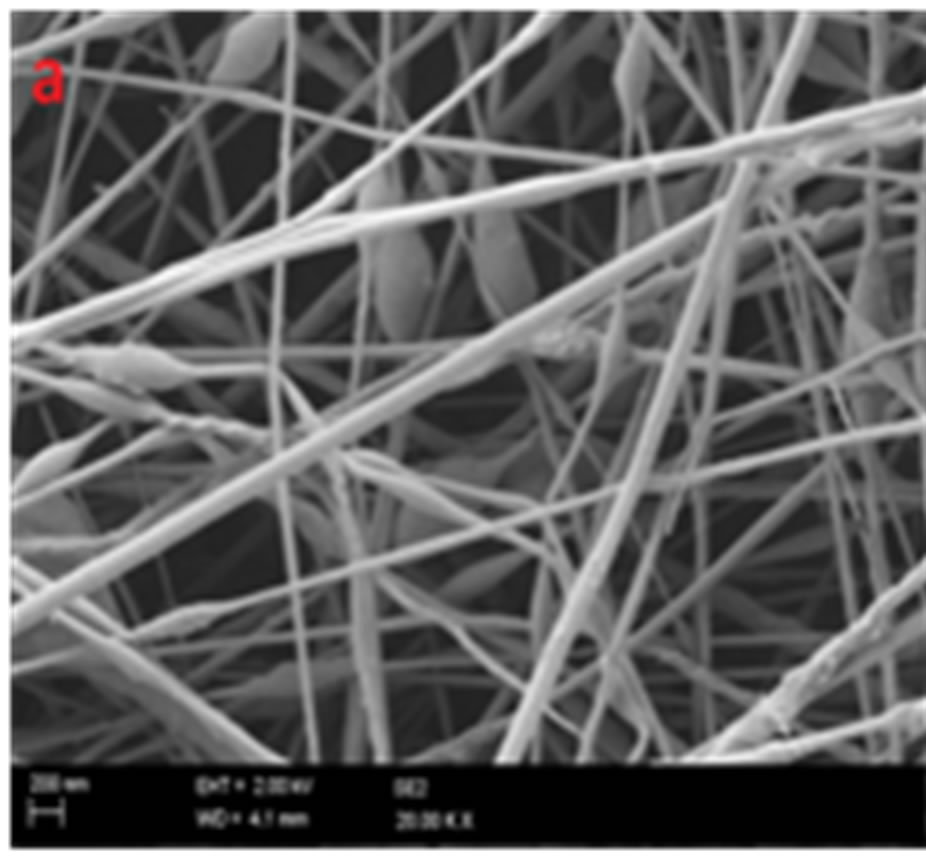 (b)
(b) 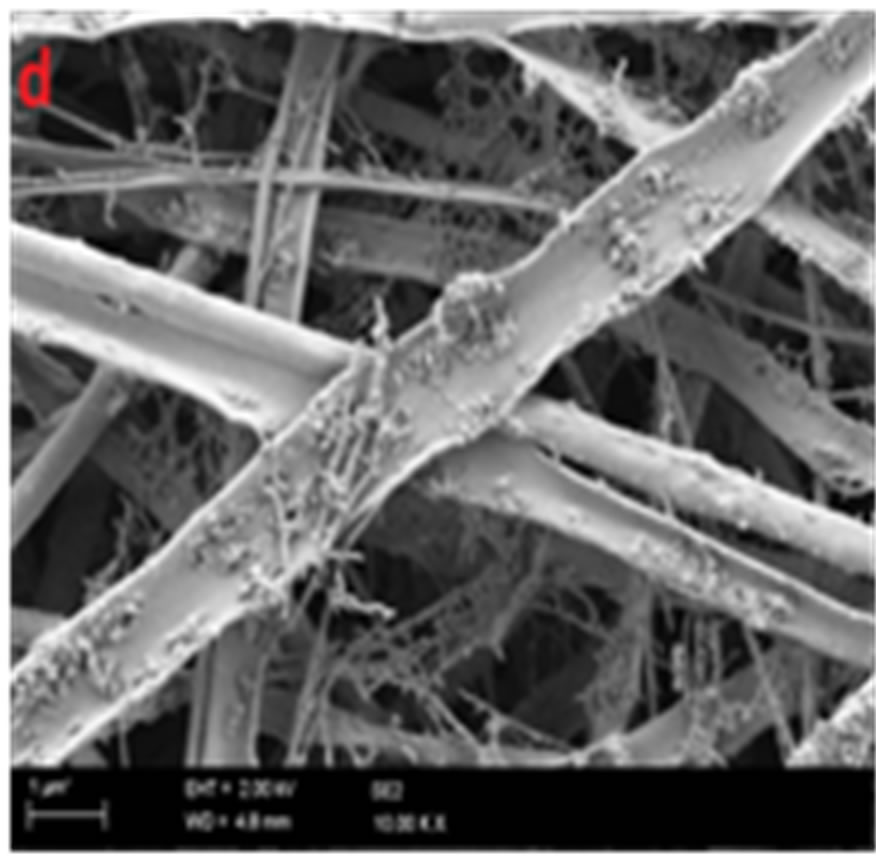 (c)
(c) 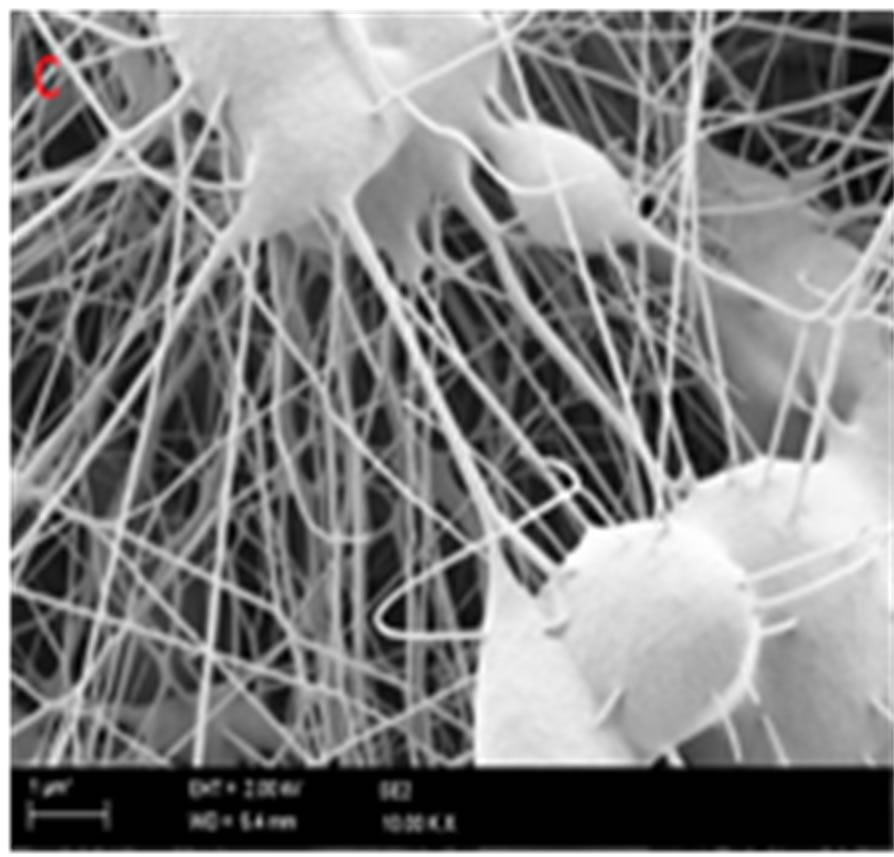 (d)
(d) 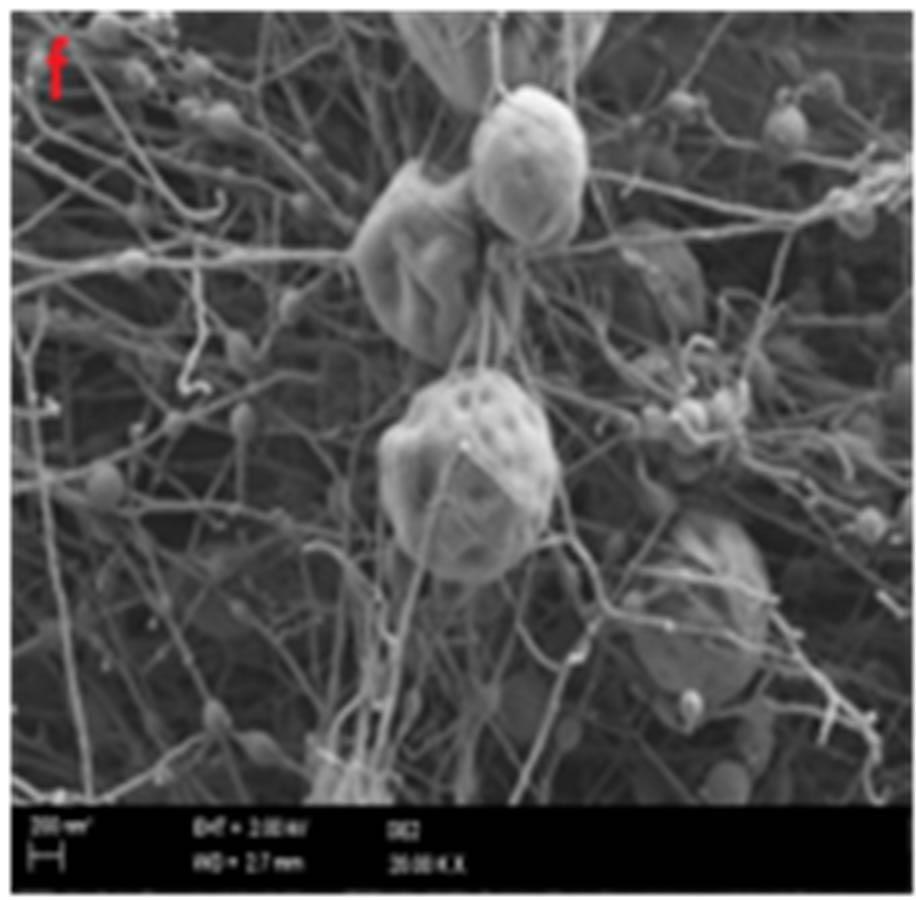 (e)
(e) 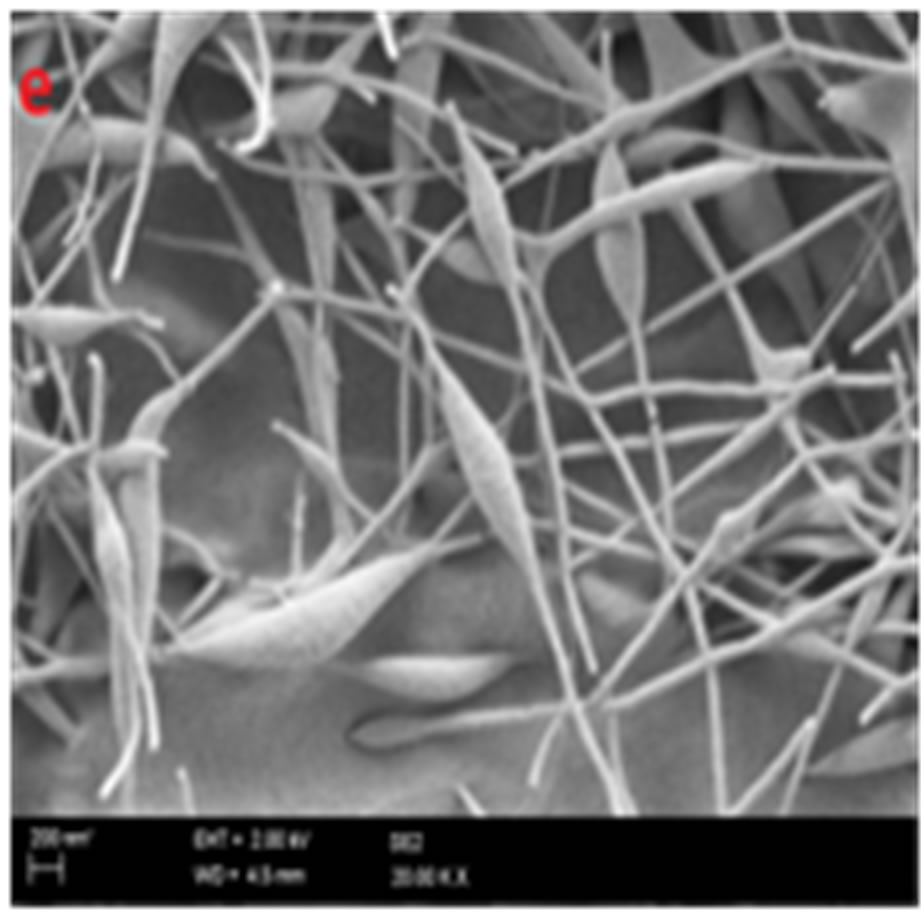 (f)
(f) 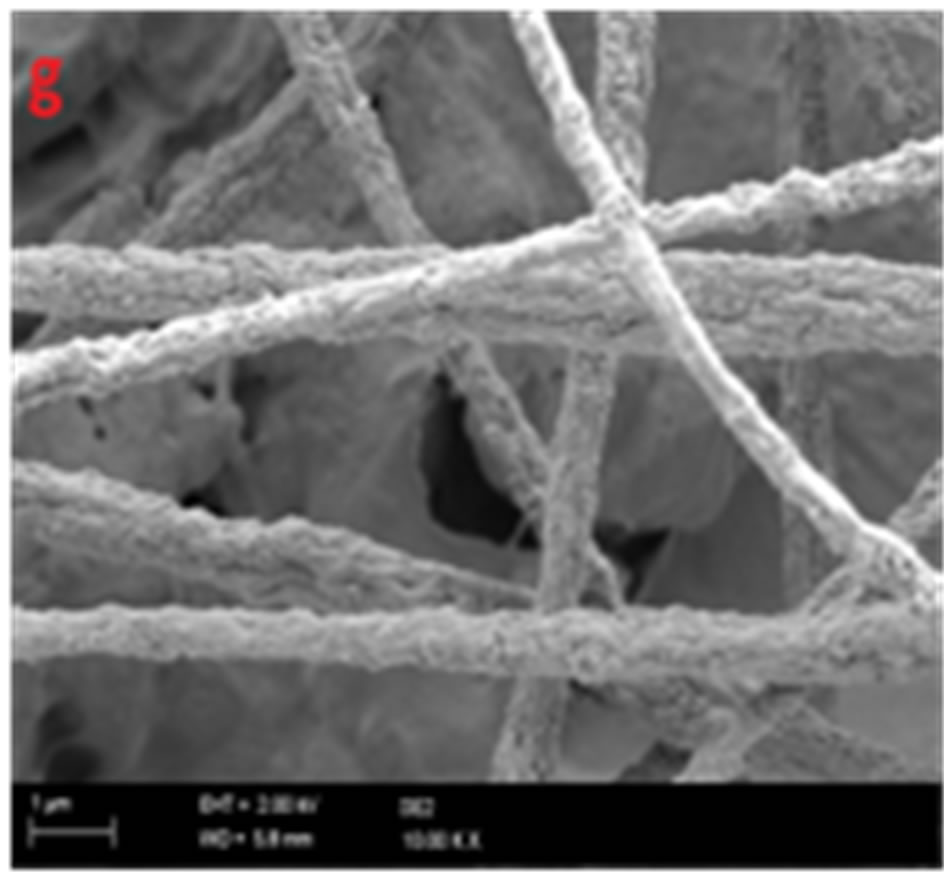 (g)
(g)
Figure 6.FESEM images captured from membrane samples 1-7,respectively.
membrane 3 compared to membrane 4 had a higher interconnectivity index, respectively, due to lower fibre size. On the contrary, in the case of overall porosity this trend was established inversely for the mentioned samples (Figure 7(b)). On this basis, fibre size was a dominating factor in determining SPE (see Figures 7(a) and (e)), and may have outweighed the effect of lower overall porosity in the first four samples. This may be due to the influence of fibre size within entire membrane structures, whereas reduced porosity only influences the membrane structures
 (a)
(a)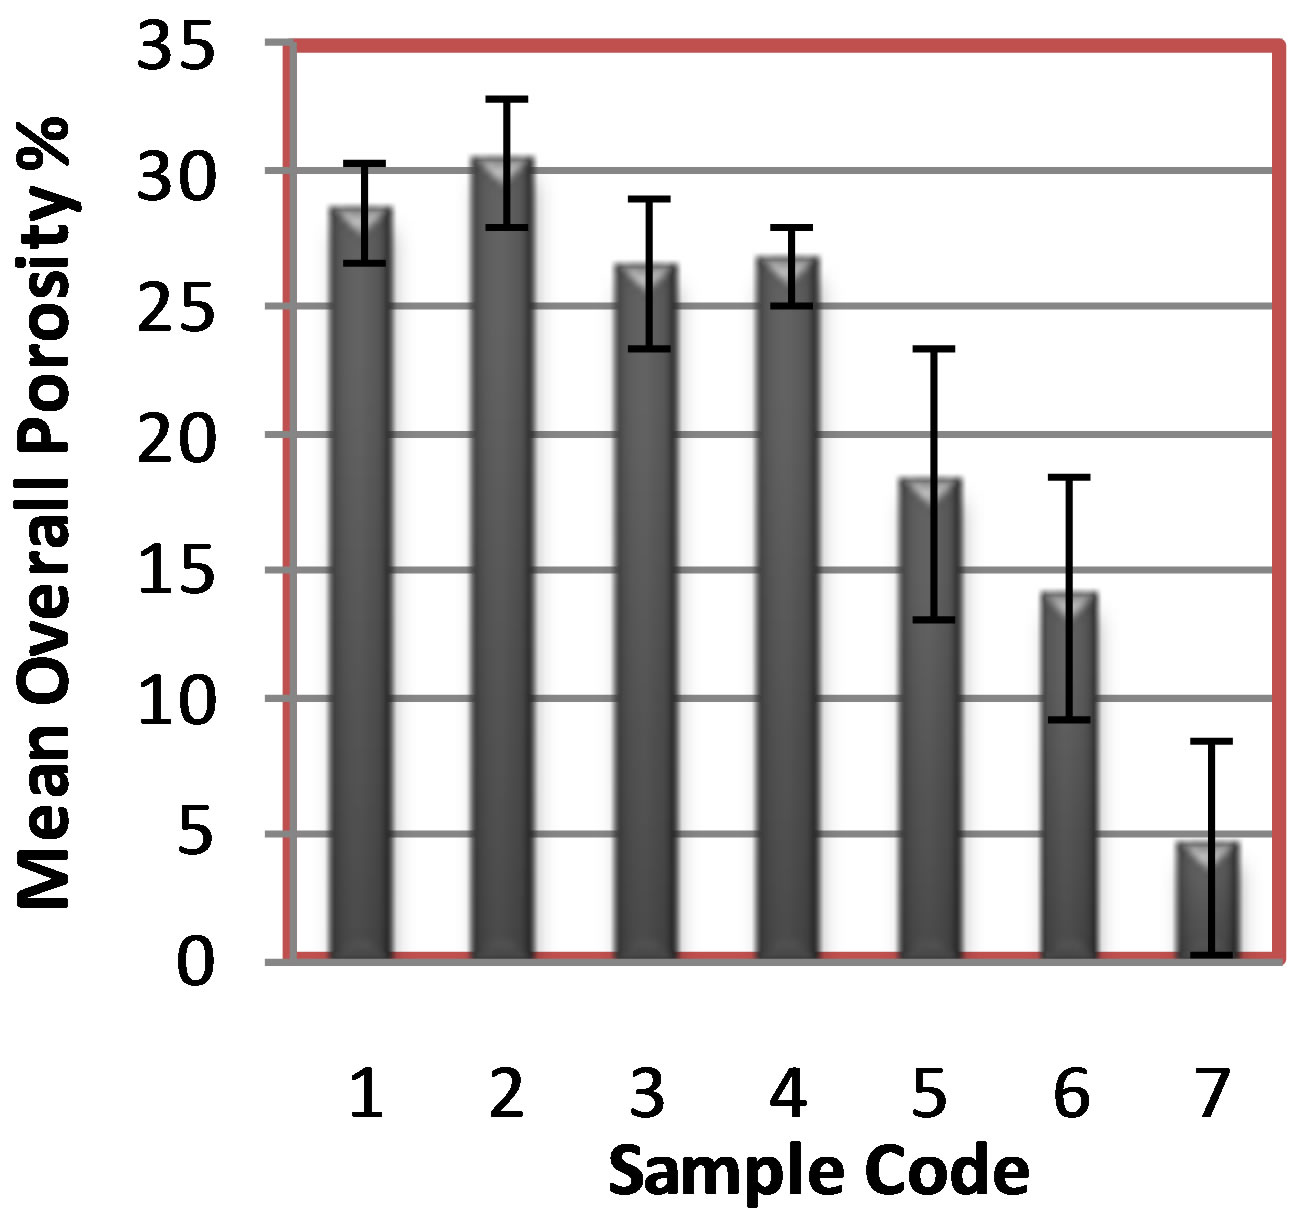 (b)
(b)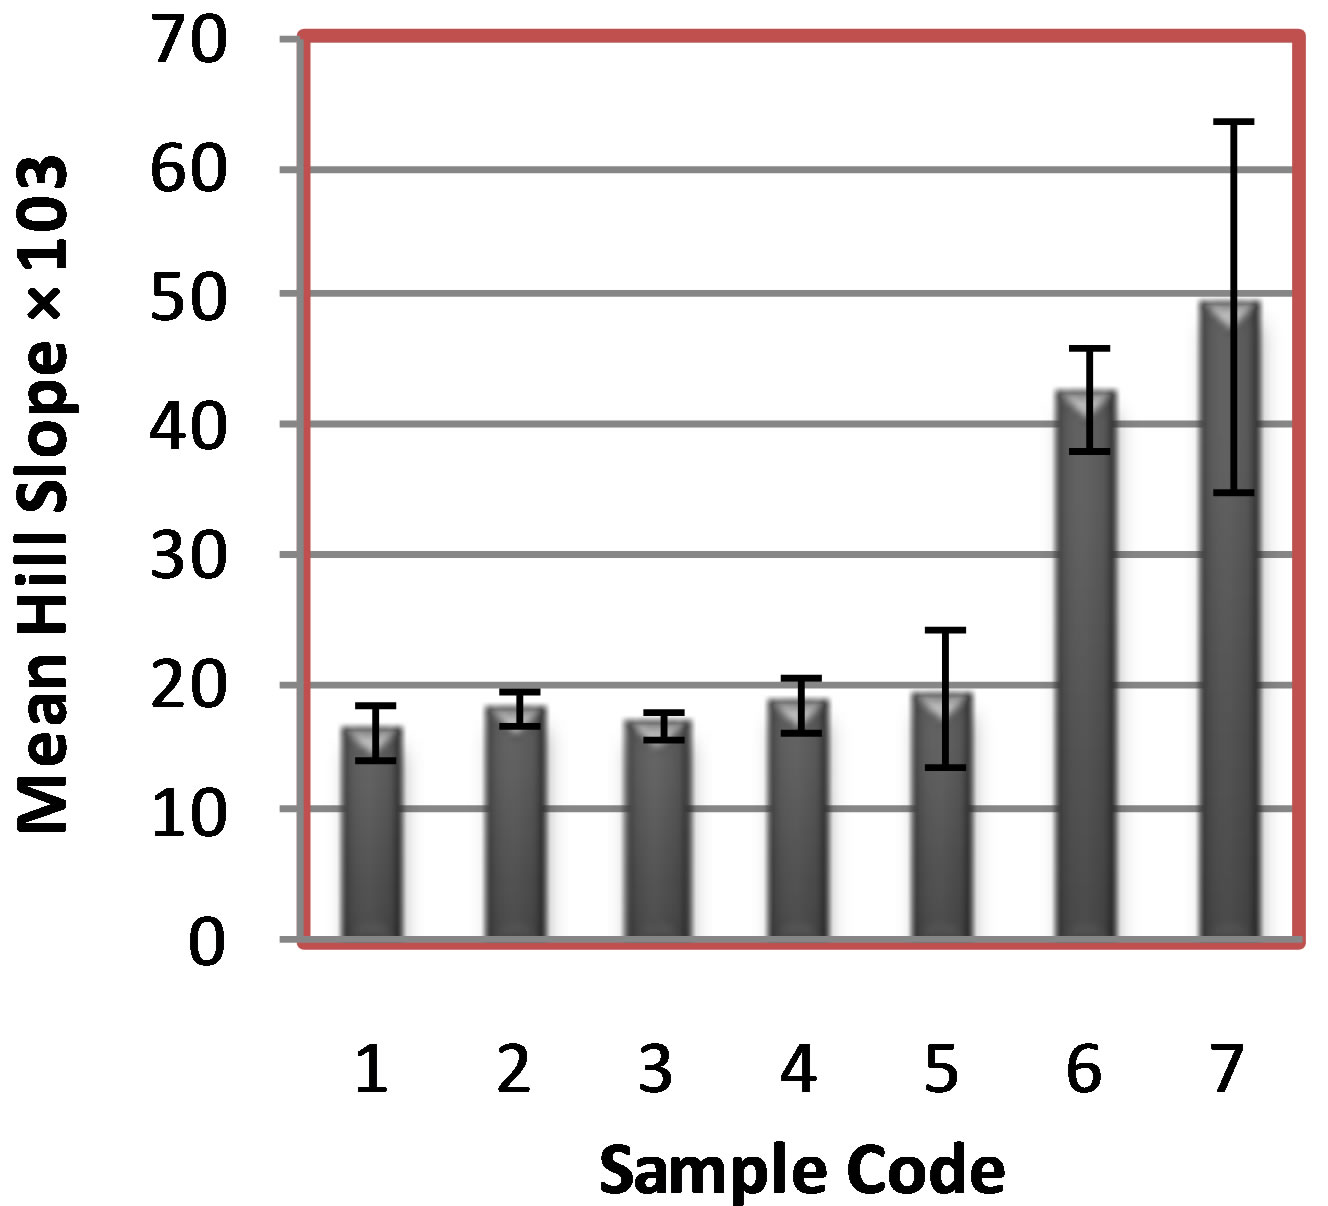 (c)
(c)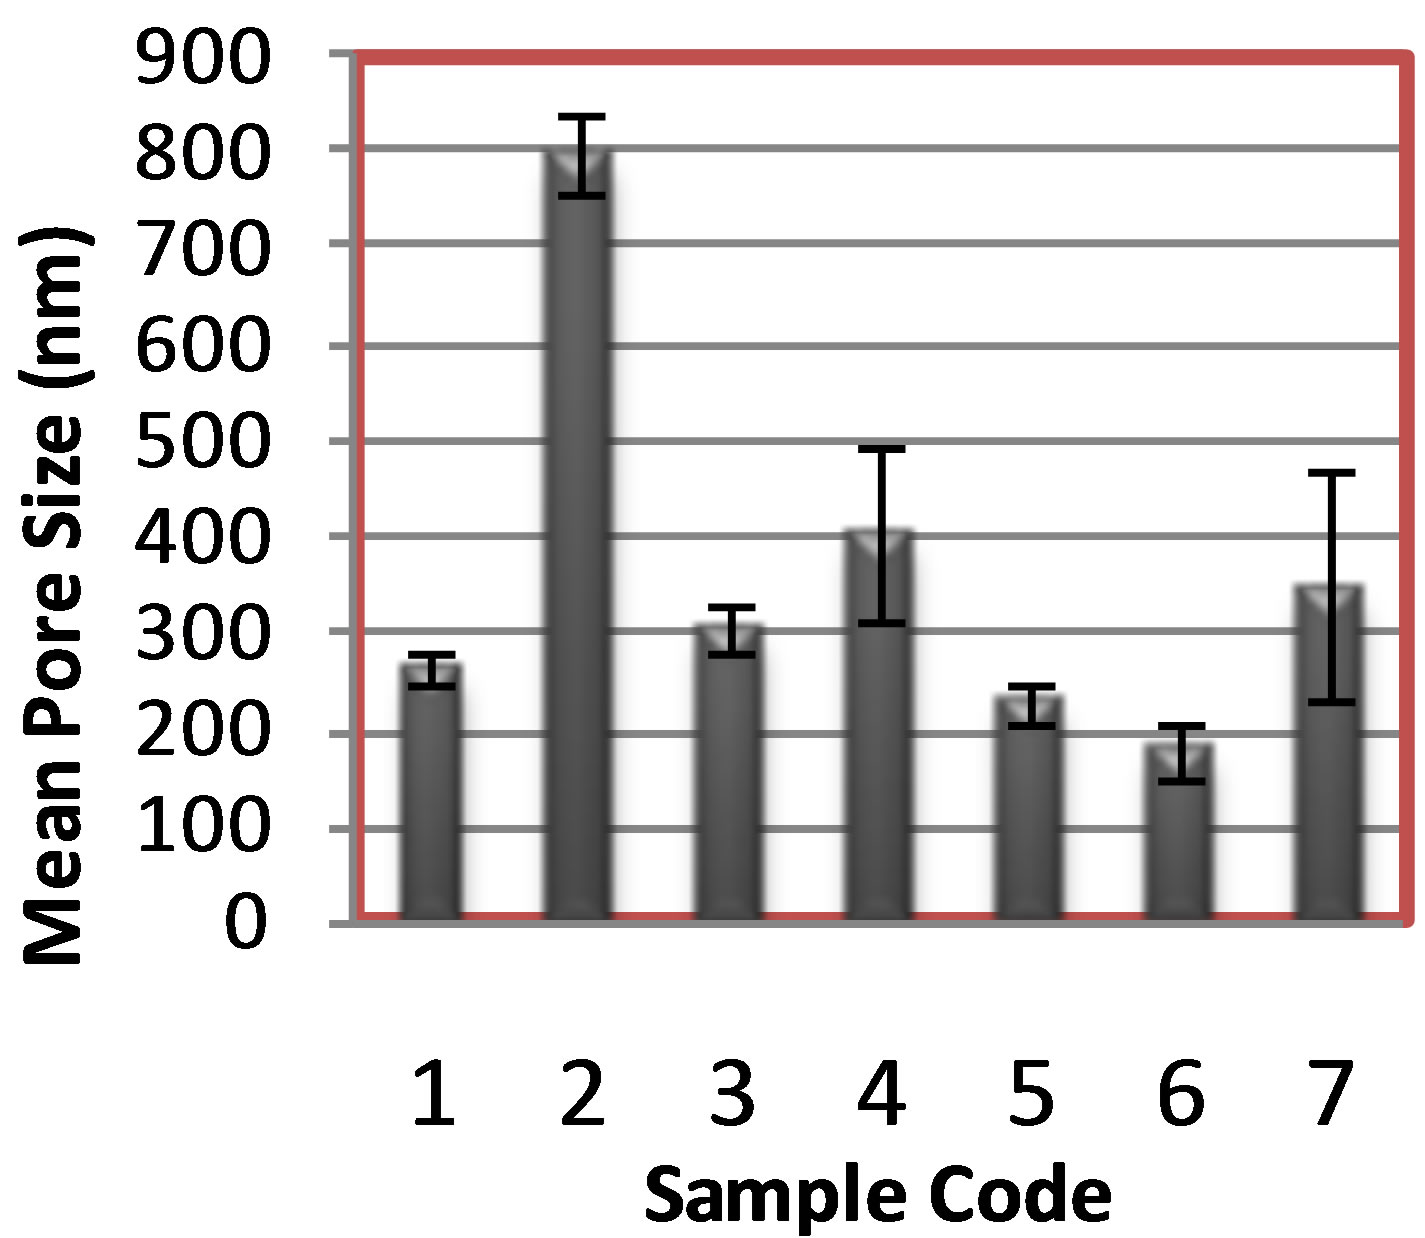 (d)
(d)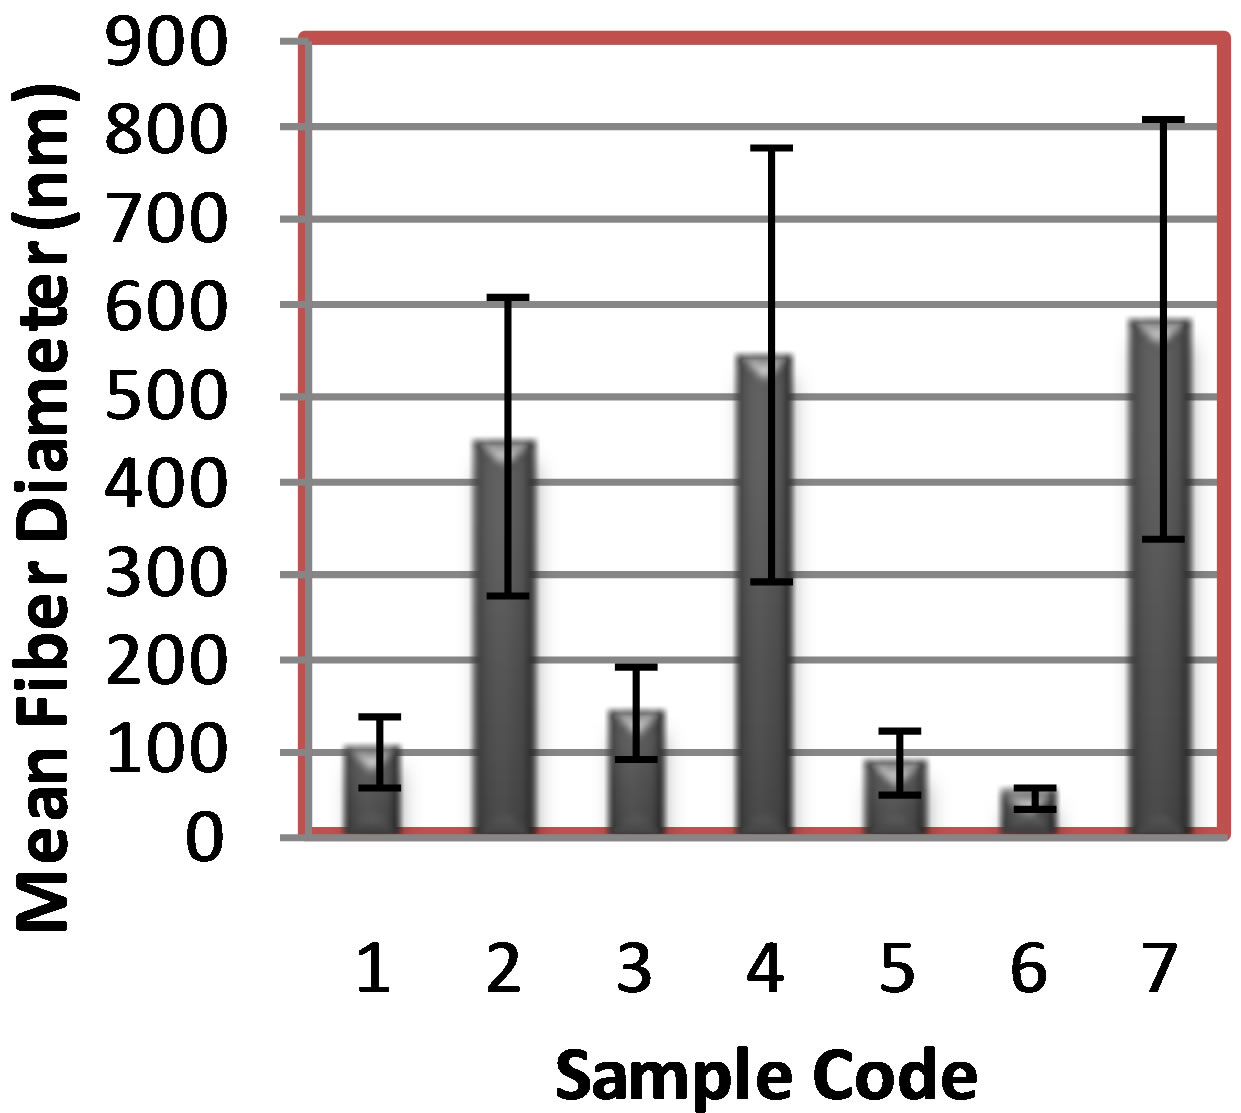 (e)
(e)
Figure 7. (a) Mean SPE; (b) Mean overall porosity; (c) Mean reciprocal interconnectivity (hill slope × 103); (d) Mean pore size and (e) Mean fibre size of the sample membranes.
partially due to beads and solution dripping (see Figures 6 (a)-(d)). As a consequence, the highest SPE belonged to sample 1 and this value decreased slightly from sample 2 to 4, respectively.
Although the differences between the measured values for mean SPE, interconnectivity and overall porosity seem to be insignificant in the first four samples, it should be noted that these values were obtained precisely through segmentation and simulation of arbitrary images at the nano scale. Furthermore, overall porosity was measured as the remaining open area after whole fibrous networks were projected in the 2D plane, and interconnectivity was evaluated based on limited numbers of cumulative layers. Thus, based on the proposed method, it seems that any slight difference in the value of structural elements results in considerable differences in depth filtration performance. In the case of the latter three samples (see Figures 6(e)-(g)), it can be observed that, in comparison to samples 6 and 7, sample 5 has higher pore interconnection and a greater accessible open area for depth filtration. This trend was also reflected in their respective measurements. In addition, due to having the lowest fibre deposition, sample 7 (see Figure 6(g)) did not meet the structural requirement for depth filtration and, correspondingly, its SPE was considerably lower than the other membranes. Based on the discussion above, it was concluded that the results obtained on intrinsic structural properties are well compatible with empirical observations of perfect membrane structures.
The F(x) and OPS estimate the quality of depth filtration in terms of how the accessible channels of specific pore size are narrowed and block transport media in the depth profile of the membrane. As previously described, the depth filtration elements are determined locally based on individual images captured from specific parts of the membrane. However, if the deposition of fibres is almost uniform, this evaluation can be extended to the entire membrane. The standard deviation of the interconnectiv-
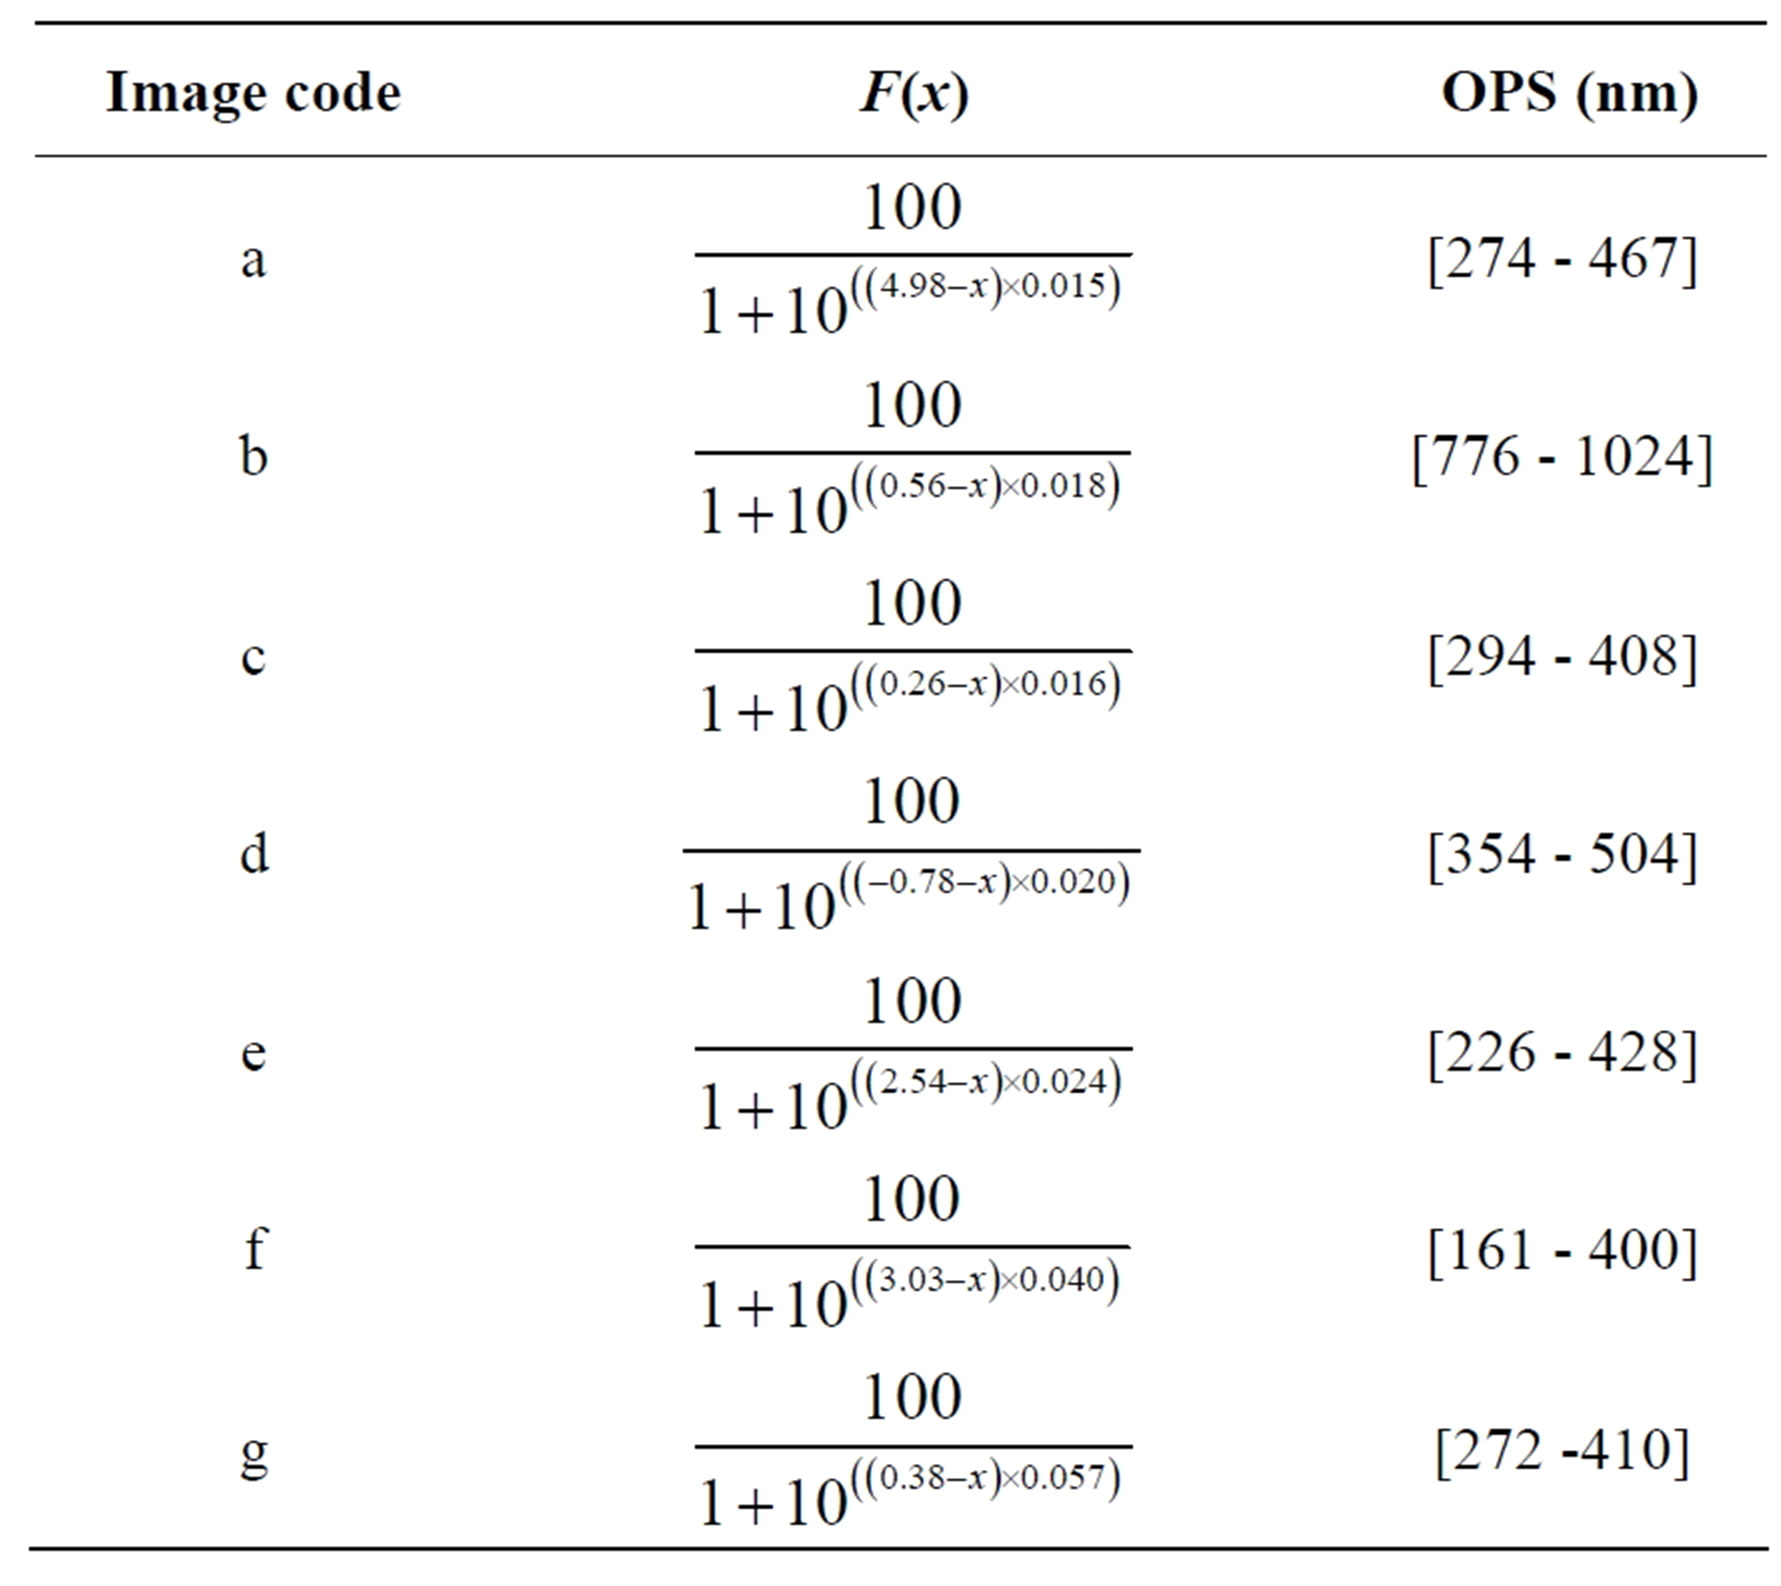
Table 1. Best fitted curves F(x) for the layered porosities and their corresponding optimal pore size (OPS).
ity index and overall porosity can serve as rough indicators of the quality of fibre deposition, in that a higher standard deviation indicates higher non-uniformity of fibre deposition throughout the entire membrane. In contrast, a small standard deviation indicates that the deposition of the fibrous network was almost uniform within the membrane. As Table 1 summarizes, the filtration elements such as F(x) and OPS were measured locally based on the single sample images illustrated in Figures 6(a)-(g). Since the standard deviation of the interconnectivity index and overall porosity in the first four samples was small (see Figures 7(b) and (c)), the corresponding F(x) and OPS can contribute to the evaluation of the entire membrane.
5. Conclusion
In the present work, a nanostructured fibrous membrane was simulated as an ideal membrane using adaptive local criteria in image analysis. The mean overall porosity as a projection of open area in the 2-D plane, the mean reciprocal interconnectivity index, and the mean scaffold percolative efficiency (SPE) were measured as the intrinsic structural properties. Furthermore, depth filtration elements, such layered porosities F(x) and optimal pore size (OPS) were locally analysed. The proposed method can be applied to different morphological conditions even at high degrees of structural imperfection (low fibre deposition, beading and solution dripping). The reliability of the proposed approach was validated with measurements and comparison of the structural characteristics of several samples with different morphological architectures. The results and subsequent comparison were well compatible with empirical observations of perfect membrane structures. This approach may open up avenues for optimization of electrospinning parameters in order to produce optimal membranes that meet the requirements of depth filtration. In addition, this may facilitate exploring the complex dynamics of transport media through accurate analysis of structural properties in the depth profile of nanofibrous membranes.
REFERENCES
- P. Heikkilä, “Nanostructured Fiber Composites, and Materials for Air Filtration,” Ph.D. Dissertation, Tampere University of Technology, Tampere, 2008.
- P. Gibson, H. S. Gibson and D. Rivin, “Transport Properties of Porous Membranes Based on Electrospun Nanofibers,” Colloids and Surfaces, Vol. 187-188, 2001, pp. 469-481. doi:10.1016/S0927-7757(01)00616-1
- R. Gopal, S. Kaur, Z. Ma, C. Chan, S. Ramakrishna and T. Matsuur, “Electrospun Nanofibrous Filtration Membrane,” Journal of Membrane Science, Vol. 281, No. 1-2, 2006, pp. 581-586. doi:10.1016/j.memsci.2006.04.026
- C. S. Ki, E. H. Gang, I. C. Um and Y. H. Park, “Nanofibrous Membrane of Wool Keratose/Silk Fibroin Blend for Heavy Metal Ion Adsorption,” Journal of Membrane Science, Vol. 302, No. 1, 2007, pp. 20-26. doi:10.1016/j.memsci.2007.06.003
- S. Zhang, W. S. Shim and J. Kim, “Design of Ultra-Fine Nonwovens via Electrospinning of Nylon 6: Spinning Parameters and Filtration Efficiency,” Materials and Design, Vol. 30, No. 9, 2009, pp. 3659-3666. doi:10.1016/j.matdes.2009.02.017
- R. S. Barhate and S. Ramakrishna, “Nanofibrous Filtering Media: Filtration Problems and Solutions from Tiny Materials,” Journal of Membrane Science, Vol. 296, No. 1-2, 2007, pp. 1-8. doi: 10.1016/j.memsci.2007.03.038
- C. Feng, K. C. Khulbe and T. Matsuura, “Recent Progress in the Preparation, Characterization, and Applications of Nanofibers and Nanofiber Membranes via Electrospinning/Interfacial Polymerization,” Journal of Applied Polymer Science, Vol. 115, No. 2, 2010, pp. 756-776. doi:10.1002/app.31059
- J. Hrůza and J. Poláchová, “Respirator Filters with Nanofibers,” Proceedings of AUTEX Conference University of Maribor, Portoroz Slovenia, 2005, pp. 149-154.
- K. Graham, M. Ouyang, T. Raether, T. Grafe, B. McDonald and P. Knauf, “Polymeric Nanofibers in Air Filtration Applications,” Proceedings of the Fifteenth Annual Technical Conference & Expo of the American Filtration & Separations Society, Texas, 9-12 April 2002.
- T. Grafe, M. Gogins, M. Barris, J. Schaefer and R. Canepa, “Nanofibers in Filtration Applications in Transportation,” Proceedings of the Filtration 2001 International Conference and Exposition of the INDA (Association of the Nonwovens Fabric Industry), Chicago, 3-5 December 2001.
- S. W. Choi, S. M. Jo, W. S. Lee and Y. R. Kim, “An Electrospun Poly(vinylidene fluoride) Nanofibrous Membrane and Its Battery Applications,” Advanced Materials, Vol. 15, No. 23, 2003, pp. 2027-2032. doi:10.1002/adma.200304617
- A. L. Gopalan, P. Santhosh, K. M. Manesh, J. H. Nho, S. H. Kim, C. G. Hwang and K. P. Lee, “Development of Electrospun PVdF-PAN Membrane-Based Polymer Electrolytes for Lithium Batteries,” Journal of Membrane Science, Vol. 325, No. 2, 2008, pp. 683-690. doi:10.1016/j.memsci.2008.08.047
- H. Yoshimoto, Y. M. Shin, H. Terai and J. P. Vacanti, “A Biodegradable Nanofiber Scaffold by Electrospinning and Its Potential for Bone Tissue Engineering,” Biomaterials, Vol. 24, No. 12, 2003, pp. 2077-2083. doi:10.1016/S0142-9612(02)00635-X
- S. R. Bhattarai, N. Bhattarai, H. K. Yi, P. H. Hwang, D. I. Cha, H. Y. Kim, “Novel Biodegradable Electrospun Membrane: Scaffold for Tissue Engineering,” Biomaterials, Vol. 25, 2004, pp. 2595-2602. doi:10.1016/j.biomaterials.2003.09.043
- T. Tamura and H. Kawakami, “Aligned Electrospun Nanofiber Composite Membranes for Fuel Cell Electrolytes,” Nano Letter, Vol. 10, No. 4, 2010, pp. 1324-1328. doi:10.1021/nl1007079
- B. Dong, L. Gwee, D. S. L. Cruz, K. I. Winey and Y. A. Elabd, “Super Proton Conductive High-Purity Nafion Nanofibers,” Nano Letter, Vol. 10, No. 9, 2010, pp. 3785- 3790. doi:10.1021/nl102581w
- A. H. Tehrani, A. Zadhoush, S. Karbasi and H. S. Aliabadi, “Scaffold Percolative Efficiency: In Vitro Evaluation of the Structural Criterion for Electrospun Mats,” Journal of Materials Science: Materials in Medicine, Vol. 21, No.11, 2010, pp. 2989-2998. doi:10.1007/s10856-010-4149-7
- S. A. Hosseini and H. V. Tafreshi, “Modeling Permeability of 3-D Nanofiber Media in Slip Flow Regime,” Chemical Engineering and Science, Vol. 65, No. 6, 2010, pp. 2249-2254. doi:10.1016/j.ces.2009.12.002
- S. A Hosseini and H. V. Tafreshi, “3-D Simulation of Particle Filtration in Electrospun Nanofibrous Filters,” Powder Technology, Vol. 201, No. 2, 2010, pp. 153-160. doi:10.1016/j.powtec.2010.03.020
- W. Sambaera, M. Zatloukal and D. Kimmer, “3D Modeling of Filtration Process via Polyurethane Nanofiber Based Nonwoven Filters Prepared by Electrospinning Process,” Chemical Engineering Science, Vol. 66, No. 4, 2011, pp. 613-623. doi:10.1016/j.ces.2010.10.035
- S. Jaganathan, H. V. Tafreshi and B. Pourdeyhimi, “A Realistic Approach for Modeling Permeability of Fibrous Media: 3-D Imaging Coupled with CFD Simulation,” Chemical Engineering and Science, Vol. 63, No. 1, 2008, pp. 244-252. doi:10.1016/j.ces.2007.09.020
- M. Ziabari, V. Mottaghitalab and A. K. Haghi, “Evaluation of Electrospun Nanofiber Pore Structure Parameters,” Korean Journal of Chemical Engineering, Vol. 25, No. 2, 2008, pp. 923-932. doi:10.1007/s11814-008-0151-x
- L. G. Mobarakeh, D. Semnani and M. Morshed, “A Novel Method for Porosity Measurement of Various Surface Layers of Nanofibers Mat Using Image Analysis for Tissue Engineering Applications,” Journal of Applied Polymer Science, Vol. 106, No. 4, 2007, pp. 2536-2542. doi:10.1002/app.26949
- M. Ziabari, V. Mottaghitalab and A. K. Haghi, “A New Image Analysis Based Method for Measuring Electrospun Nanofiber Diameter,” Nanoscale Research Letters, Vol. 2, No. 12, 2007, pp. 597-600. doi:10.1007/s11671-007-9093-1
- M. K. Pilehrood, P. Heikkilä and A. Harlin, “Preparation of Carbon Nanotube Embedded in Polyacrylonitrile (PAN) Nanofibre Composites by Electrospinning Process,” AUTEX Research Journal, Vol. 12, No. 1, 2012, pp. 1-6.
- M. Sezgin and B. Sankur, “Survey over Image Thresholding Techniques and Quantitative Performance Evaluation,” Journal of Electronic Imaging, Vol. 13, No. 1, 2004, pp. 146-168. doi:10.1117/1.1631315
- Z. Chi and K. W. Wong, “A Two-Stage Binarization Approach for Document Images,” Proceedings of 2001 International Symposium on Intelligent Multimedia, Video and Speech Processing, Hong Kong, 2-5 May 2001, pp. 275-278.
- J. R. Parker, “Gray Level Thresholding in Badly Illuminated Images,” IEEE Transaction on Pattern Analysis and Machine Intelligent, Vol. 13, No. 8, 1991, pp. 813- 819. doi:10.1109/34.85672
- J. A. Burghardt, G. J. Kazakia and S. Majumdar, “A Local Adaptive Threshold Strategy for High Resolution Peripheral Quantitative Computed Tomography of Trabecular Bone,” Annals of Biomedical Engineering, Vol. 35, No. 10, 2007, pp. 1678-1686. doi:10.1007/s10439-007-9344-4
- W. Bieniecki and S. Grabowski, “Multi-Pass Approach to Adaptive Thresholding Based Image Segmentation,” Proceedings of the 8th International IEEE Conference CADSM 2005, Lviv-Polyana, 2005, pp. 418-423.
- 2012. http://fiji.sc/Auto_Local_Threshold
- C. Yan and G. Leedham, “Decompose-Threshold Approach to Handwriting Extraction in Degraded Historical Document Images,” Proceedings of the 9th Int’l Workshop on Frontiers in Handwriting Recognition, 26-29 October 2004, pp. 239-244.
- I. Blayvas, A. Bruckstein and R. Kimmel, “Efficient Computation of Adaptive Threshold Surfaces for Image Binarization,” Pattern Recognition, Vol. 39, No. 1, 2006, pp. 89-101. doi:10.1016/j.patcog.2005.08.011
- J. Sauvola and M. Pietaksinen, “Adaptive Document Image Binarization,” Pattern Recognition, Vol. 33, No. 2, 2000, pp. 225-236. doi:10.1016/S0031-3203(99)00055-2
- L. Safinia, A. Mantalaris and A. Bismarck, “Nondestructive Technique for the Characterization of the Pore Size Distribution of Soft Porous Constructs for Tissue Engineering,” Langmuir, Vol. 22, No. 7, 2006, pp. 3235-3242. doi:10.1021/la051762g
- 2012. http://www.nist.gov/lispix/doc/particle-form/morph-param.htm
- 2012. http://www.sympatec.org/Science/Characterisation/05_ParticleShape.html
- A. Polesel, G. Ramponi and V. J. Mathew, “Image Enhancement via Adaptive Unsharp Masking,” IEEE Transactions on Image Processing, Vol. 9, No. 3, 2000, pp. 505-510. doi:10.1109/83.826787
- G. Ramponi, N. K. Strobel, S. K. Mitra and T. H. Yu, “Nonlinear Unsharp Masking Methods for Image Contrast Enhancement,” Journal of Electronic Imaging, Vol. 5, No. 3, 1991, pp. 353-366. doi:10.1117/12.242618
- A. Polesel, G. Ramponi and V. J. Mathew, “Adaptive Unsharp Masking for Contrast Enhancement,” Proceedings of International Conference of Image Processing, Santa Barbara, 26-29 October 1997, pp. 267-270.
- P. M. Narendra, “A Separable Median Filter for Image Noise Smoothing,” IEEE Transactions on Pattern Analysis and Machine Intelligence, Vol. 3, No. 1, 1981, pp. 20- 29. doi:10.1109/TPAMI.1981.4767047
- P. Jagatheeswari, S. Suresh Kumar and M. Rajaram, “Contrast Enhancement for Medical Images Based on Histogram Equalization Followed by Median Filter,” Proceedings of the International Conference on Man-Machine Systems (ICoMMS), Penang, 11-13 October 2009, pp. 2A4-1-2A4-4.
- 2012. http://www.graphpad.com
- P. Heikkilä, A. Taipale, M. Lehtimäki and A. Harlin, “Electrospinning of Polyamides with Different Chain Compositions for Filtration Application,” Polymer Engineering & Science, Vol. 48, No. 6, 2008, pp. 1168-1176. doi:10.1002/pen.21070
- A. Bruil, T. Beugeling and J. Feijen, “A Mathematical Model for the Leukocyte Filtration Process,” Biotechnology and Bioengineering, Vol. 45, No. 2, 1995, pp. 158- 164.
- V. Kalayci, M. Ouyang and K. Graham, “Polymeric Nanofibres in High Efficiency Filtration Applications,” Filtration, Vol. 6, No. 4, 2006, pp. 286-293.
- H. C. Wang, and G. Kasper, “Filtration Efficiency of Nanometer-Size Aerosol Particles,” Journal of Aerosol Science, Vol. 22, No. 1, 1991, pp. 31-41. doi:10.1016/0021-8502(91)90091-U
- M. D. Abramoff, P. J. Magalhaes and S. J. Ram, “Image Processing with ImageJ,” Biophotonics International, Vol. 11, No. 7, 2004, pp. 36-42.
- H. Motulsky and A. Christopoulos, “Fitting Models to Biological Data using Linear and Nonlinear Regression. A Practical Guide to Curve Fitting,” Oxford University Press, New York, 2004.