Journal of Diabetes Mellitus
Vol.2 No.3(2012), Article ID:22174,7 pages DOI:10.4236/jdm.2012.23044
Atherogenic lipids profile relates to postprandial hyperglycemia and hyperinsulinemia due to whole body insulin resistance in prediabetic subjects*
![]()
1Diabetes Division, Department of Internal Medicine, Muroran City General Hospital, Muroran, Japan; #Corresponding Author: murohosp113@kujiran.jp
2Second Department of Internal Medicine, Sapporo Medical University School of Medicine, Sapporo, Japan
Received 9 May 2012; revised 7 June 2012; accepted 17 June 2012
Keywords: Atherosclerotic Lipids Profile; Impaired Fasting Glucose; Impaired Glucose Tolerance; Whole Body Insulin Resistance
ABSTRACT
Backgrounds: Differences in serum lipids profiles in different type of glucose intolerance are unclear. Aims: To characterize lipid profiles in different type of glucose intolerance, and to assess relationships between serum lipids profile and disturbance of glucose metabolism in prediabetic subjects. Methods: Using the measurements in medical check-up with 75 goral glucose tolerance test (OGTT), total of 620 male subjects, who are not on medications for metabolic diseases or hypertension, were divided into normal fasting glucose and glucose tolerance (NFG/ NGT), isolated impaired fasting glucose (iIFG), isolated impaired glucose tolerance (iIGT) and combined IFG and IGT (IFG/IGT) based on results of the OGTT. Results: Age and body mass index (BMI) were similar in the four groups. Matsuda index (an index of whole body insulin sensitivity) was lower in iIFG, iIGT and IFG/IGT as compared with NFG/NGT. Plasma insulin excursion during the OGTT was significantly higher in IFG/IGT versus NFG/NGT. Serum triglyceride level (TG) and TG to HDL ratio (TG/HDL) were higher in IFG/IGT versus NFG/NGT. Matsuda index was positively correlated with HDL and was inversely correlated with TG, LDL, non-HDL, TG/ HDL and LDL to HDL ratio (LDL/HDL). Backward stepwise multiple regression analysis indicated that increases in BMI, plasma insulin level at 60 min (PI60) and plasma glucose level at 120 min in the OGTT were independently associated with increases in TG and TG/HDL. Increases in BMI and PI60 were related to an increase in nonHDL and LDL/HDL and a decrease in HDL. Conclusions: These results indicate that postprandial hyperglycemia and hyperinsulinemia based on advanced insulin resistance are closely related to lipid risk factors of atherosclerotic macrovascular disease in prediabetic subjects.
1. INTRODUCTION
Cardiovascular disease (CVD) is the leading cause of death in patients with type 2 diabetes mellitus (T2DM) [1]. Dyslipidemia, frequently occurring in T2DM patients, play a critical role in acceleration of macrovascular atherosclerosis and contribute to the excess risk of CVD [2]. The dyslipidemia in T2DM is, in general, characterized by elevated triglycerides (TG), reduced high density lipoprotein (HDL) cholesterol, and predominant presence of small dense low density lipoprotein (sdLDL) particles [3]. Apparently similar abnormalities in serum lipid profiles have been observed in the prediabetic individuals, and the abnormalities are mainly attributed to the obesity, hyperinsulinemia and glucose intolerance [4, 5]. However, “prediabetes” does not indicate a homogenous group of subjects.
A prediabetic state, impaired glucose tolerance (IGT), is an intermediate state in transition from normal glucose tolerance to T2DM. IGT subjects frequently progress to T2DM with 6-fold increase in annualized relative risk when compared with normal glucose tolerance [6]. In 1997, the American Diabetes Association (ADA) additionally introduced impaired fasting glucose (IFG) as another intermediate state in transition from normal glucose tolerance to T2DM [7], and its diagnostic criteria was revised in 2003 [8]. IFG was meant to be analogous to IGT, and their annualized relative risks for progression to T2DM are 4.7-fold compared with normal glucose tolerance. Furthermore, this relative risk is increased by 12-fold when both IFG and IGT are overlapped in prediabetic subjects [6].
Meanwhile, it has been shown that IGT is strongly associated with increase in CVD events and mortality, whereas the association is somewhat less for IFG [9,10]. A possible explanation for the difference between IGT and IFG in level of association with CVD is differences in serum lipids profile in addition to the differences in plasma peak levels of glucose and/or insulin. However, this issue has not been closely examined. Besides, recent studies reported new indices for characterizing lipid profiles relevant to CVD. Several studies have demonstrated that non-HDL cholesterol is a better predictor of CVD than the Low density lipoprotein (LDL) cholesterol concentration [11,12]. The ADA, American College of Cardiology (ACC), and ATP III recommended targeting LDL first, with non-HDL as a secondary target [13,14]. In addition, TG to HDL ratio (TG/HDL) has been shown to indicate the presence of sdLDL particles and could serve as a good predictor of coronary heart disease (CHD) [15, 16]. LDL to HDL ratio (LDL/HDL) was also found to predict CHD as do total cholesterol (TC) to HDL ratio (TC/HDL) and ApoB/ApoA-1 ratio [17,18]. However, effects of different types of glucose intolerance on nonHDL, TG/HDL and LDL/HDL are unclear.
The aim of this study was two-fold. One was characterization of lipid profiles including non-HDL, TG/HDL and LDL/HDL in each category of glucose intolerance (i.e., isolated IFG, isolated IGT and combined IFG and IGT). Another aim was to determine relationships between serum lipid profiles with plasma glucose/insulin and insulin resistance.
2. METHODS
2.1. Study Subjects
We have been carrying out a medical examination and epidemiological investigation of cardiovascular disease in the towns of Tanno and Sobetsu, Hokkaido, Japan [19]. The protocol of the present study was approved by the Ethics Committee of Sapporo Medical University, and all of the study subjects gave informed consent for inclusion in the present investigation. From 2027 citizens, who had received measurements of anthropometry and undergone medical examination, including 75 g oral glucose tolerance test (OGTT), we selected male subjects by exclusion of subjects on medications known to affect glucose tolerance, serum lipid levels or blood pressure and subjects with a history of diabetes. We further selected 620 subjects, whose plasma glucose (PG) at time 0 min (PG0) and 120 min (PG120) during the OGTT was less than 126 mg/dl and 200 mg/dl respectively, and serum TG level was less than 400 mg/dl (for the calculation of LDL level using the Fried wald equation). According to 2003 ADA criteria, study subjects were classified into NFG/NGT (PG0 < 100 mgl/dl and PG120 < 140 mg/dl, n = 499), isolated IFG (iIFG: PG0 = 100 - 125 mg/dl and PG120 < 140 mg/dl, n = 63), isolated IGT (iIGT: PG0 < 100 mg/dl and PG120 = 140 - 199 mg/dl, n = 29) or, combined IFG and IGT (IFG/IGT: PG0 = 100 - 125 mg/dl and PG120 = 140 - 199 mg/dl, n = 29). In the present study, we did not include female subjects in order to exclude the effect of agedependent differences in sex hormone levels, especially preand post-menopausal differences, on the glucose and lipids metabolism.
2.2. Determination of Metabolic Parameters
Each study subject received medical history taking, physical examination, EKG, standard blood tests (complete blood count and serum biochemistry) and the OGTT. All subjects had been advised to fast at least 10 hours before the OGTT.
In the OGTT, after baseline blood sampling, 75 grams of glucose was orally administered and blood was sampled at 60 and 120 minutes after the glucose loading for measurement of PG and plasma insulin (PI). Serum TC, TG and HDL concentrations were measured enzymatically. LDL was calculated from TC, TG and HDL using the Fried wald equation. PG was measured by the glucose oxidase method, and PI was measured using RIA beads (Dainippon Sumitomo Pharma, Osaka, Japan). An index of insulin sensitivity, Matsuda Index {=10000/[(PG0 × PI0) × (mean PG × mean PI)]1/2} [20] were calculated by data from the OGTT.
2.3. Statistical Analysis
Statistical analysis was performed with Stat View for Windows, v 5.0 (SAS Institute Inc., Cary, NC). Comparison of data between groups was performed using analysis of variance with Scheffe’s post hoc testing when appropriate. Comparisons over time during the OGTT between groups were made by using repeated-measures analysis of variance. Stepwise multiple regression analysis was performed to examine the multiple correlations among variables. All data are presented as mean value ± standard deviation (SD) except that some data in figures are shown as mean value ± standard error (SE). p value less than 0.05 was considered statistically significant.
3. RESULTS
3.1. Demographic Profiles in Study Subjects Categorized by Glucose Tolerance
As shown in Table 1, there was no significant difference in age or body mass index (BMI) between NFG/
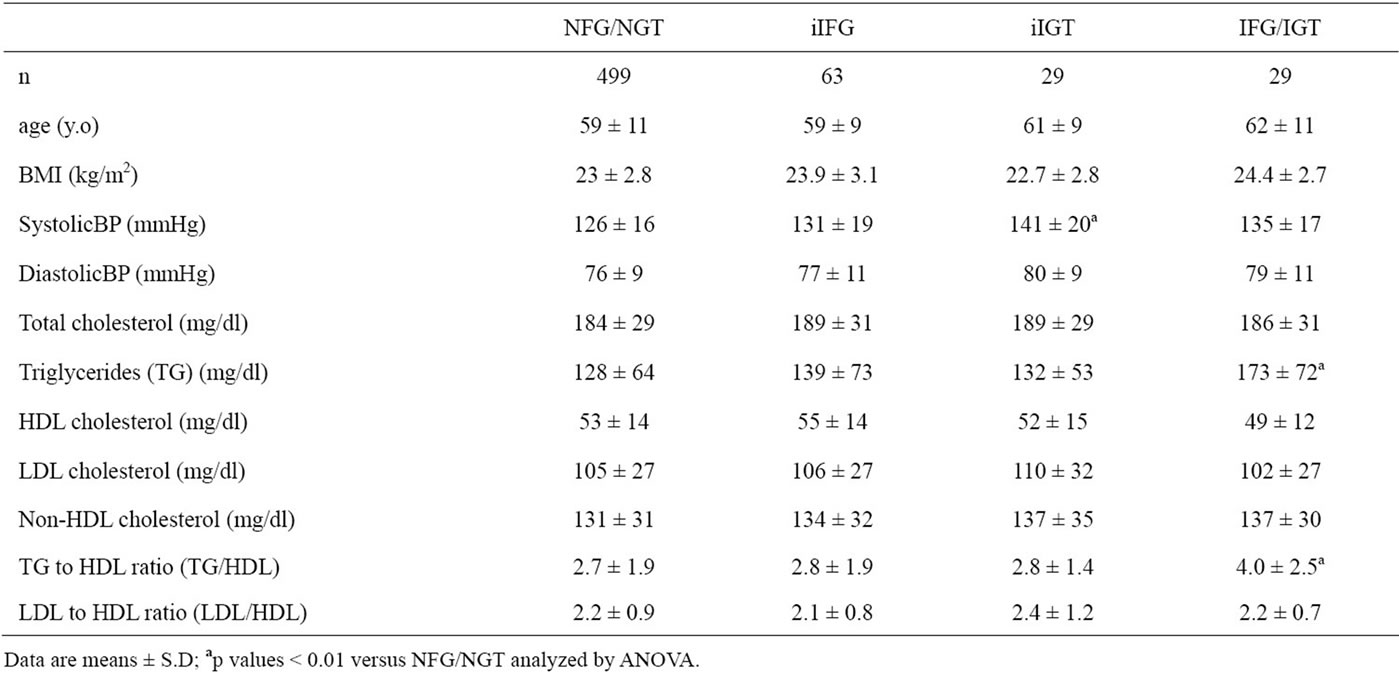
Table 1. Demographic and serum lipids characteristics of study participants.
NGT, iIFG, iIGT and IFG/IGT. By definition, subjects with iIFG and IFG/IGT had significantly higher PG0 level (105 ± 5 and 109 ± 7 mg/dl, respectively) compared to NFG/NGT (86 ± 8) and iIGT (93 ± 6), and subjects with iIGT and IFG/IGT had significantly higher PG120 level (158 ± 17 and 158 ± 13) compared to the NFG/ NGT (101 ± 13) and iIFG (120 ± 9) (Figure 1). PG0 in iIGT and PG120 in iIFG were also significantly higher than those in NFG/NGT. PG60 levels in iIGT (198 ± 35) and IFG/IGT (219 ± 32) were significantly higher than those in iIFG (158 ± 32) and NFG/NGT (129 ± 28), and the PG60 in iIFG was higher in compared with NFG/NGT. PG excursions during the OGTT were significantly greater in order of NFG/NGT, iIFG, iIGT and IFG/IGT (Figure 1). PI120 levels in iIGT (46 ± 33 mU/l) and IFG/ IGT (39 ± 24) were significantly higher than that in NFG/NGT (24 ± 20), and the PI120 level in iIGT was higher also as compared with iIFG (29 ± 31). PI excursion during the OGTT in IFG/IGT was significantly greater than in NFG/NGT (Figure 1).
3.2. Insulin Sensitivity, Lipid Profile and Categories of Glucose Intolerance
Matsuda index, a measure of whole body insulin sensitivity, was significantly reduced in all three categories of glucose intolerance (iIFG: 6.7 ± 4.3, iIGT: 6.3 ± 3.2, IFG/IGT: 5.0 ± 3.1) compared with NFG/NGT (9.9 ± 6.4) as shown in Figure 2.
TG and TG/HDL were significantly higher in IGT/IFG than in NFG/NGT (Table 1). However, there were no significant differences in HDL, LDL, non-HDL or LDL/ HDL among the four groups of subjects.
3.3. Relationships between Insulin Sensitivity and Serum Lipids
Matsuda index correlated inversely with TG, LDL, non-HDL, TG/HDL and LDL/HDL and positively with HDL (Figure 3).
In backward stepwise regression analysis using age, BMI, PG0, PG60, PG120, PI0, PI60 and PI120 during the OGTT as independent variables (Table 2), increases in BMI, PG120 and PI60 levels were independently correlated with increase in TG and TG/HDL. BMI and PI60 were also correlated negatively with HDL and positively with non-HDL and LDL/HDL. In contrast to PI60, PI0 correlated negatively with TG, non-HDL, TG/HDL and LDL/HDL, and positively with HDL. Only increased BMI was a positive predictor of increased LDL.
4. DISCUSSION
Matsuda index was lower in iIFG, iIGT, and IFG/IGT than in NFG/NGT with greater reduction in IFG/IGT. Matsuda index, the relatively recently developed index of insulin sensitivity [20], is strongly correlated with insulin-stimulated total body glucose disposal during the euglycemic insulin clamp, which reflects whole body insulin sensitivity [20]. The present results indicate that both iIFG and iIGT are associated with whole body insulin resistance respectively, although plasma glucose level after glucose loading in iIFG and fasting plasma glucose level in iIGT are nearly similar as that in NFG/NGT respectively. Furthermore, IFG/IGT is characteristically associated with the more advanced whole body insulin resistance.
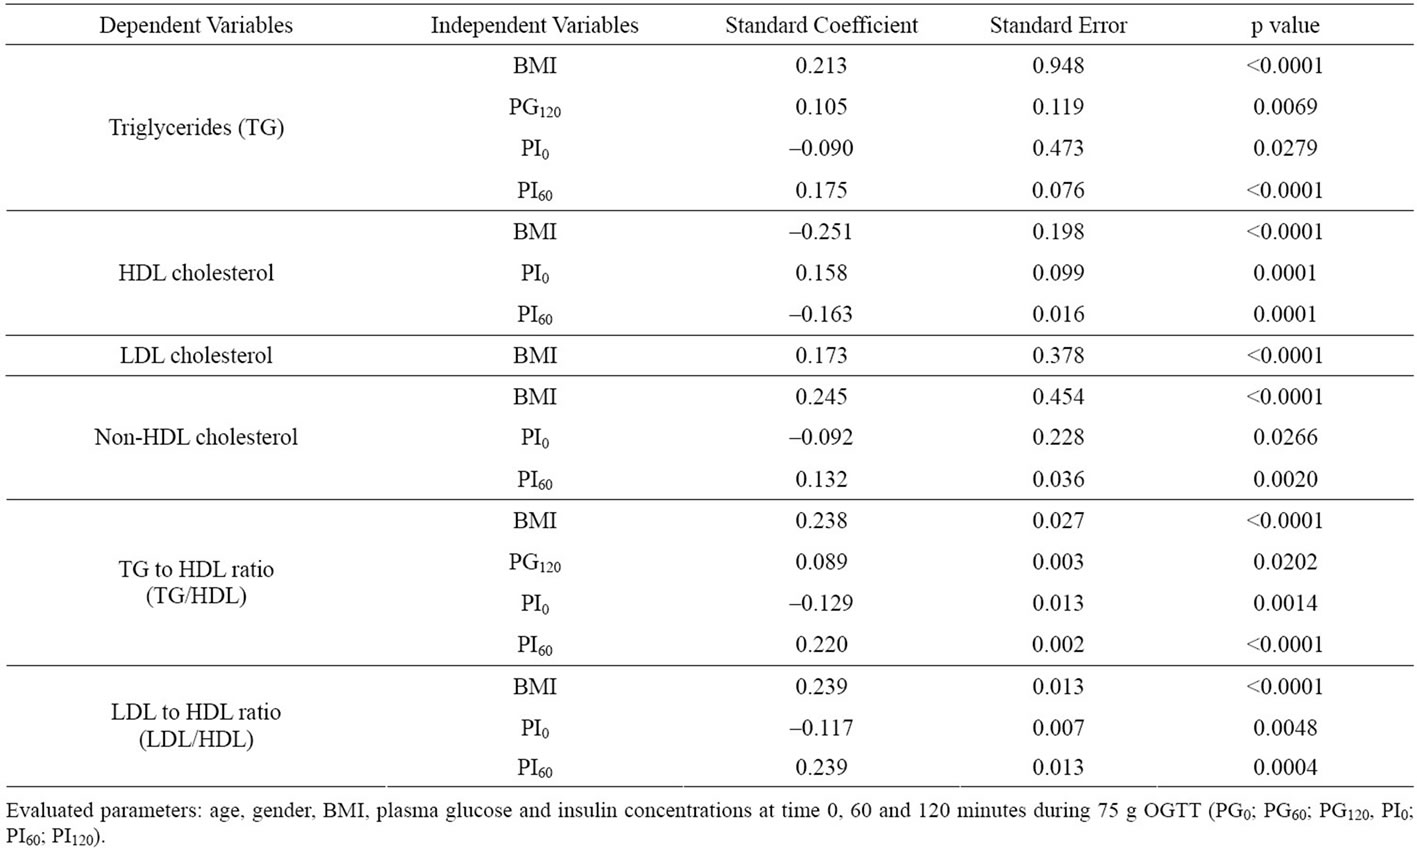
Table 2. Multiple regression analyses for serum lipids concentration and blood pressure.
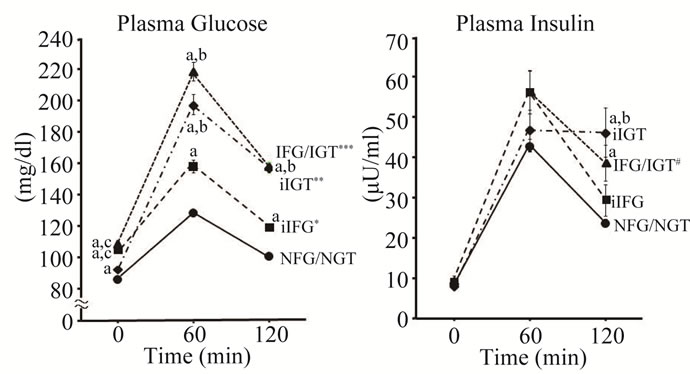
Figure 1. Plasma glucose and insulin in 75 g OGTT. Plasma glucose (PG) and plasma insulin (PI) concentrations during 75 g OGTT in four categories of glucose tolerance. NFG/NGT = normal fasting glucose and normal glucose tolerance, iIFG = isolated fasting glucose, iIGT = isolated glucose tolerance, IFG/IGT = impaired fasting glucose and impaired glucose tolerance. Mean ± SE. a, b, c: p < 0.01 compared with NFG/NGT, iIFG, and iIGT respectively. * p < 0.01 vs. NFG/NGT; ** p < 0.01 vs. NFG/NGT or iIFG; *** p < 0.01 vs. NFG/NGT, iIFG or iIGT in PG excursion; # p < 0.05 vs. NFG/NGT in PI excursion.
IFG/IGT showed characteristic serum lipid profile as compared with other types of prediabetes. TG level and TG/HDL were significantly higher in IFG/IGT but not in iIFG or iIGT compared to NFG/NGT. Increase in TG/HDL is reportedly a good indicator of increase in sdLDL particle [15,16,21]. Hence, the lipid profile in IFG/IGT appears to be very similar to “diabetic dyslipi-
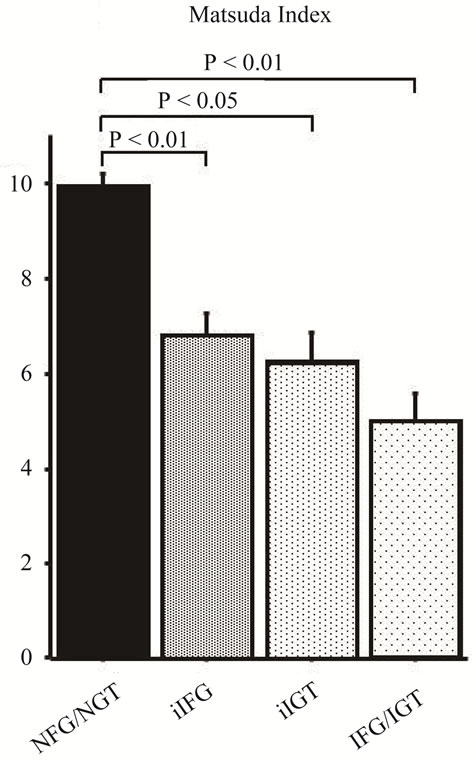
Figure 2. Whole body insulin sensitivity (Matsuda index) in four categories of glucose tolerance. NFG/NGT = normal fasting glucose and normal glucose tolerance; iFG = isolated fasting glucose; iIGT = isolated glucose tolerance; IFG/IGT = impaired fasting glucose and impaired glucose tolerance. Mean ± SE.
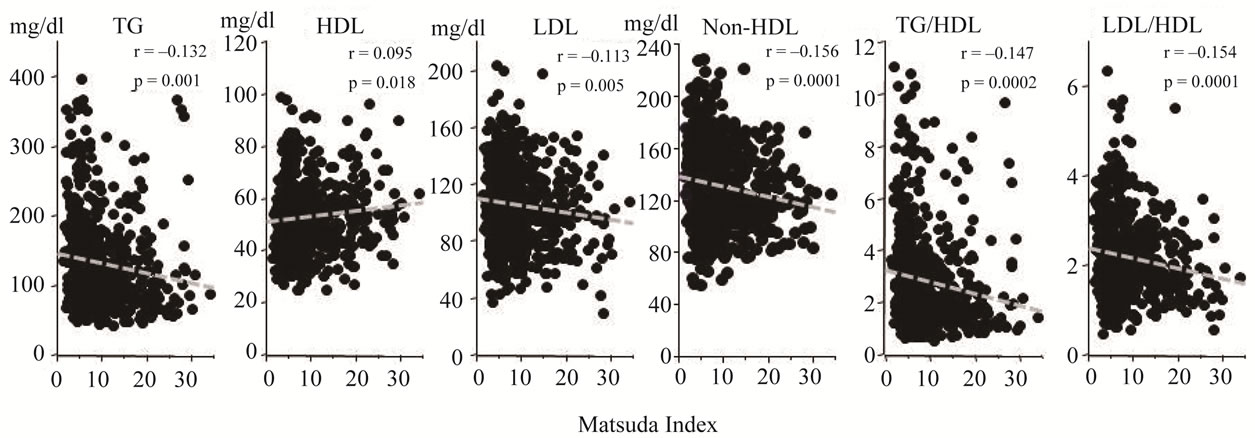
Figure 3. Relationships between whole body insulin sensitivity (Matsuda index) and lipids profile. Serum lipid parameters were plotted against Matsuda index. Matsuda index was inversely correlated with TG, LDL, non-HDL, TG/ HDL and LDL/HDL and positively correlated with HDL.
demia” in T2DM which is characterized by elevated TG, reduced HDL and predominant presence of sdLDL [3].
As for mechanism of the elevation of TG and TG/HDL in IFG/IGT, it is notable that plasma insulin excursion during the OGTT (Figure 1) and insulin resistance assessed by Matsuda index (Figure 2) were most advanced in this category of prediabetes. It has been suggested that insulin resistance can play a pivotal role in the development of diabetic dyslipidemia [22]. When adipocytes become insulin resistant, plasma concentration of free fatty acids (FFAs) rises as a result of increased intracellular hydrolysis of TG in adipocyte [23]. The elevated levels of plasma FFAs and resultant increased flux of FFAs to liver and muscle, inhibit for insulin to suppress hepatic glucose production and to stimulate skeletal muscle glucose uptake [24]. The increased flux of FFAs, glucose and insulin into liver can induce overproduction of TGrich VLDL (“large VLDL”) particles. As an additional mechanism of hypertriglyceridemia, VLDL clearance is impaired as a result, in part, of reduced plasma lipoprote in lipase activity [25,26]. Increase in large VLDL particles promotes cholesterol ester-TG exchange between VLDL and LDL by cholesteryl ester transfer protein (CETP), producing TG-enriched and cholesterol poor LDL [24]. The TG-enriched LDL becomes a good substrate for hepatic lipase, and the hydrolysis of LDL-TG produce sdLDL particles. In addition, CETP transfers large amounts of TG from TG-rich VLDL to HDL in exchange for HDL cholesteryl ester, which modifies normal HDL metabolism, function and plasma HDL concentration [23]. These modifications of lipid metabolism by FFAs and insulin resistance are consistent with the present observation that lipid profile in IFG/IGT subjects, who were more insulin resistant compared with iIFG and iIGT, is similar to the profile of diabetic dyslipidemia.
Matsuda index was significantly correlated with TG, HDL, LDL, non-HDL, TG/HDL and LDL/HDL (Figure 3). To get further insight into these correlations, we performed multiple regression analysis to define variables which best predict the presence of abnormal lipid profiles in prediabetic subjects (Table 2). As expected, BMI positively correlated with TG, LDL, non-HDL, TG/HDL and LDL/HDL and did inversely with HDL. Interestingly, correlations of PI60 with TG, HDL, non-HDL, TG/HDL and LDL/HDL were diametrically opposite to those of PI0. PI60 correlated positively with TG, non-HDL, TG/ HDL and LDL/HDL whereas PI0 did inversely with these parameters. In addition, the positive associations of PG120 with TG and TG/HDL were also observed. These results suggest that elevation of postprandial levels of plasma glucose and insulin based on whole body insulin resistance contribute to atherogenic lipids profile.
There are limitations in the present study. First, the present study had a cross-sectional design and we measured concentrations of serum lipids and plasma glucose and insulin during the OGTT only once, and thus we cannot exclude potential biases. Second, since the study sample is from only male Japanese, it is not clear whether the present finding can be generalized to other population.
In conclusion, the advanced whole body insulin resistance and resultant postprandial hyperinsulinemia and hyperglycemia may contribute to fundamental metabolic abnormalities leading to atherosclerotic cardiac events in prediabetic subjects.
![]()
![]()
REFERENCES
- Haffner, S.M., Lehto, S., Rönnemaa, T., Pyörälä, K. and Laakso, M. (1998) Mortality from coronary heart disease in subjects with type 2 diabetes and in nondiabetic subjects with and without prior myocardial infarction. The New England Journal of Medicine, 339, 229-234. doi:10.1056/NEJM199807233390404
- Garg, A. and Grundy, S.M. (1990) Management of dyslipidemia in NIDDM. Diabetes Care, 16, 434-444.
- American Diabetes Association (2003) Management of dyslipidemia in adults with diabetes (Position Statement). Diabetes Care, 26, S83-S86. doi:10.2337/diacare.26.2007.S83
- Shaw, J.T., Purdie, D.M., Neil, H.A., Levy, J.C. and Turner, R.C. (1999) The relative risks of hyperglycemia, obesity and dyslipidemia in the relatives of patients of type II diabetes mellitus. Diabetologia, 42, 24-27. doi:10.1007/s001250051107
- Haffner, S.M., Stern, M.P., Hazuda, H.P., Mitchell, B.D. and Patterson, J.K. (1990) Cardiovascular risk factors in confirmed prediabetic individuals. Does the clock for coronary heart disease start ticking before the onset of clinical diabetes? The Journal of the American Medical Association, 263, 2893-2898. doi:10.1001/jama.1990.03440210043030
- Colagiuri, S. (2011) Epidemiology of Prediabetes. Medical Clinics of North America, 95, 299-307.
- Expert Committee on the Diagnosis and Classification of Diabetes Mellitus (1997) Report of the expert committee on the diagnosis and classification of diabetes mellitus. Diabetes Care, 20, 1183-1197.
- Genuth, S., Alberti, K.G., Bennett, P., Buse, J., Defronzo, R., Kahn, R., Kitzmiller, J., Knowler, W.C., Lebovitz, H., Lernmark, A., Nathan, D., Palmer, J., Rizza, R., Saudek, C., Shaw, J., Steffes, M., Stern, M., Tuomilehto, J. and Zimmet, P., the Expert Committee on the Diagnosis and Classification of Diabetes Mellitus (2003) Follow-up report on the diagnosis of diabetes mellitus. Diabetes Care, 26, 3160-3167. doi:10.2337/diacare.26.11.3160
- The DECODE Study Group, the European Diabetes Epidemiology Group (2001) Glucose tolerance and cardiovascular mortality: Comparison of fasting and 2-hour diagnostic criteria. Archives of Internal Medicine, 161, 397- 404. doi:10.1001/archinte.161.3.397
- The DECODE Study Group, on behalf of the European Diabetes Epidemiology Group (2003) Is the current definition for diabetes relevant to mortality risk from all causes and cardiovascular and no cardiovascular diseases? Diabetes Care, 26, 688-696. doi:10.2337/diacare.26.3.688
- Liu, J., Sempos, C., Donahue, R.P., Dorn, J., Trevisan, M. and Grundy, S.M. (2005) Joint distribution of non-HDL and LDL cholesterol and coronary heart disease risk prediction among individuals with and without diabetes. Diabetes Care, 28, 1916-1921. doi:10.2337/diacare.28.8.1916
- Pischon, T., Girman, C.J., Sacks, F.M., Rifai, N., Stampfer, M.J. and Rimm, E.B. (2005) Non-high-density lipoprotein cholesterol and apolipoprotein B in the prediction of coronary heart disease in men. Circulation, 112, 3375- 3383. doi:10.1161/CIRCULATIONAHA.104.532499
- Brunzell, J.D., Davidson, M., Furberg, C.D., Goldberg, R.B., Howard, B.V., Stein, J.H. and Witztum, J.L. (2008) Lipoprotein management in patients with cardiometabolic risk: Consensus statement from the American Diabetes Association and the American College of Cardiology Foundation. Diabetes Care, 31, 811-822. doi:10.2337/dc08-9018
- Grundy, S.M., Cleeman, J.I., Merz, C.N., Brewer, H.B., Jr., Clark, L.T., Hunninghake, D.B., Pasternak, R.C., Smith, S.C., Jr. and Stone, N.J. (2004) Implications of recent clinical trials for the National Cholesterol Education Program Adult Treatment Panel III guidelines. Circulation, 110, 227-239. doi:10.1161/01.CIR.0000133317.49796.0E
- Barzi, F., Patel, A., Woodward, M., Lawes, C.M., Ohkubo, T., Gu, D., Lam, T.H. and Ueshima, H., Asia Pacific Cohort Studies Collaboration (2005) A comparison of lipid variables as predictors of cardiovascular disease in the Asia Pacific region. Annals of Epidemiology, 15, 405-413. doi:10.1016/j.annepidem.2005.01.005
- Gaziano, J.M., Hennekens, C.H., O’Donnell, C.J., Breslow, J.L. and Buring, J.E. (1997) Fasting triglycerides, high-density lipoprotein, and risk of myocardial infarction. Circulation, 96, 2520-2525. doi:10.1161/01.CIR.96.8.2520
- Ingelsson, E., Schaefer, E.J., Contois, J.H., McNamara, J.R., Sullivan, L., Keyes, M.J., Pencina, M.J., Schoonmaker, C., Wilson, P.W., D’Agostino, R.B. and Vasan, R.S. (2007) Clinical utility of different lipid measures for prediction of coronary heart disease in men and women. The Journal of the American Medical Association, 298, 776-785. doi:10.1001/jama.298.7.776
- Kimura, T., Itoh, T., Fusazaki, T., Matsui, H., Sugawara, S., Ogino, Y., Endo, H., Kobayashi, K. and Nakamura, M. (2010) Low-density lipoprotein-cholesterol/high-density lipoprotein-cholesterol ratio predicts lipid-rich coronary plaque in patients with coronary artery disease—Integrated Backscatter Intravascular Ultrasound Study. Circulation Journal, 74, 1392-1398. doi:10.1253/circj.CJ-09-0849
- Tanaka, S., Hayase, A., Hashimoto, A., Takagi, Y., Kondo, S., Hayashi, K., Yamamoto, M. and Iimura, O. (1990) Hypertension and cardiovascular diseases in an epidemiological study in Hokkaido, Japan. Journal of Cardiovascular Pharmacology, 16, S83-S86.
- Matsuda, M. and DeFronzo, R.A. (1999) Insulin sensitivity indices obtained from oral glucose tolerance testing: Comparison with the euglycemic glucose clamp. Diabetes Care, 22, 1462-1470. doi:10.2337/diacare.22.9.1462
- Boizel, R., Benhamou, P.Y., Lardy, B., Laporte, F., Foulon, T. and Halimi, S. (2000) Ratio of triglycerides to HDL cholesterol is an indicator of LDL particle size in patients with type 2 diabetes and normal HDL cholesterol levels. Diabetes Care, 23, 1679-1685. doi:10.2337/diacare.23.11.1679
- Schwartz, S.L. (2006) Diabetes and dyslipidemia. Diabetes, Obesity and Metabolism, 8, 355-364.
- Ginsberg, H.N. (2000) Insulin resistance and cardiovascular disease. Journal of Clinical Investigation, 106, 453- 458. doi:10.1172/JCI10762
- Kahn, B.B. and Flier, J.S. (2000) Obesity and insulin resistance. Journal of Clinical Investigation, 106, 473- 481. doi:10.1172/JCI10842
- Taskinen, M.-R. (1995) Insulin resistance and lipoprotein metabolism. Current Opinion in Lipidology, 6, 153-160. doi:10.1097/00041433-199506000-00007
- Garvey, W.T., Kwon, S.D., Shaughnessy, S., Wallace, P., Hutto, A., Pugh, K., Jenkins, A.J., Klein, R.L. and Liao, Y. (2003) Effects of insulin resistance and type 2 diabetes on lipoprotein subclass particle size and concentration determined by nuclear magnetic resonance. Diabetes, 52, 453-462. doi:10.2337/diabetes.52.2.453
NOTES
*The authors declare no conflict of interests or financial disclosure.