Journal of Behavioral and Brain Science
Vol.4 No.4(2014), Article ID:45258,22 pages DOI:10.4236/jbbs.2014.44020
Ventral Tegmental Area Neuronal Activity Correlates to Animals’ Behavioral Response to Chronic Methylphenidate Recorded from Adolescent SD Male Rats
Zachary Jones1, Cruz Reyes Vazquez2, Nachum Dafny1*
1Department of Neurobiology and Anatomy, University of Texas Medical School at Houston, Houston, USA
2Departmento de Fisiologia, Divivion de Investigacion, Facultad de Medicina, Universidad NacionalAutonoma de Mexico, Mexico City, Mexico
Email:*Nachum.dafny@uth.tmc.edu
Copyright © 2014 by authors and Scientific Research Publishing Inc.
This work is licensed under the Creative Commons Attribution International License (CC BY).
http://creativecommons.org/licenses/by/4.0/


Received 1 March 2014; revised 5 April 2014; accepted 14 April 2014
ABSTRACT
Methylphenidate (MPD) is considered as the first-line pharmacotherapy to treat ADHD. More recently, MPD has also been used as a cognitive enhancement recreationally. Its therapeutic effects are not fully understood, nor are the long term effects of the drug on brain development. The ventral tegmental area (VTA) neuronal activity was recorded from freely behaving adolescent rats using a wireless recording system. Five groups were used: saline, 0.6, 2.5, 5.0 and 10.0 mg/kg MPD. The experiment lasted for 10 days. This study demonstrated that VTA neurons respond to MPD in a dose response characteristic and the same dose of MPD can cause both behavioral sensitization and behavioral tolerance. The neuronal unit activity was evaluated based on the animals’ behavioral activity following chronic MPD administration. The study showed that the animals’ behavioral response to different acute MPD of 0.6, 2.5 and 10.0 mg/kg doses responded in a dose response characteristics. Moreover, the same chronic dose of 0.6, 2.5, and 10.0 mg/kg MPD elicits in some animals’ behavioral sensitization and in some others behavioral tolerance. Therefore, the neuronal activity recorded from animals expressing behavioral sensitization was analyzed separately from the neuronal activity recorded from of behaviorally tolerant animals and it was found that the VTA units of the behaviorally sensitization animals responded significantly different to the drug than those VTA units recorded from animals expressing behavioral tolerance.
Keywords:Ritalin, Electrophysiology, Neuronal Activity, Behavior, Ventral Tegmental Area

1. Introduction
Methylphenidate (Ritalin, MPD) is a psychostimulant most commonly used to treat attention deficit hyperactivity disorder (ADHD) [1] -[3] . ADHD is a behavioral disorder with onset in early childhood that is typified by increased levels of hyperactivity, impulsivity, and inattention (Newcorn, 2000). This disorder can cause children to have trouble in concentrating and misbehave in school and can also create social misconduct in the affected individuals [4] . It is estimated that in the worldwide, about 5% of children and 4% of adults are affected with ADHD and in the U.S.around 8.7% of the children meet the criteria for ADHD [5] -[7] . Treatment of ADHD is usually done with psychostimulants such as amphetamine and methylphenidate (MPD) for long periods of time [8] [9] . MPD is a psychostimulant synthesized over 50 years ago and has become the drug of choice for ADHD treatment [10] [11] . Recently, the recreational use of MPD by adolescent and young adults has risen [12] [13] , which poses a risk because MPD acts similarly to drugs of abuse such as cocaine by binding to the dopamine transporter (DAT) and has a chemical structure similar to amphetamine and methamphetamine [14] [15] . Due to its similarities to these well-known drugs of abuse, the increased use of MPD by adolescents and young adults is potentially dangerous since its use could lead to possible liability to drug dependency later in life or unknown developmental disorders. It is still unclear how psychostimulants such as MPD affect the adolescent brain and whether it can alter the neuropil formations occurring during neurodevelopmentor not.
It is not uncommon for MPD to be prescribed to children as early as elementary school, a time when the brain is still going through development[16] . In fact, the percentage of children between the ages of 4 - 17 years who have been diagnosed with ADHD has increased from 7.8% in 2003 to 9.5% in 2007, representing a 21.8% increase in just 4 years [17] . Between 5 and 15 years of age, the human brain goes through a process of over production of synaptic connections and receptors followed by their pruning and competitive elimination, which may serve as a factor in the development of behavior disorders [18] -[21] .
Behavioral and chemical studies have reported that MPD affects the young differently than adults[22] -[25] . MPD exposure has been shown to produce age and dose dependent increase in extracellular levels of DA and in norepinephrine (NE) levels [26] . [27] reported that the extracellular DA levels in adolescents treated with MPD are higher than those in adults who have been treated with MPD. In anesthetized animals, MPD was reported to affect neuronal functions differently in the young compared to adults [28] . A functional MRI study has reported drastically different responses to MPD between adolescent and adults [23] .Thus it is possible to assume that MPD efficacy will be different in young populations when compared to adults. Therefore, it is important to study the role of MPD in adolescents.
MPD is thought to act mainly through the mesolimbic dopaminergic system, of which the ventral tegmental area (VTA) is considered as a key component. Moreover, the VTA is thought to be a part of the motive circuit which is essential for reinforcement and reward [29] -[32] . However, the long term exposure of psychostimulants, particularly MPD on brain development is not yet known, which makes it imperative to study the dose response properties of acute and chronic MPD action in freely behaving animals previously implanted with permanent electrodes within the VTA in an attempt to better understand the effects of the drug on adolescent VTA neuronal activity as well as animal behavioral.
More recently it was reported [33] that the doses of 0.6, 2.5, and 10.0 mg/kg MPD if exposed repetitiously (chronic) to freely behaving adult rats, some of the animals exhibited behavioral sensitization and other animals exhibited behavioral tolerance to the same dose of MPD. Since anesthesia can interfere with psychostimulant exposure and modulate the drug’s effects, freely behaving animals previously implanted with four permanent semi-microelectrodes within the VTA were used in this study. We hypothesize that the same chronic MPD exposure to adolescent rats will elicit in some animals’ behavioral sensitization and in others behavioral tolerance and that the VTA units recorded post MPD treatment in animals expressing behavioral sensitization to chronic MPD exposure will respond differently than those VTA units recorded from animals expressing behavioral tolerance. To confirm this hypothesis, acute and chronic dose response exposures to MPD were recorded from freely behaving animals before and after MPD exposure.
2.Methods
2.1. Animals
Male Sprague-Dawley rats (N=142) at post natal day of about 32 days were purchased (Harlan, Indianapolis, IN, USA) and were allowed 3-4 days of acclimation in our vivarium room on a 12 hour light/dark schedule (lights on 6:00am) prior to electrode implantation. Food and water were given ad libitum. The animals were housed individually in clear acrylic standard cages that served as both home cage and test cage for this study. The experiment was approved by our Animal Welfare Committee and carried out in accordance with the National Institute of Health Guide for Care and Use of Laboratory Animals.
2.2. Surgeries
Prior to surgery, two Nickel-Chromium Teflon coated (fully insulated except at tips) 60 µ in diameter wire were twisted to make two recording electrodes for each VTA hemisphere. Each of the four wires was secured to a 1.0 cm copper connector pin (A-M systems, INC.). On the day of surgery, the rats were anesthetized with an intraperitoneal (i.p.) injection of 25 mg/kg pentobarbital. The animal’s head was shaved and lidocaine hydrochloride topical gel was applied to the shaved area. The animal was then placed in a stereotaxic apparatus where an incision was made on the scalp and the muscle and connective tissue was removed to expose the skull. Bilateral holes were drilled on the skull above the VTA at 2.6 mm posterior to bregma and 0.75 mm lateral from midline, using the Sherwood and Timiras (1970) adolescent rat brain atlas coordinates[34] . Four anchor screws were inserted in the skull at vacant spots to secure the implanted electrodes and the head plug. Electrodes were then inserted individually into the brain at an initial depth of 8.0 mm from the skull with neuronal activity monitored by Grass P511 series amplifier and its emitter Hi Z Probe. When a 3:1 signal to noise ratio spike(s) activity was obtained, the electrode was permanently secured to the skull using web glue cyanoacrylate surgical adhesive. When the neuronal activity exhibited less than a 3:1 signal to noise ratio spike activity, the electrode was lowered in 5-10 µm increments up to a maximum depth of 8.5 mm until a 3:1 ratio spike(s) activity was observed [33] [35] -[40] . Similar procedures were followed for the second twisted electrode which was implanted into the VTA of the opposite hemisphere. The two copper pins from each twisted electrode from the four recording electrodes, were inserted into Amphenol plugs which were secured to the skull using dental acrylic cement creating the skull cap. Animals were allowed 3 to 4 days recovery after electrode implantation during which they were placed daily with their home cage in the experimental apparatus and connected to the wireless (telemetric) head stage transmitter (Triangle BioSystems International (TBSI); Durham, NC, USA) for acclimation for at least 2 hours/day to the behavioral and electrophysiological recording systems. At the first experimental day, the animal’s age was about post natal 39-41 days.
2.3. Drugs
Methylphenidate hydrochloride (MPD) was donated byMallinckrot (Hazelwood, MO, USA). To obtain the 0.6, 2.5, 5.0 and 10.0 mg/kg, the MPD salt was dissolved in a 0.9% isotonic saline solution, the MPD doses were calculated as a free base. Control injections consisted of 0.8 ml isotonic saline solution (0.9% NaCl) administered i.p. All injections were equalized to a volume of 0.8 ml with 0.9% saline to keep injection volumes the same for all of the animals and for all the MPD doses.
Previous MPD dose response experiments, testing the effect of the drug on the animal’s behavior and on sensory evoked potential recording before and after 0.1 mg/kg to 40.0 mg/kg MPD administration, found that behavioral effects of MPD were observed from 0.6 mg/kg and higher MPD doses[25] [41] -[51] . Therefore 0.6, 2.5, 5.0 and 10.0 mg/kg MPD dosages were selected for this study.
2.4. Experimental Protocol
After 3 to 4 days of recovery from electrode implantation and adaptation to the behavioral and electrophysiology systems, the behavioral and the neuronal recordings began. On experimental day one (ED1), rats with their home cage were placed in a Faraday testing box to reduce noise during the recording session. The wireless neuronal recording system (Triangle BioSystem International TBSI, Durham, NC USA); head stage was connected to the electrode pins of the skull cap and the animals were allowed to acclimate for an additional 30 minutes prior to the recording session. During this 30 min,the electrophysiological activity was monitored and was used to set the recording software parameters to capture the electrical activity and to prepare the injection solutions of both saline and MPD. After acclimation, the animals received a saline injection of 0.8 ml (standardized for all injections) and the baseline neuronal and behavioral activity was recorded concomitantly for one hour followed by the second injection of saline, 0.6, 2.5, 5.0 or 10.0 mg/kg MPD, and the behavioral and the neuronal activity recordings were resumed for an additional hour post drug injection (Table1). The wireless TBSI head stage sent neuronal activity signals from the 4 recording electrodes to a receiver that was connected to an analog-to-digital converter which collected and stored the recorded data on a PC using Spike 2.7 CED software. On ED2 through ED6 animals received either saline or daily MPD injections similar to ED1 injection in their home cage without neuronal recordings depend on the group. On ED7 through ED9 the animals underwent a washout period in which no injections were given proceeded by ED10 in which a saline injection was given and the neuronal and behavioral baseline activity was recorded for an hour followed by a rechallenge administration of either saline or MPD dose similar to ED1 and recordings were resumed for an additional one hour just as on ED1 (Table1).
2.5. Behavior Apparatus
Locomotor activity was recorded concomitantly with neuronal activity, using an open field computerized animal activity system (Accuscan, Columbus, Ohio). The animal’s home cage fit into the recording apparatus thus allowing us to record using the animal’s home cage as the test cage. The open field system contains cages of 40 cm in length with 16 infra-red beams and their sensors and 40 cm in width which contain additional16infra-red beams and their sensors set at 5 cm above the floor of the cage. Movement across any of the infrared beams results in a beam break which is subsequently recorded as the animal’s movement. The software evaluated the data to horizontal activity (HA) counts, total distance (TD) traveled in cm and number of stereotypic movements (NSM) and downloaded it to a PC in 10 minute bins (i.e., 6 bins/hr). These 6 bin counts were used to produce temporal graphs and histograms for total activity/hr for both the saline baseline activity and the activity after MPD administration for ED1 and ED10.
2.6. Electrophysiological Apparatus
A Triangle BioSystems International (TBSI) telemetric head stage weighing 4.5 g was attached to the electrode pins of the skull cap of the rat. The head stage sent neuronal activity signals (sampling rates up to 200 kHz) to a receiver connected to the Cambridge Electronic Design (CED) analog-to-digital converter (Micro 1401-3; CED, Cambridge, UK) which stored the data on a PC using the Spike 2 version 7 software for offline analysis.
2.7. Offline Data Analysis
2.7.1. Behavioral Analysis
Total Horizontal activity (HA) was recorded and summed in 10 minute bins for 60 minutes after the first saline

Table 1summarizesthe experimental protocol. Four groups of animals were used: saline, 0.6, 2.5 and 10.0 mg/kg MPD. On experimental day 1 (ED1), animals are given an initial dose of saline and recordings were taken for one hour followed by one of the four designated doses and recordings were resumed for an additional hour post injection. On days 2-6, the animals are only given an injection of the specified dose. Days 7-9 are washout days where the animal gets no injection of any kind. On ED10, the animals are given another dose of saline for one hour followed by the designated dose for one hour, identical to that given on ED1. Behavioral and neuronal recordings were obtained on ED1 and again on ED10.
injection proceeding another 60 minutes of locomotor activity counts recorded following either saline or 0.6, 2.5, 5.0, or 10.0 mg/kg MPD i.p. and again on ED10 similar to ED1 following saline and MPD exposure (Table1). The following comparisons were performed: 1) Behavioral analysis of HA for the acute MPD effect (the activity post MPD at ED1) was compared to the activity after saline (control) of ED1; 2) the baseline activity post saline at ED10 was compared to the baseline activity after saline on ED1 to observe if six daily MPD exposures and three washout days modulate the ED10 baseline activity and 3) the activity following MPD on ED10 was compared to the activity after MPD at ED1 to determine the chronic effect of MPD. If at ED10 MPD elicits significantly higher activity compared to that elicited by MPD on ED1, it was considered that repetitive (chronic) MPD exposure elicits behavioral sensitization. If the opposite occurs, MPD exposure at ED10 elicits significant reduction in activity compared to MPD exposure at ED1, it was considered that chronic MPD exposure elicits behavioral tolerance.The Critical Ratio (CR)statistical test was used to determine the effect of the drug;

[33] [35] [36] [40] [47] -[51] . Where for example E represents the HA counts after MPD administration at ED1, and C represents the HA counts after initial saline (control) injection of ED1. Acute effect of MPD was determined when at ED1 the 60 mni activity post MPD was significantly different from 60 min baseline activity. Chronic effect of MPD (sensitization/tolerance) was determined when the 60 min activity at ED10 post MPD exposure was significantly different from that obtained at ED1 post MPD exposure. In addition the student pair t-test was also used.
Based on the above analysis each rat was individually classified as exhibiting either behavioral sensitization or exhibiting behavioral tolerance and thus two sub groups were created: sensitized and tolerant/non-sensitized group. These rat subgroups were analyzed again as a group using analysis of variance (ANOVA: treatment days and drug doses). Any statistical significance was determined with the post hoc Fischer’s LSD method. Statistical significance was set at P< 0.05 for all comparisons.
2.7.2. Electrophysiological Analysis
1) Spike Sorting
The Spike 2 version 7 software (CED) was used for spike sorting. The data was captured by the program atsampling rates of up to 200 kHz and processed using low and high pass filters (0.3-3 kHz). There were two window discriminator levels, one for positive-going spikes and one for negative-going spikes. The spikes with peak amplitudes within the window were used to create templates using 1000 waveform data points. The system that was used to capture a spike pattern allows the extraction of templates that provide high-dimensional reference points which can be used to perform accurate spike sorting, despite some movement artifacts noise, false threshold crossing and waveform overlap. All temporally displaced templates are compared with the incoming spike event to find the best fitting to the selected template amplitude that yields the minimum residue variance. When the distance between the template and waveform exceeds some threshold (80%), the waveforms are rejected. This means that the spike sorting accuracy in the reconstructed data is about 95%. All of the parameters of spike sorting for each electrode at ED1 were stored and reused for the activity sorting at ED10 aiming to count the same spike amplitude and pattern at ED1 and ED10 following saline and MPD administration from the same electrode. Spikes with peak amplitudes outside these limits and spikes that didn’t fit the template were rejected and not counted. The interspike time interval of the neuronal firing patters was also completed. With a bin size of 5ms and 200 bin width, the firing patters of the neurons was examined.
2) Electrophysiological Data Evaluation
Once the neuronal activity was sorted and counted, the activity post saline and MPD exposure was exported to a spreadsheet to produce sequential firing rate graph spikes/sec and the spikes counting were used to calculate the drug effects. The initial 60 minutes count contained the baseline activity following saline injection, whereas the following 60 minutes contained the data following either the 2ndsaline injection as control or the activity following acute MPD administration. The spreadsheet displayed the rat’s identity number, experimental day, dose of MPD, channel (for multiunit recording labeling) and average firing rate spikes/sec. This data was used to analyze the difference in firing rates between the neuronal activity counts after drug administration on ED1 to baseline activity on ED1 to assess the MPD acute effects. Second, the baseline activity on ED10 was compared to the neuronal activity counts post baseline activity on ED1 to find out whether the six consecutive daily MPD injections and the three washout days resulted in the baseline alteration, and lastly, the neuronal activity counts post drug administration on ED10 was compared to the neuronal activity counts post drug administration on ED1 to find out whether sensitization or tolerance is expressed.
Multiple methods were employed to find out whether MPD elicits significant effect on VTA neuronal activity as follows: the mean activity after MPD treatment needs to be at least two standard errors (S.E.) difference from the control mean firing rate. Firing rates were evaluated also for normality assumptions to determine parametric or non-parametric methods. To evaluate differences between the above comparisons, the firing rates were determined to not hold normality assumptions, so we assessed also differences in firing rates using the Critical Ratio (CR) test.

(C = control, E = activity after drug exposure) for the first comparison. For the second comparison, E was the baseline at ED10 and C is the baseline at ED1, while for the third comparison E was the data post MPD exposure at ED10 and C the data post MPD exposure at ED1 [33] [35] [36] [40] [47] -[51] . C.R. value more than +1.96 indicated that the treatment elicited significant increases in activity, while a C.R. value more than −1.96 indicated the treatment elicited significant attenuation in activity.
In addition, the natural log ratio and the log linear model statistical tests were used: the natural logs ratio was utilized to determine the likelihood of VTA neuronal population responded to MPD exposure recorded from animals expressing behavioral sensitization are the same or significantly different from the VTA neuronal population recorded from animals expressing behavioral tolerance to repetitive MPD exposure. This was done for the data obtained following the initial (acute) MPD injection compared to ED1 baseline, the baseline neuronal activity at ED10 compared to the baseline activity at ED1, and the recording following rechallenge of MPD at ED10 compared to the initial MPD injection at ED1. To compensate for the smaller values observed on certain days for varying doses, 0.5 was added to all numbers for computation of the odds ratio. A number of 1 and higher in the odds ratio test indicates a higher likelihood of differences in the neuronal populations responding to MPD exposure in one group (i.e. animals expressing behavioral sensitization) compared to the other group of animals (i.e. animals expressing behavioral tolerance). Conversely, a number smaller than 1 represents a lesser chance of differences between the two VTA neuronal populations.
The log linear model was used next to control for dose when comparing the overall activity (acute, baseline and chronic) between the two groups (neuronal recordings obtained from animals expressing behavioral tolerance to those recordings obtained from animals expressing behavioral sensitization) to determine if there was a significant difference between dose behavior and firing patterns for each group (0.6, 2.5, 5.0 and 10.0 mg/kg). P-values of < 0.05 obtained from the log linear model were considered as significant.
2.7.3. Histological Verification of Electrode Placement
Upon completion of the recording, the animals were overdosed with sodium pentobarbital. The rat was then perfused intracardially with 10% formaldehyde solution containing 3% potassium ferrocyanide. A 2mA DC current was passed through the tip of each electrode for 40 seconds to create a small lesion to identify the electrode location; the brain was extracted from the skull and placed in 10% formaldehyde for several days. The brains were sliced in 40-60µm sections and histologically stained with Cresyl Violet. The position of the electrode tip was identified by the location of the lesion and the Prussian blue spot using the Rat Brain atlas (Sherwood and Timiras, 1970)[34] . Only data from electrodes confirmed to be within the VTA and exhibiting similar spike amplitude and pattern at the ED1 and ED10 recording session was included (Figure1).
3. Results
A total of 142 rats with electrodes confirmed to be in the VTA (Figure1) were used in this experiment; 11, 28, 31, 29, and 43 rats were treated with saline (control), 0.6, 2.5, 5.0, or 10.0 mg/kg MPD respectively and 336VTA units were recorded, 26, 81, 99, 29, and 101 after saline, 0.6, 2.5, 5.0, and 10.0 mg/kg MPD respectively.
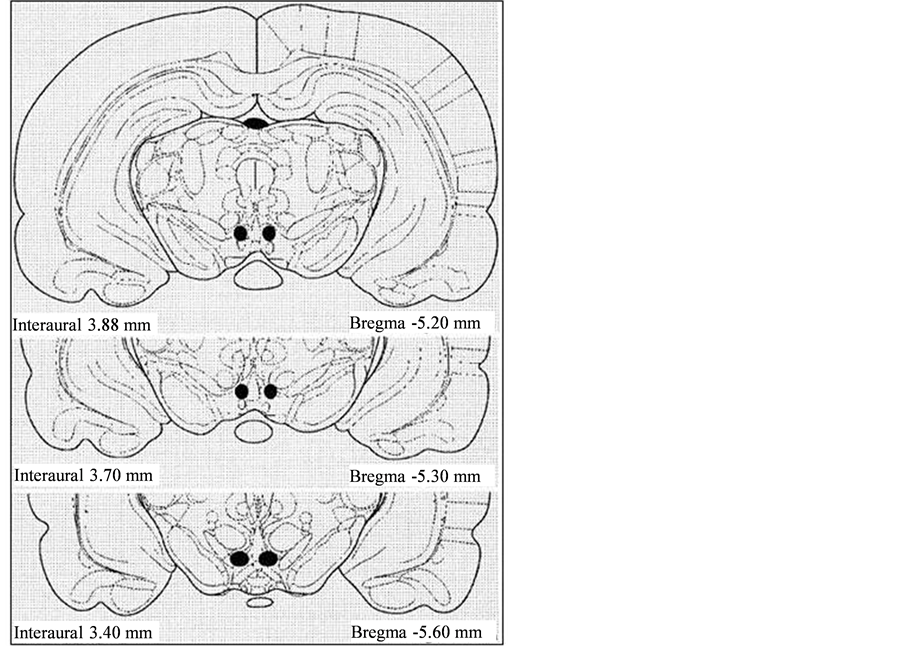
Figure 1summarizes the histologically verified electrode tip placement in the VTA using the coordinates given in the Sherwood and Timiras rat brain atlas 1970. The black spots are the locations of the electrode tips.
3.1. Behavior
Control: Eleven animals were treated only with saline. The locomotor activity (HA, TD and NSM) from ED10 compared to ED1 following chronic injection of saline exhibited similar locomotor activities with minor non-significant fluctuations following single and multiple saline injections. This showed that neither saline, needle injectionnor handlinghad any effect on behavioral activity (Figure2). Thereforeany significant changes from baseline after drug treatment were due to the effects of MPD.
The overall effect of the acute MPD administrationresulted ina dose response dependent increase in locomotor activity, with increasing MPD doses, further activation was observed. In addition, the baseline activity at ED10 after six daily MPD exposures and three washout days compared to ED1 was increased (data not shown).In general the locomotor activity of all the animals after MPD rechallenge on ED10 compared to the recording of ED1 after the initial MPD administrationfor the 0.6 mg/kg exhibit no effect, for the doses of 2.5 and 5.0 mg/kg MPD elicitedbehavioral tolerance and in the higher MPD dose of 10.0 mg/kg dose the group expressed behavioral sensitization (Figure3 All).
When the animals were separated based on their individual responses to chronic MPD using the C.R. test, 14individual animals failed to respond significantly to the initial (acute) MPD exposure at ED1, but expressed significant (p< 0.05) increases in their locomotor activity using the ANOVA test. They expressed behavioral sensitization to MPD rechallenge exposure at ED10 (Figure3 0.6 mg/kg MPD Sensitized). Fourteen individual animals exhibited behavioral tolerance to 0.6 mg/kg MPD rechallenge at ED10 compared to MPD at ED1 using the C.R. test. These animals at ED1 exhibited significant (p< 0.05) increases in their behavioral activity following acute MPD exposures and on ED10 exhibited a significant (p< 0.05) decrease in their activity in response to the MPD rechallenge compared to activity post MPD at ED1 using the ANOVA test(Figure 3 0.6 mg/kg MPD Tolerance).
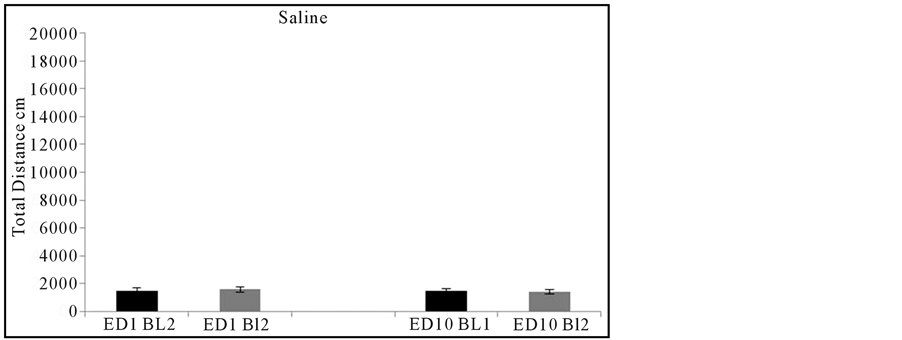
Figure 2summarizes the total distance activity of the control groups (N=11) after two injections of saline on experimental day 1 (ED1) and ED10. For each experimental day, saline was first injected and the behavioral activity was recorded for one hour. Following this, another injection of saline was given and again the animals were recorded for another hour. Comparison between the activity following the 1st and 2nd saline injections on ED1 with ED10 showed no significant differences.
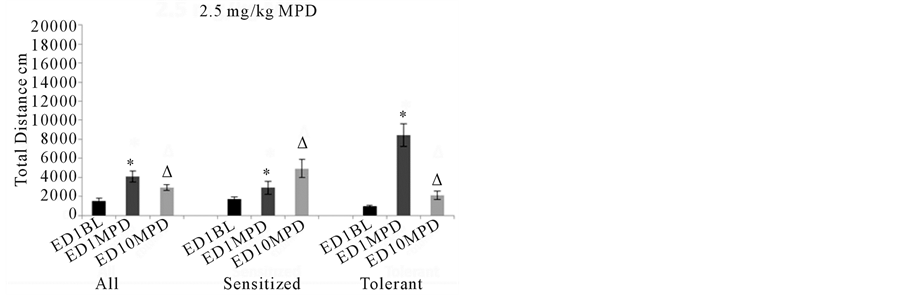
Thirty-one animals were treated with acute and chronic 2.5 mg/kg MPD. Acute MPD exposure elicitedsignificant (p< 0.05) increases in activity while repetitive (chronic) 2.5 mg/kg MPD elicited significant (p< 0.05) decreases in activity at ED10 compared to the activity elicited by the initial MPD exposure at ED1, i.e., tolerance to MPD rechallenge (Figure3, 2.5 mg/kg MPD All). When the animals were separated by their individual behavioral responses to MPD, 22 out of the 31 animals exhibited individually behavioral sensitization using the C.R. test and as a group using the ANOVA test had significant (p< 0.05) increases to acute administration of MPD, and following rechallenge dose of 2.5 mg/kg MPD on ED10 exhibited further significant (p< 0.05) increase compared to that observed on ED1 i.e. expressing behavioral sensitization (Figure3, 2.5 mg/kg MPD Sensitized). Nineindividual animals each exhibited behavioral tolerance using the C.R. test. These animals showed a significant (p< 0.05) increase in activity to acute administration of MPD, and a significant decrease in activity following rechallenge to MPD on ED10 compared to the effect of MPD on ED1 using the ANOVA test (Figure3,2.5 mg/kg Tolerance). Those animals that exhibited tolerance to MPD rechallenge at ED10 responded to acute MPD significantly (p<0.05) higher than the animals that expressedbehavioral sensitization (Figure3, 2.5 mg/kg MPD).
Twenty-nine animals were treated with 5.0 mg/kg MPD. When these animals were grouped together, there was a significant (p< 0.05) increase in response to the acute dose of MPD while 5.0 mg/kg MPD rechallenge at ED10 results in a significant (p<0.05) reduction in locomotion compared to the effect of MPD on ED1 using the ANOVA test (Figure3, 5.0 mg/kg MPD All). When the animals were separated based off of individual responses to the drug using the C.R. test, there were 18animals that exhibited significant (p< 0.05) increases to acute MPD exposure and further significant (p< 0.05) increases in their locomotor activity to MPD rechallenge at ED10 compared to ED1 activity post MPD exposurei.e. exhibited behavioral sensitization (Figure3 5.0 mg/kg MPD Sensitized). There were 11individual animalsthat exhibited a significant (p< 0.05) increase in activity to acute MPD on ED1, and a significant (p< 0.05) decrease in locomotion on ED10 with the rechallenge dose of MPD compared to the acute MPD on ED1 i.e. exhibited behavioral tolerance (Figure3,5.0 mg/kg Tolerance).
Forty-three animals were treated with 10.0 mg/kg MPD and when grouped together, these animals exhibited a significant (p< 0.05) increase in locomotor activity to the acute administration of MPD on ED1.Following MPD rechallenge at ED10, these animals exhibited further significantly (p< 0.05) increasedlocomotor activityusingthe ANOVA test (Figure 3, 10.0 mg/kg MPD, All). When the animals were separated based off of their individual responses to 10.0 mg/kg MPD using the C.R. test, 37 animals that individually exhibited behavioral sensitization responded significantly (p< 0.05) to acute MPD exposure by increasing theirbehavioral activity and had further significant (p< 0.05) increases in their locomotor activity following rechallenge MPD at ED10 compared to ED1 activity post MPD exposure using the ANOVA test (Figure 3, 10.0 mg/kg MPD Sensitized).
 (a)
(a)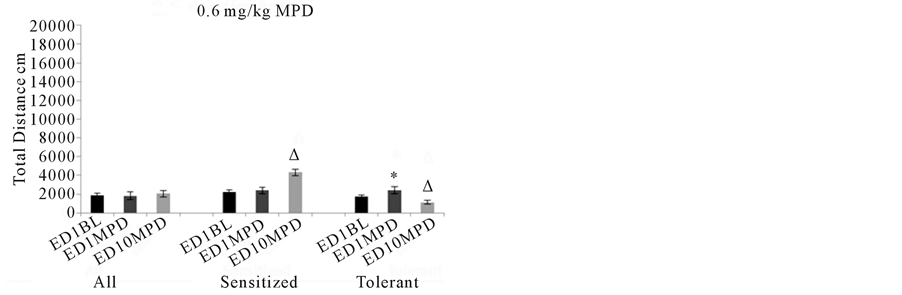 (b)
(b)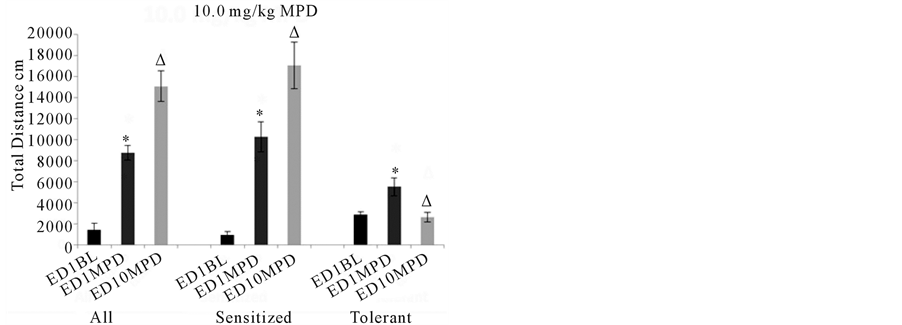 (c)
(c)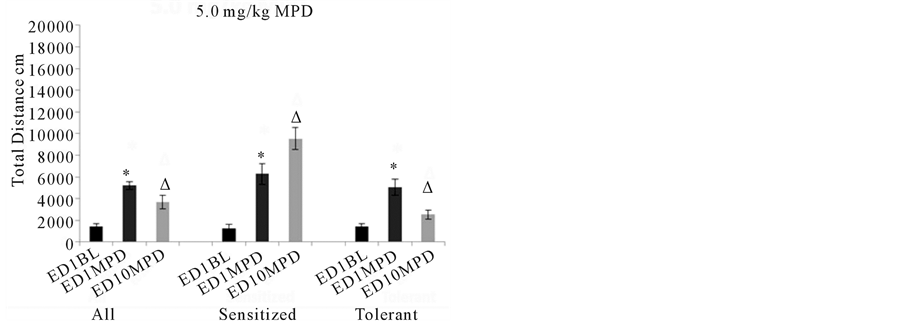 (d)
(d)
Figure 3summarizes the behavioral activity of the four experimental groups following acute and chronic injection of MPD. Four doses were used: 0.6, 2.5, 5.0, and 10.0 mg/kg MPD. For each dose, the activity for all the animals grouped together (N=131) is shown on the left part of the histogram with comparisons between the ED1 baseline activity, the ED1 activity following MPD injection, and the ED10 activity post MPD injection compared to that post MPD activity on ED1. For the middle and right sides of each histogram (0.6, 2.5, 5.0, and 10.0 mg/kg MPD), the animal groups are broken down into two additional groups: those individual animals exhibiting behavioral sensitization (N=91) and those individual animals exhibiting behavioral tolerance (N=40). All= summarizes the total distance of all the animals. Sensitized= summarizes the total distance of animals expressing behavioral sensitization and Tolerance= summarizes the total distance of the individual animals that express behavioral tolerance.*= indicates significant (p< 0.05) difference between the effect of the initial MPD exposure at ED1 to their baseline activity.∆= indicates significant difference between the ED10 activity post MPD to the activity of ED1 post MPD exposure.
Six individual animals responded to acute MPD exposure by increasing their locomotor activity and the MPD exposure at ED10 resulted in significantly (p< 0.05) lessactivity compared to the initial MPD exposure using the ANOVA testi.e., these animals expressed behavioral tolerance to MPD rechallenge at ED10 compared to the initial acute MPD exposure at ED1 (Figure 310.0 mg/kg MPD Tolerance).
3.2. Electrophysiology
A total of 336 units were histologically confirmed to be recorded from the VTA and exhibited similar amplitude and wave form at ED1 and ED10. Twenty six VTA units were recorded from 11 rats following acute (ED1) and repetitive (ED10) saline injection. Figure4 shows typical VTA unit activity recorded in this study; from these 26 units 2 showed decreased activity at ED1 following the 2nd saline injection compared to the activity following the first saline injection. The baseline activity of one VTA unit at ED10 compared to ED1 baseline exhibited a decrease in activity, and one VTA unit exhibited an increase in activity at ED10 following saline injection. This observation revealed that the saline injections and animal handling did not significantly alter the neuronal activity of VTA neurons.
Three hundred and ten VTA units were recorded following acute and chronic MPD exposure. Sixty percent (186/310) of the VTA units exposed to acute (0.6, 2.5,5.0 or 10.0 mg/kg) MPD responded significantly (p< 0.05) to the drug at ED1 by changing their firing rate compared to their baseline activityand the majority of the VTA responsive units, 75% (139/186), exhibited significant (p< 0.05) increases in their neuronal firing rates in response to the initial (acute) MPD exposure. Seventy-one percent (221/310) of the units exhibited significant changes in their baseline activity at ED10,after six daily MPD injections and 3 washout days (see Table1),compared to ED1 baseline with 64% (142/221) of them exhibitingan increase in their neuronal activity. At ED10, 70% (217/310) of the VTA units responded significantly (p< 0.05) to MPD rechallenge by changing their firing compared to the acute MPD exposure at ED1and the majority of them, 65% (140/217), exhibited significant (p< 0.05) increases in their neuronal activity following MPD exposure at ED10 compared to the effect of MPD exposure at ED1.
Effect of 0.6 mg/kg MPD on all VTA neuronal units (Table 2(a))
The neuronal activity following 0.6 mg/kg MPD was recorded from81 VTA units in 28 animals. Only 38% (31/81) of the VTA units responded to acute 0.6 mg/kgMPD exposure and of those responding units, 55% (17/31) exhibited an increase in their firing rate. In addition, when comparing the baseline neuronal activity on ED10 to baseline activity at ED1, 51% (41/81) of the units exhibited a significant (p< 0.05) change in their firing rate, with 51% (21/51) exhibiting asignificant (p< 0.05) decrease in their firing rate. Upon MPD rechallenge at ED10 compared to the activity post MPD on ED1, 47% (38/81) of VTA units responded significantly (p< 0.05) different by changing their firing rate, with 66% (25/38) of them exhibiting an increase in firing rate.
VTA units recorded from animals that exhibited behavioral sensitization in response to chronic 0.6 mg/kg MPD(Table 2(b))
Twenty seven VTA units were recorded from 14 animals that exhibited behavioral sensitization to 0.6 mg/kg MPD. Only 33% (9/27) of the units responded to MPD administration on ED1 and on ED10 and of these responding VTA units, 78% responded with an increase in their neuronal activity (Table2(b)). When the baseline activity on ED10 was compared to ED1 baseline activity, 33% (9/27) of the units exhibited significant (p < 0.05) change in their firing rate and of these VTA units, 66% exhibited an increase in their neuronal activity at ED10, after six daily MPD injections and 3 washout days, compared to ED1 baseline activity (Table2(b)). Upon MPD rechallenge at ED10, 33% (9/27) of the VTA units responded with significant (p< 0.05) changes in their firing rate compared to the activity post MPD exposure on ED1 and of these responding units, 78% (7/9) of them exhibited further significantly (p< 0.05) increased firing rates (Table2(b)).
VTA units recorded from animals that exhibited behavioral tolerance in response to chronic 0.6 mg/kg MPD(Table 2(c))
Fifty four VTA units were recorded from 14 animals that exhibited behavioral tolerance. Following acute administration of MPD, 41% (22/54) of the VTA units responded significantly (p < 0.05) to the drug by changingtheir firing rate, with 55% (12/22) of these responding VTA units exhibiting a decreasein their firing rates.Comparing the baseline activity of ED10 after six daily MPD exposures and three washout days to that of ED1 shows that 59% (32/54) of the units changed their firing rate significantly (p< 0.05), with 56% (18/32) of those unitsexhibited an increase in their firing rates. Upon MPD rechallenge at ED10, 54% (29/54) of the VTA units responded with significant (p< 0.05) changes in their firing rate and from these responding units, 62% (18/29) of them exhibited significantly (p< 0.05) increased firing ratesfollowing MPD exposure on ED10 compared to
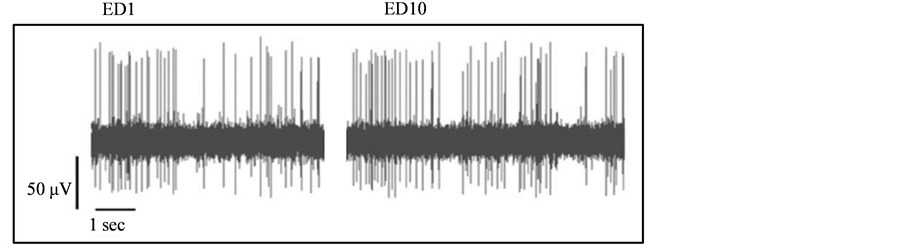
Figure 4. A representative analog of neuronal activity prior to spike sorting following saline administration at ED1 (left trace) and at ED10 (right trace).
Table 2summarizesthe VTA neuronal responses to 0.6 mg/kg methylphenidate (MPD). At (a), are all the units recorded following acute and chronic MPD (N= 81). ↑indicates significant (p< 0.05) increases in activity following the treatment. ↓ indicates significant (p< 0.05) decreases in activity following the treatment. ↔ indicates no change. BL-baseline activity; Rech-rechallenge. At (b), are the VTA units recorded from animals expressing behavioral sensitization. At (c), are the VTA units recorded from animals expressing behavioral tolerance.
that observed following MPD exposure at ED1 (Table2(c)).
Effect of 2.5 mg/kg MPD on all VTA neuronal units(Table 3(a))
The neuronal activity following 2.5 mg/kg MPD was recorded for 99 VTA units from 31 animals. Fifty-five percent (54/99) of these units responded to the acute administration of the drug by significantly (p< 0.05) changing their firing rates, 59% (31/54) of these responding VTA units responded with a significant (p< 0.05) increase in theirfiring activity. When comparing the ED10 baseline activity to the ED1 baseline activity, 64% (63/99) of the units exhibited significant (p< 0.05) changes in their activity, with 68% (40/63) of them exhibiting a significant (p< 0.05) increase in their ED10 baseline activity compared to ED1 baseline activity (Figure5).
In response to MPD rechallenge on ED10, 64% (63/99) of the units responded significantly (p< 0.05) to the drug, the majority of these responding units 68% (43/63) responded to MPD rechallenge with further significant increases in their neuronal activity (Figure6) (Table3(a)).
VTA units recorded from animals that exhibited behavioral sensitization in response to chronic 2.5 mg/kg MPD (Table 3(b))
Fifty nine VTA units were recorded from 22 animals that exhibited behavioral sensitization to 2.5 mg/kg MPD. In response to acute exposure of 2.5 mg/kg MPD, 64% (38/59) of the units responded to drug administration by significantly (p< 0.05) changing their firing rate and of these 38 responsive VTA units, 63% (24/38) responded to MPD with significant (p< 0.05) increases in their neuronal activity. When baseline activity on ED10 was compared to ED1 baseline activity, 80% (47/59) of the units exhibited a significant (p< 0.05) change in their baseline activity after the six daily MPD exposures and three washout days and of these 47 VTA units, 68% (32/47)exhibited an increase in their ED10 baseline neuronal activity compared to ED1 baseline activity. When given a rechallenge dose of 2.5 mg/kg MPD on ED10, 76% (45/59) of the units responded significantly (p< 0.05) to the drug compared to the activity post MPD exposure on ED1 and of the 45 responding VTA units, 71% (32/45) exhibited significant (p< 0.05) increases in their firing rates to MPD rechallenge (Table3(b)).
VTA units recorded from animals that exhibited behavioral tolerance in response to chronic 2.5 mg/kg MPD (Table 3(c))
Forty VTA units were recorded from 9 animals that exhibited behavioral tolerance. Following acute administration of MPD, only 40% (16/40) of the VTA units responded significantly to the drug with 56% (9/16) of these responding units exhibiting significant (p< 0.05) decreases in their firing rates. Comparing baseline activity on ED10 to that of ED1 baseline activity, 40% (16/40) of the units exhibited significant (p< 0.05) changes in their baseline firing rate after the six daily MPD exposures and three washout days, with half of them exhibiting decreases in their firing rates and the other half exhibiting an increase in their baseline firing rate(Table 3(c)). Upon MPD rechallenge at ED10, 45% (18/40) of the units responded with significant (p< 0.05)changes in their firing
 (a)
(a)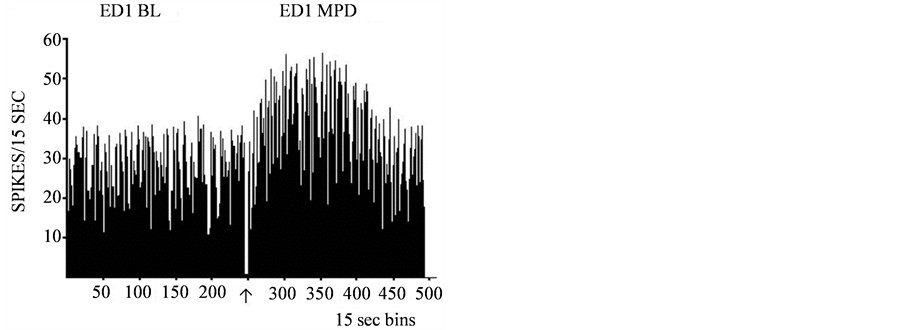 (b)
(b)
Figure 5.A representative histogram shows VTA neuronal activity post saline injection i.e. the baseline (BL) activity and the activity post-acute 10.0 mg/kg MPD administration. The drug was injected at 60 minutes post saline. In Part A, VTA neuronal activity following acute MPD exhibits a potentiation of neuronal activity. In contrast, Part B shows VTA neuronal activity units exhibiting attenuation following MPD administration.↑-indicates MPD injection.
 (a)
(a)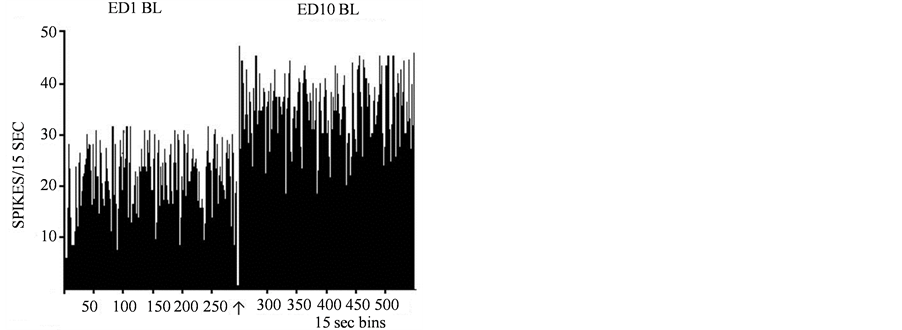 (b)
(b)
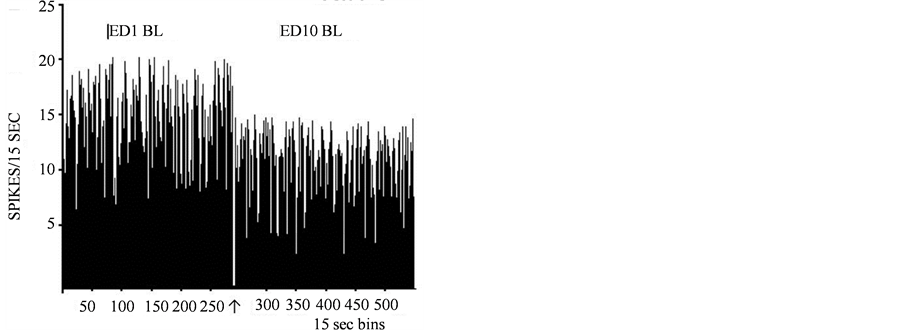
Figure 6.A representative histogram shows the baseline (BL) neuronal firing rates of adolescent VTA neurons on ED1 and the baseline activity of the same VTA unit at ED10 (BL10) after six daily MPD (2.5 mg/kg) exposure and three washout days. In Part A, the baseline activity (BL) is shown for ED1 and then again on ED10. This animal’s baseline activity was potentiated after the 6 days of MPD exposure and 3 washout days. In Part B, the baseline activity is shown for ED1 and again for ED10 expressing attenuation in their activity following 6 days of MPD exposure and 3 washout days.↑-indicates MPD injection.
ratescompared to the activity post MPD exposure on ED1 and of these responding VTA units, 61% (11/18) of them exhibited significantly (p< 0.05) increased firing rates following 2.5 mg/kg MPD at ED10 compared to MPD exposure at ED1 (Table3(c)).
Effect of 5.0 mg/kg MPD on all VTA neuronal units (Table 4(a))
The neuronal activity following 5.0 mg/kg MPD was recorded for 29 VTA units from 29 animals. The majority, 72% (21/29) of the recorded VTA units, responded to an acute administration of the drug by significantly (p< 0.05) changing their firing rates, with 86% (18/21) of them responding significantly (p< 0.05) by an increase in their neuronal activity. When comparing the ED10 baseline neuronal activity to ED1 baseline neuronal activity, the majority 83% (24/29) of the VTA units expressed significant (p< 0.05) changes in their baseline firing rate, with 83% (20/24) of the VTA units exhibiting a significant (p< 0.05) increase in their neuronal firingactivity. In response to rechallenge MPD at ED10, 86% (25/29) of the VTA units responded to MPD by significantly (p< 0.05) changing their firing rate compared to the effect elicited by the initial MPD exposure at ED1, 88% (22/25) of theseresponding VTA units exhibitedfurther significant (p< 0.05) increases in their neuronal activity to MPD rechallenge at ED10 (Table4(a)).
VTA units recorded from animals that exhibited behavioral sensitization in response to chronic 5.0 mg/kg MPD (Table 4(b))
Eighteen VTA units were recorded from 18animals that exhibited behavioral sensitization to repetitive 5.0 mg/kg MPD exposures. In response to acute exposure of MPD, the majority of the VTA units, 94% (17/18) responded to drug administration by significantly (p< 0.05) changing their firing rate and of these responding units, 94% (16/17) responded to MPD at ED1 with an increase in their neuronal activity. When baseline activity on ED10 was compared to ED1 baseline activity, 89% (16/18) of the units expressed significant (p< 0.05) changes and of these 16 units, 88% (14/16)of them exhibited a significant (p< 0.05) increase in their baselineactivity at ED10 compared to ED1 baseline neuronal activity. When given a rechallenge dose of 5.0 mg/kg MPDon ED10, 89% (16/18) of the units responded significantly (p< 0.05) to the drug compared to the activity after MPD exposure at ED1 and of these responding 16 VTA units, 94% (15/16) exhibited further significant (p< 0.05) increases in their firing rate compared to the initial MPD exposure at ED1 (Table4(b)).
VTA units recorded from animals that exhibited behavioral tolerance in response to chronic 5.0 mg/kg MPD (Table 4(c))
Table 3summarizes the VTA neuronal responses to 2.5 mg/kg methylphenidate (MPD). At (a), are all the units recorded following acute and chronic MPD (N = 99). ↑indicates significant (p< 0.05) increases in activity following the treatment. ↓ indicates significant (p< 0.05) decreases in activity following the treatment. ↔ indicates no change. BL-baseline activity; Rech-rechallenge. At (b), are the VTA units recorded from animals expressing behavioral sensitization. At (c), are the VTA units recorded from animals expressing behavioral tolerance.
Table 4summarizes the VTA neuronal responses to 5.0 mg/kg methylphenidate (MPD). At (a), are all the units recorded following acute and chronic MPD (N = 29). ↑indicates significant (p< 0.05) increases in activity following the treatment. ↓ indicates significant (p< 0.05) decreases in activity following the treatment. ↔ indicates no change. BL-baseline activity; Rech-rechallenge. At (b), are the VTA units recorded from animals expressing behavioral sensitization. At (c), are the VTA units recorded from animals expressing behavioral tolerance.
Eleven VTA units were recorded from 11 animals that exhibited behavioral tolerance. Following acute administration of MPD, only 36% (4/11) of the VTA units responded significantly (p< 0.05) to the drug and half of these responding VTA units exhibited significant (p< 0.05) increases in their firing rates while the other half exhibited significant (p < 0.05) decreases in their firing rates to MPD exposure. When comparing the baseline activity on ED10 of these VTA units to that of ED1 baseline activity, 73% (8/11) of these units exhibited significant (p< 0.05) changes in their firing rate, with 75% (6/8) of them exhibiting significant (p< 0.05) increases in their firing rates at ED10 compared to ED1 baseline activity. Upon MPD rechallenge at ED10, 82% (9/11) of the units responded with significant (p< 0.05) alterations in their firing rates and of these 9 responding VTA units, 78% (7/9) exhibited further significant (p< 0.05) increases in their firing ratescompared to the effect of MPD at ED1 (Table4(c)).
Effect of 10.0 mg/kg MPD on all VTA neuronal units (Table 5(a))
The neuronal activity following 10.0 mg/kg MPD was recorded from101 VTA unitsin 43 animals. The majority, 72% (73/101) of these VTA units following 10.0 mg/kg MPD exposure responded significantly (p< 0.05) by changing their firing rate, 91% (73/80) of the responding VTA units, exhibited a significant (p< 0.05) increase in their neuronal activity to MPD exposure (Figure5) When comparing the baseline neuronal activity of ED10 to the baseline activity of ED1, 92% (93/101) of these units exhibited significant (p< 0.05) changes in their ED10 neuronal firing rate, and 67% (62/93) of these units exhibited a significant (p< 0.05) increase in their neuronal activity (Figure6). When MPD rechallenge was given on ED10, 90% (91/101) of the VTA units responded by significantly (p< 0.05) changing their firing rate compared to the activity from acute MPD exposure at ED1, and of those responding units, 55% (50/91) of them exhibited a further significant (p< 0.05) increase in their activity compared to the initial effect of 10.0 mg/kg MPD at ED1 (Table5(a) and Figure7).
VTA units recorded from animals that exhibited behavioral sensitization in response to chronic 10.0 mg/kg MPD (Table 5(b))
Eighty one VTA units were recorded from 37 animals that exhibited behavioral sensitization. In response to acute exposure of MPD, the majority of these units, 83% (67/81) responded to the drug administration by significantly (p< 0.05) changing their firing rate and of these responding units, 97% (65/67) responded significantly (p< 0.05) with an increase in their neuronal activity. When the baseline activity on ED10 was compared to the ED1 baseline activity, 93% (75/81) of the VTA units exhibited significant (p< 0.05) changes in their firing rate at ED10 and of these 75 VTA units, 72% (54/75)exhibited significant (p< 0.05) increases in their neuronal activity at ED10 compared to ED1 baseline neuronal activity. When given a rechallenge dose of 10.0 mg/kg MPD on ED10, 91% (74/81) of the VTA units responded significantly (p< 0.05) to the drug by changing
 (a)
(a)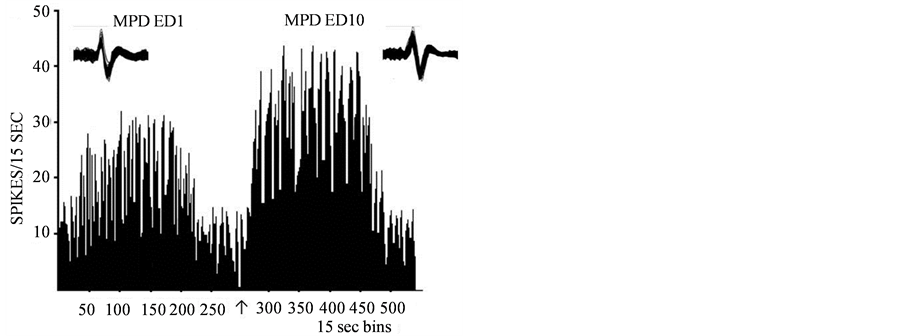 (b)
(b)
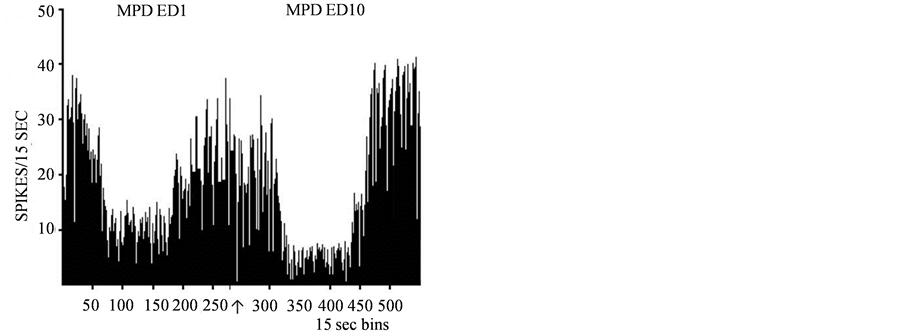
Figure 7. A representative histogram shows the neuronal activity post MPD exposure on ED1 and ED10. The left histogram shows a VTA unit that, 2.5 mg/kg MPD rechallenge exposure at ED10 compared to ED1 elicited further potentiation as a result of 6 days of daily MPD exposure, and 3 washout days. At the right is a VTA representative of units showing the neuronal activity post MPD on ED1 and again on ED10 where the neuronal activity is on ED10 attenuated following 6 days of MPD (2.5 mg/kg) exposure, followed by 3 washout days and MPD rechallenge compared to ED1 post MPD exposure. At the top is 20 superimposed analog neuronal spike activity, showing that the spike recorded post MPD on ED1 is similar to the spike post MPD rechallenge on ED10.
Table 5summarizes the VTA neuronal responses to 10.0 mg/kg methylphenidate (MPD). At (a), are all the units recorded following acute and chronic MPD (N = 101). ↑indicates significant (p< 0.05) increases in activity following the treatment. ↓ indicates significant (p< 0.05) decreases in activity following the treatment. ↔ indicates no change. BL-baseline activity; Rech-rechallenge. At (b), are the VTA units recorded from animals expressing behavioral sensitization. At (c), are the VTA units recorded from animals expressing behavioral tolerance.
their firing rate and of these responding 74 VTA units, 58% (43/74)exhibited further significant (p< 0.05) increases in their firing rate at ED10 when compared to the effect of MPD on ED1 (Table5(b)).
VTA units recorded from animals that exhibited behavioral tolerance in response to chronic 10.0 mg/kg MPD (Table 5(c))
Twenty VTA units were recorded from 6 animals that exhibited behavioral tolerance. Following acute administration of MPD, 65% (13/20) of these VTA units responded significantly (p< 0.05) to the drug by changing their firing rate with 62% (8/13) of these responding VTA units exhibiting significant (p< 0.05) increases in their firing rates following MPD exposure. Comparing baseline activity on ED10 to the baseline activity at ED1 reveals that90% (18/20) of the units changed their firing rate significantly (p< 0.05) after the six daily MPD exposures and three washout days, with 56% (10/18) of them exhibiting a significant (p< 0.05) decrease in their neuronal firing rates. Upon MPD rechallenge at ED10, 85% (17/20) of the units responded with significant (p< 0.05) changes in their firing rate and of these responding VTA units, 59% (10/17) of them exhibited further significant (p< 0.05) decreases in their firing rates compared to the effect elicited by the initial MPD exposure (Table5(c)).
Comparison between the VTA units population recorded from animals that exhibited behavioral sensitization to VTA units population recorded from animals exhibiting behavioral tolerance following 0.6 mg/kg administration
The natural log odds ratio statistical test shows that for 0.6 mg/kg the neuronal recordings obtained from animals expressing behavioral sensitization were more likely to show an increase in neuronal activity during initial (acute) MPD exposure than those animals expressing behavioral tolerance. Additionally, for both the baseline neuronal activity of ED10 compared to baseline neuronal activity recorded at ED1 and the neuronal activity recorded on ED10 following rechallenge with MPD compared to the neuronal activity on ED1 following MPD, the odds ratio revealed that both the behaviorally sensitized and behaviorally tolerant animals were about as likely to show increased neuronal activity.
Comparison between the VTA units population recorded from animals that exhibited behavioral sensitization to VTA units population recorded from animals exhibiting behavioral tolerance following 2.5 mg/kg administration
The natural log odds ratio statistical test shows that for 2.5 mg/kg the neuronal recordings obtained from animals expressing behavioral sensitization were more likely to show an increase in neuronal activity for all three comparisons, i.e. the initial (acute) MPD exposure, the baseline neuronal activity at ED10 compared to baseline activity at ED1 and the neuronal activity recorded at ED10 following MPD rechallenge compared to the neuronal activity on ED1 in response to the initial MPD exposure.
Comparison between the VTA units population recorded from animals that exhibited behavioral sensitization to VTA units population recorded from animals exhibiting behavioral tolerance following 5.0 mg/kg administration
The natural log odds ratio statistical test shows that for 5.0 mg/kg the neuronal recordings obtained from animals expressing behavioral sensitization were more likely to show an increase in neuronal activity for all three comparisons, i.e. the initial (acute) MPD exposure, the baseline neuronal activity at ED10 compared to baseline activity at ED1 and the neuronal activity recorded at ED10 following MPD rechallenge compared to the neuronal activity on ED1 in response to the initial MPD exposure.
Comparison between the VTA units population recorded from animals that exhibited behavioral sensitization to VTA units population recorded from animals exhibiting behavioral tolerance following 10.0 mg/kg administration
The natural log odds ratio statistical test shows that for 10.0 mg/kg the neuronal recordings obtained from animals expressing behavioral sensitization were more likely to show an increase in neuronal activity for all three comparisons, i.e. the initial (acute) MPD exposure, the baseline neuronal activity at ED10 compared to baseline activity at ED1 and the neuronal activity recorded at ED10 following MPD rechallenge compared to the neuronal activity on ED1 in response to the initial MPD exposure.
4. Discussion
The mode of MPD properties and how it acts in the VTA of adolescent rats among other brain areas is not fully understood.Therefore the current study was conducted to examine the dose response effects of MPD on VTA neuronal activity while simultaneously recording behavioral activity. The VTA is known to be an area important in many aspects of drug reward, reinforcement, as well as the CNS site where induction of behavioral sensitization occurs following the chronic use of psychostimulants[29] [52] .
Although there are no generally recognized dosage guidelines on blood levels to achieve optimal MPD dose treatment, a study by [53] reported that doses ingested by patients ranged from 0.06 to 29.3 mg/kg, with the majority being treated with 1.0 to 3.0 mg/kg MPD [3] [54] [55] . It is approximated that about 2 to 3 mg/kg of MPD in rodents achieved similar plasma levels to those achieved in clinical use[56] [57] . Thus in this study, the 0.6, 2.5, 5.0 and 10.0 mg/kg MPD doses were used as low, medium and high doses to best study the dose response characteristics of MPD on VTA neurons.
The main findings of this study are that acute MPD elicits a dose response increase in locomotor activity. Similarly, observations were repeated by [58] in adolescents and by [43] and [43] in adult rats.The same repetitive (chronic) MPD exposure of 0.6, 2.5, 5.0, or 10.0 mg/kg elicits either behavioral sensitization in some animals or behavioral tolerance in other animals which confirms our hypothesis that the same chronic MPD dose will elicit behavioral sensitization in some animals and behavioral tolerance in others. This dual observation is the rationale as to why we evaluate the VTA neuronal activity based on the animals’ behavioral response to chronic MPD.
The VTA neurons of adolescent rats responded to acute MPD exposure with a dose response characteristic, as the MPD dose was increased, more VTA units responded to the drug by changing their firing rate. The overall baseline activity at ED10 compared to the baseline neuronal activity at ED1 after six daily MPD exposures and three washout days showed dose response increases in the total number of units whose baseline was changed; i.e. with increasing the MPD dose from 0.6 to 10.0 mg/kg MPD, more VTA units expressed changes in their ED10 baseline activity compared to ED1 baseline. This change in ED10 baseline may be expressive of expectation to get the drug again or withdrawal expression from abrupt stopping of drug exposure[41] [59] [60] .In response to chronic administration of MPD at ED10, more units respondedby changing their firing rate compared to the initial MPD exposure and the ratio of how many VTA units responded to MPD by increasing or decreasing their firing rate was significant at ED10 compared to the responses observed at ED1 after MPD exposure.
Due to the different responses of the VTA neuronal activity following acute compared to chronic MPD administration, it is possible to classify that there are several types of responses; one type express neurophysiological sensitizationand the other type express neurophysiological tolerance. Those units that express both an increase in neuronal activity on ED1 following MPD exposure and a further increase in their neuronal activity on ED10 to MPD rechallenge and those VTA units that exhibit a decrease in neuronal activity to the initialMPD exposureon ED1 and a further decrease activity on ED10 to MPD rechallenge, are said to show neurophysiological sensitization. The units that did not respond significantly to MPD on ED1, but did respond significantly to MPD on ED10 can also be said to exhibit neurophysiological sensitization. Those VTA units that at ED1 responded to the drug by either increase or attenuation in their neuronal activity and at ED10 failed to respond to MPD rechallenge or those VTA units that show the opposite effects at ED1 compared to ED10 are said to show neurophysiological tolerance.
Since the same dose of MPD either 0.6, 2.5, 5.0, or 10.0 mg/kg elicits either behavioral sensitization or tolerance, the VTA neuronal recording from animals expressing behavioral sensitization to chronic MPD exposure were evaluated separately from the VTA units recorded from animals expressing behavioral tolerance. It was found that there were significant differences in response to MPD between these two groups of VTA neuronal populations. The VTA units recorded from behaviorally sensitized animals were much more likely to show an increase in firing response upon initial exposure to the drug. Conversely, the VTA units recorded from animals expressing behavioral tolerance were more likely to exhibit a decrease in the firing rate to acute MPD exposure.Similar results were observed with the chronic effect of the drug, with the exception of 0.6 mg/kg group which exhibited more increases in their firing activity in response to the drug from the behaviorally tolerant animals.
The VTA contains several distinctive neurons that have diverse receptor types that can respond in different ways to MPD exposure[29] . In morphological studies, it has been shown that about two-thirds of the neurons in the VTA are dopaminergic while the remaining neurons were GABAergic or glutamatergic. A number of the dopaminergic neurons co-express gamma-amino butyric acid (GABAergic) or glutamatergic receptors [61] [62] .The VTA neurons containing dopamine D1 or glutamate receptors, upon their activation by MPD exposure, will exhibit an increase in their neuronal activity. The VTA neurons contain DA D2 receptors or GABA receptors upon their activation by MPD exposure will exhibit a decrease in their neuronal firing activity. [63] noted that dendritically released dopamine in the VTA acts on DA D1 receptors located on the terminals of GABAergic and glutamatergic inputs originating in forebrain regions. The released glutamate and GABA into the VTA regulate the activity of dopaminergic and GABAergic output neurons[64] [65] , exemplifying the importance of DA and dendritic release. [28] reported thatlocal application of MPD in the prefrontal cortex (PFC) neurons activates DA D1 receptors that cause excitatory effects on glutamatergic pyramidal cells in the PFC. The PFC pyramidal neurons regulate the NMDA and AMPA receptors of the VTA dopaminergic neurons, and these VTA dopaminergic neurons feedbacks to the PFC and provide an excitatory input. Therefore, the activation of the PFC glutamate neurons by MPD will affect the activity in other remote CNS sites such as the VTA. In the same study, [28] reported that DA D1 receptor antagonist applied in the PFC before the administration of MPD, nearly extinguished the effects of low dose of 1 mg/kgMPDi.v. in anesthetized animals, while attenuating to a lesser degree a higher dose of MPD (3 mg/kg i.v.).Thiswas interpreted by him that MPD has actions on more than one neuron type in the PFC [28] .
The above study can provide a possible explanation to our finding for the higher response percentage of VTA units post higher doses of 5.0 and 10.0 mg/kg MPDi.p., as higher levels of drug can overcome any inhibitory actions caused by low doses of the drug. In addition, it is possible that the higher doses of MPD exposure affects more glutamatergic cells which cause the NMDA receptors to be more active, while low doses don’t interact with glutamate NMDA receptors and just mediate glutamate AMPA or dopamine D2 receptors. For those units that exhibit increases in their neuronal activity following MPD exposure, it is possible that the recording electrode was most likely from VTA units that contain DA D1 or glutamate receptors, while those recordings which exhibit decreases in neuronal activity could be recorded from VTA units that contain glutamate AMPA, GABA, or dopamine D2 receptors. When DAexposure is at an optimal level, usually within the treatment doses, DA actsmainly on the DA D1 receptors, while at higher MPD exposures, more DA D2 receptors are activated [10] [66] . It could be another possible interpretation in that the drug has dose sensitive characteristic effects on the different types of neurons for different dosage levels. Perhaps, with 0.6 and 2.5 mg/kg MPD, the drug mostly affects some but not all of the DA D1receptors, thus most of the unitsdid not respond with the lower MPD dose exposure by increasing their firing rates, while higher MPD doses activate more DA D1 receptors as well as the glutamate receptors which results in a higher response rate and those responding cells exhibiting an increase in firing rate.
There have been several studies reporting that psychostimulants can result in modulation of the neuropil components by either increasing or decreasing their density and the dendritic branching of NAc and PFC medium spiny neurons [67] -[70] . It is plausible that the animals which have increased neuropil components as a result of exposure to chronic psychostimulants would respond to a MPD rechallenge by exhibiting a further increase in neuronal firing rates compared to the initial drug exposure. Similarly, the animals whose neuropil was decreased in response to chronic psychostimulant exposures would respond to a rechallenge of psychostimulants with decreases in their firing rates.
Molecular studies[67] [71] [72] have shown similar observations to the current study using a dose response protocol with cocaine, morphine and amphetamine. They found that the same dose of chronic psychostimulant can elicit upregulation of CREB or ΔFosB and that an upregulation of CREB was correlated with psychostimulant exposure eliciting behavioral tolerance while upregulation of ΔFosB as a result of chronic psychostimulant exposure was correlated to behavioral sensitization. These studies have shown dual observations which may provide possible explanations as to why the same dose of MPD elicited in some VTA units excitation and in others attenuation as well as behavioral sensitization in some animals while causing behavioral tolerance in others. Therefore, the animals exhibiting behavioral tolerance, can be surmised that upregulation of CREB is partly responsible for such a response due to the compensatory regulation of DA D1 and D2 receptors. This in turn causes a decrease in the rewarding aspects of MPD and other psychostimulants[71] . [73] found that higher doses of MPD at 10.0 mg/kg and beyond result in hyperactivity in juvenile rats and impaired performance on attention tasks. Also, it has been reported that lower doses of MPD, 0.6 mg/kg, resulted in the opposite reaction, namely higher performance on attention tasks with no effect on behavioral activity [26] [73] . Additionally, when DA levels in the brain are too high and on the right side of the “inverted U” shape, the cAMP pathways are activated which can cause hyperactivity and over-stimulation [66] . It is possible that with the higher doses of 5.0 and 10.0 mg/kg MPD, that the excess extracellular DA has adverse effects on other biochemical pathways which in turn cause the changes observed in locomotion.
The odds ratio test was used to compare whether the effect of MPD on the VTA neuronal units recorded from animals expressing behavioral sensitization were different than those VTA units recorded from animals expressing behavioral tolerance to MPD exposure for each dose. It was found that the neuronal population recorded in the VTA from animals that express behavioral sensitization to repetitive MPD exposure did respond differently to MPD than those VTA units recorded in animals expressing behavioral tolerance. This shows the importance of evaluating the neuronal firing rates following psychostimulant exposure based off of the animal’s behavior in order to find any correlations between drug dose and firing rates with behavioral activity.
The interspike time interval (TI) of the neuronal units was examined. We attempted to use the TI histograms find whether MPD elicits bursting activity. No VTA unit exhibited bursting activity based on this analysis. After reviewing current literature, it has been stated that the bursting seen in VTA dopamine cells is most commonly observed following stimulation of the neuron rather than the spontaneous activity in the current experiment [74] . However the interspike histograms show the general effect of the drug on neuronal firing similar to the frequency histograms.
5. Conclusion
In conclusion, the present study examined the effects of MPD on adolescent VTA neuronal firing rates and behavioral activity of freely behaving non-anesthetized SD rats. The majority of VTAneurons did not respond to acute low and medium MPD dosage i.e. 0.6 and 2.5 mg/kg MPD, while higher MPD doses of 5.0 and 10.0 mg/kg elicited mainly an increase in neuronal firing rates in response to MPD. Additional studies will need to be done in order to further understand the effects of MPD on the VTA and other brain areas of adolescent rats and how they are similar and differ from adult rats. Knowledge of this will help those affected with ADHD to be better treated and will help to further comprehend the role that psychostimulants play in the brain.
Acknowledgements
This research was supported by NIH DA 027222 grant. The authors wish to thank Catherine Claussen and Dr. Bin Tang for their technical support. The author declares no conflicts of interest.
References
- Lee,S.H., Seo,W.S., Sung,H.M., Choi,T.Y., Kim,S.Y., Choi,S.J., Koo,B.H. and Lee,J.H.(2012) Effect of Methylphenidate on Sleep Parameters in Children with ADHD. Psychiatry Investigation,9, 384-390. http://dx.doi.org/10.4306/pi.2012.9.4.384
- Shenker,A. (1992) The Mechanism of Action of Drugs Used to Treat Attention-Deficit Hyperactivity Disorder: Focus on Catecholamine Receptor Pharmacology. Advances in Pediatrics,39, 337-382.
- Solanto,M.V. (1998) Neuropsychopharmacological Mechanisms of Stimulant Drug Action in Attention-Deficit Hyperactivity Disorder: A Review and Integration. Behavioural Brain Research,94, 127-152. http://dx.doi.org/10.1016/S0166-4328(97)00175-7
- Newcorn,J.H. (2000) A Glimpse into Key Issues in ADHD.CNS Spectrums, 5, 25.
- Froehlich,T.E., Lanphear,B.P., Epstein,J.N., Barbaresi,W.J., Katusic,S.K. and Kahn,R.S. (2007) Prevalence, Recognition, and Treatment of Attention-Deficit/Hyperactivity Disorder in a National Sample of US Children. Archives of Pediatrics and Adolescent Medicine,161, 857-864.http://dx.doi.org/10.1001/archpedi.161.9.857
- Polanczyk,G. and Rohde,L.A. (2007) Epidemiology of Attention-Deficit/Hyperactivity Disorder across the Lifespan. Current Opinion in Psychiatry,20, 386-392.http://dx.doi.org/10.1097/YCO.0b013e3281568d7a
- Wilens,T.E., Biederman,J. and Spencer,T.J. (2002) Attention Deficit/Hyperactivity Disorder across the Lifespan. Annual Review of Medicine,53, 113-131.http://dx.doi.org/10.1146/annurev.med.53.082901.103945
- Challman,T.D. and Lipsky,J.J. (2000) Methylphenidate: Its Pharmacology and Uses. Mayo Clinic Proceedings,75, 711-721.
- Swanson,J.M., Cantwell,D., Lerner,M., McBurnett,K. and Hanna,G. (1991) Effects of Stimulant Medication on Learning in Children with ADHD. Journal of Learning Disabilities,24, 219-230. http://dx.doi.org/10.1177/002221949102400406
- Arnsten,A.F. and Dudley,A.G. (2005) Methylphenidate Improves Prefrontal Cortical Cognitive Function through Alpha2Adrenoceptor and Dopamine D1 Receptor Actions: Relevance to Therapeutic Effects in Attention Deficit Hyperactivity Disorder.Behavioral and Brain Functions, 1, 2.http://dx.doi.org/10.1186/1744-9081-1-2
- Goldman,L.S., Genel,M., Bezman,R.J. and Slanetz,P.J. (1998) Diagnosis and Treatment of Attention-Deficit/Hyperactivity Disorder in Children and Adolescents. Council on Scientific Affairs, American Medical Association.The Journal of the American Medical Association,279, 1100-1107.http://dx.doi.org/10.1001/jama.279.14.1100
- Arria,A.M. and Wish,E.D. (2006) Nonmedical Use of Prescription Stimulants among Students. Pediatric Annals,35, 565-571.
- Imbert,B., Cohen,J. and Simon,N. (2013) Intravenous Abuse of Methylphenidate. Journal of Clinical Psychopharmacology,33, 720-721.http://dx.doi.org/10.1097/JCP.0b013e31829839a4
- Kallman,W.M. and Isaac,W. (1975) The Effects of Age and Illumination on the Dose-Response Curves for Three Stimulants.Psychopharmacologia,40, 313-318.http://dx.doi.org/10.1007/BF00421469
- Patrick,K.S. and Markowitz,J.S. (1997) Pharmacology of Methylphenidate, Amphetamine Enantiomers and Pemoline in Attention-Deficit Hyperactivity Disorder.Human Psychopharmacology: Clinical and Experimental,12, 527-546. http://dx.doi.org/10.1002/(SICI)1099-1077(199711/12)12:6<527::AID-HUP932>3.0.CO,2-U
- Lakhan,S.E. and Kirchgessner,A. (2012) Prescription Stimulants in Individuals with and without Attention Deficit Hyperactivity Disorder: Misuse, Cognitive Impact, and Adverse Effects. Brain and Behavior,2, 661-677.
- Kallman,W.M. and Isaac,W. (1975) The Effects of Age and Illumination on the Dose-Response Curves for Three Stimulants.Psychopharmacologia, 40, 313-318.http://dx.doi.org/10.1007/BF00421469
- Andersen,S.L. and Teicher,M.H. (2000) Sex Differences in Dopamine Receptors and Their Relevance to ADHD. Neuroscience & Biobehavioral Reviews, 24, 137-141.http://dx.doi.org/10.1016/S0149-7634(99)00044-5
- Brenhouse,H.C. and Andersen,S.L. (2011) Developmental Trajectories during Adolescence in Males and Females: A Cross-Species Understanding of Underlying Brain Changes.Neuroscience & Biobehavioral Reviews,35, 1687-1703. http://dx.doi.org/10.1016/j.neubiorev.2011.04.013
- Huttenlocher, P.R. (1974) Dendritic Development in Neocortex of Children with Mental Defect and Infantile Spams. Neurology,24, 203-210. http://dx.doi.org/10.1212/WNL.24.3.203
- Rakic,P., Bourgeois,J.P., Eckenhoff,M.F., Zecevic,N. and Goldman-Rakic,P.S. (1986) Concurrent Overproduction of Synapses in Diverse Regions of the Primate Cerebral Cortex. Science,232, 232-235. http://dx.doi.org/10.1126/science.3952506
- Brandon,C.L., Marinelli,M. and White,F.J. (2003) Adolescent Exposure to Methylphenidate Alters the Activity of Rat Midbrain Dopamine Neurons.Biological Psychiatry,54, 1338-1344. http://dx.doi.org/10.1016/S0006-3223(03)00787-X
- Canese, R., Adriani, W., Marco, E.M., De Pasquale, F., Lorenzini, P., De Luca, N., Fabi, F., Podo, F. and Laviola, G. (2009) Peculiar Response to Methylphenidate in Adolescent Compared to Adult Rats: A phMRI Study.Psychopharmacology,203, 143-153.http://dx.doi.org/10.1007/s00213-008-1379-1
- Dafny,N. and Yang,P.B. (2006) The Role of Age, Genotype, Sex, and Route of Acute and Chronic Administration of Methylphenidate: A Review of Its Locomotor Effects. Brain Research Bulletin,68, 393-405. http://dx.doi.org/10.1016/j.brainresbull.2005.10.005
- Yang,P.B., Atkins,K.D. and Dafny,N. (2011) Behavioral Sensitization and Cross-Sensitization between Methylphenidate Amphetamine, and 3,4-Methylenedioxymethamphetamine (MDMA) in Female SD Rats. European Journal of Pharmacology,661, 72-85.http://dx.doi.org/10.1016/j.ejphar.2011.04.035
- Kuczenski,R. and Segal,D.S. (2001) Locomotor Effects of Acute and Repeated Threshold Doses of Amphetamine and Methylphenidate: Relative Roles of Dopamine and Norepinephrine. Journal of Pharmacology and Experimental Therapeutics,296, 876-883.
- Walker,Q.D., Morris,S.E., Arrant,A.E., Nagel,J.M., Parylak,S., Zhou,G., Caster,J.M. and Kuhn,C.M. (2010) Dopamine Uptake Inhibitors but Not Dopamine Releasers Induce Greater Increases in Motor Behavior and Extracellular Dopamine in Adolescent Rats than in Adult Male Rats. Journal of Pharmacology and Experimental Therapeutics,335, 124-132.http://dx.doi.org/10.1124/jpet.110.167320
- Gronier,B. (2011) In Vivo Electrophysiological Effects of Methylphenidate in the Prefrontal Cortex: Involvement of Dopamine D1 and Alpha 2 Adrenergic Receptors. European Neuropsychopharmacology, 21, 192-204. http://dx.doi.org/10.1016/j.euroneuro.2010.11.002
- Kauer,J.A. (2004) Learning Mechanisms in Addiction: Synaptic Plasticity in the Ventral Tegmental Area as a Result of Exposure to Drugs of Abuse. Annual Review of Physiology, 66, 447-475. http://dx.doi.org/10.1146/annurev.physiol.66.032102.112534
- Koob,G.F. (1992) Drugs of Abuse: Anatomy, Pharmacology and Function of Reward Pathways. Trends in Pharmacological Sciences,13, 177-184.http://dx.doi.org/10.1016/0165-6147(92)90060-J
- Nestler,E.J. (1992) Molecular Mechanisms of Drug Addiction. The Journal of Neuroscience,12, 2439-2450.
- Wise,R.A. (1996) Addictive Drugs and Brain Stimulation Reward. Annual Review of Neuroscience,19, 319-340. http://dx.doi.org/10.1146/annurev.ne.19.030196.001535
- Tang,B. and Dafny,N. (2013) Behavioral and Dorsal Raphe Neuronal Activity Following Acute and Chronic Methylphenidate in Freely Behaving Rats. Brain Research Bulletin,98, 53-63. http://dx.doi.org/10.1016/j.brainresbull.2013.06.004
- Sherwood, N. and Timiras, P.S. (1970) A Stereotaxic Atlas of the Developing Rat Brain.
- Chong,S.L., Claussen,C.M. and Dafny,N. (2012) Nucleus Accumbens Neuronal Activity in Freely Behaving Rats Is Modulated Following Acute and Chronic Methylphenidate Administration. Brain Research Bulletin,87, 445-456. http://dx.doi.org/10.1016/j.brainresbull.2012.01.004
- Claussen,C.M. and Dafny,N. (2012) Acute and Chronic Methylphenidate Modulates the Neuronal Activity of the Caudate Nucleus Recorded from Freely Behaving Rats. Brain Research Bulletin,87, 387-396. http://dx.doi.org/10.1016/j.brainresbull.2011.10.008
- Dafny,N. (1980) Multiunit Recording from Medial Basal Hypothalamus Following Acute and Chronic Morphine Treatment. Brain Research,190, 584-592.http://dx.doi.org/10.1016/0006-8993(80)90304-2
- Dafny,N. (1982) The Hypothalamus Exhibits Electrophysiologic Evidence for Morphine Tolerance and Dependence. Experimental Neurology,77, 66-77.http://dx.doi.org/10.1016/0014-4886(82)90143-1
- Dafny,N. and Terkel,J. (1990) Hypothalamic Neuronal Activity Associated with Onset of Pseudopregnancy in the Rat. Neuroendocrinology,51, 459-467.http://dx.doi.org/10.1159/000125375
- Salek,R.L., Claussen,C.M., Perez,A. and Dafny,N. (2012) Acute and Chronic Methylphenidate Alters Prefrontal Cortex Neuronal Activity Recorded from Freely Behaving Rats. European Journal of Pharmacology, 679, 60-67. http://dx.doi.org/10.1016/j.ejphar.2012.01.009
- Algahim,M.F., Yang,P.B., Wilcox,V.T., Burau,K.D., Swann,A.C. and Dafny,N. (2009) Prolonged Methylphenidate Treatment Alters the Behavioral Diurnal Activity Pattern of Adult Male Sprague-Dawley Rats. Pharmacology Biochemistry and Behavior,92, 93-99.http://dx.doi.org/10.1016/j.pbb.2008.10.021
- Gaytan,O., Ghelani,D., Martin,S., Swann,A. and Dafny,N. (1996) Dose Response Characteristics of Methylphenidate on Different Indices of Rats’ Locomotor Activity at the Beginning of the Dark Cycle. Brain Research,727, 13-21. http://dx.doi.org/10.1016/0006-8993(96)00296-X
- Gaytan,O., Yang,P., Swann,A. and Dafny,N. (2000) Diurnal Differences in Sensitization to Methylphenidate. Brain Research,864, 24-39.http://dx.doi.org/10.1016/S0006-8993(00)02117-X
- Lee,M.J., Yang,P.B., Wilcox,V.T., Burau,K.D., Swann,A.C. and Dafny,N. (2009) Does Repetitive Ritalin Injection Produce Long-Term Effects on SD Female Adolescent Rats? Neuropharmacology,57, 201-207. http://dx.doi.org/10.1016/j.neuropharm.2009.06.008
- Podet,A., Lee,M.J., Swann,A.C. and Dafny,N. (2010) Nucleus Accumbens Lesions Modulate the Effects of Methylphenidate. Brain Research Bulletin,82, 293-301.http://dx.doi.org/10.1016/j.brainresbull.2010.05.006
- Yang,P.B., Amini,B., Swann,A.C. and Dafny,N. (2003) Strain Differences in the Behavioral Responses of Male Rats to Chronically Administered Methylphenidate. Brain Research,971, 139-152. http://dx.doi.org/10.1016/S0006-8993(02)04240-3
- Yang,P.B., Swann,A.C. and Dafny,N. (2006) Sensory-Evoked Potentials Recordings from the Ventral Tegmental Area, Nucleus Accumbens, Prefrontal Cortex, and Caudate Nucleus and Locomotor Activity Are Modulated in Dose-Response Characteristics by Methylphenidate. Brain Research,1073-1074, 164-174. http://dx.doi.org/10.1016/j.brainres.2005.12.055
- Yang,P.B., Swann,A.C. and Dafny,N. (2006) Chronic Methylphenidate Modulates Locomotor Activity and Sensory Evoked Responses in the VTA and NAc of Freely Behaving Rats. Neuropharmacology,51, 546-556. http://dx.doi.org/10.1016/j.neuropharm.2006.04.014
- Yang,P.B., Swann,A.C. and Dafny,N. (2006) Dose-Response Characteristics of Methylphenidate on Locomotor Behavior and on Sensory Evoked Potentials Recorded from the VTA, NAc, and PFC in Freely Behaving Rats. Behavioral and Brain Functions, 2, 3.http://dx.doi.org/10.1186/1744-9081-2-3
- Yang,P.B., Swann,A.C. and Dafny,N. (2006) Acute and Chronic Methylphenidate Dose-Response Assessment on Three Adolescent Male Rat Strains. Brain Research Bulletin,71, 301-310. http://dx.doi.org/10.1016/j.brainresbull.2006.09.019
- Yang,P.B., Swann,A.C. and Dafny,N. (2007) Chronic Administration of Methylphenidate Produces Neurophysiological and Behavioral Sensitization. Brain Research, 1145, 66-80.http://dx.doi.org/10.1016/j.brainres.2007.01.108
- Kalivas,P.W. and Stewart,J. (1991) Dopamine Transmission in the Initiation and Expression of Drugand Stress-Induced Sensitization of Motor Activity. Brain Research Reviews,16, 223-244. http://dx.doi.org/10.1016/0165-0173(91)90007-U
- White,S.R. and Yadao,C.M. (2000) Characterization of Methylphenidate Exposures Reported to a Regional Poison Control Center.Archives of Pediatrics and Adolescent Medicine, 154, 1199-1203.
- Crutchley,A. and Temlett,J.A. (1999) Methylphenidate (Ritalin) Use and Abuse. South African Medical Journal,89, 1076-1079.
- Eichlseder,W. (1985) Ten Years of Experience with 1,000 Hyperactive Children in a Private Practice. Pediatrics,76, 176-184.
- Gatley,S.J., Volkow,N.D., Gifford,A.N., Fowler,J.S., Dewey,S.L., Ding,Y.S. and Logan,J. (1999) Dopamine-Transporter Occupancy after Intravenous Doses of Cocaine and Methylphenidate in Mice and Humans. Psychopharmacology,146, 93-100.http://dx.doi.org/10.1007/s002130051093
- Gerasimov,M.R., Franceschi,M., Volkow,N.D., Gifford,A., Gatley,S.J., Marsteller,D., Molina,P.E. and Dewey,S.L. (2000) Comparison between Intraperitoneal and Oral Methylphenidate Administration: A Microdialysis and Locomotor Activity Study. Journal of Pharmacology and Experimental Therapeutics, 295, 51-57.
- Chelaru,M.I., Yang,P.B. and Dafny,N. (2012) Sex Differences in the Behavioral Response to Methylphenidate in Three Adolescent Rat Strains (WKY, SHR, SD). Behavioural Brain Research,226, 8-17. http://dx.doi.org/10.1016/j.bbr.2011.08.027
- Bergheim,M., Yang,P.B., Burau,K.D. and Dafny,N. (2012) Adolescent Rat Circadian Activity Is Modulated by Psychostimulants. Brain Research,1431, 35-45.http://dx.doi.org/10.1016/j.brainres.2011.10.027
- Lee,S.S., Humphreys,K.L., Flory,K., Liu,R. and Glass,K. (2011) Prospective Association of Childhood Attention-Deficit/Hyperactivity Disorder (ADHD) and Substance Use and Abuse/Dependence: A Meta-Analytic Review. Clinical Psychology Review,31, 328-341.http://dx.doi.org/10.1016/j.cpr.2011.01.006
- Nair-Roberts,R.G., Chatelain-Badie,S.D., Benson,E., White-Cooper,H., Bolam,J.P. and Ungless,M.A. (2008) Stereological Estimates of Dopaminergic, GABAergic and Glutamatergic Neurons in the Ventral Tegmental Area, Substantianigra and Retrorubral Field in the Rat. Neuroscience,152, 1024-1031. http://dx.doi.org/10.1016/j.neuroscience.2008.01.046
- Olson,V.G. and Nestler,E.J. (2007) Topographical Organization of GABAergic Neurons within the Ventral Tegmental Area of the Rat. Synapse,61, 87-95.http://dx.doi.org/10.1002/syn.20345
- Ranaldi,R. and Wise,R.A. (2001) Blockade of D1 Dopamine Receptors in the Ventral Tegmental Area Decreases Cocaine Reward: Possible Role for Dendritically Released Dopamine. The Journal of Neuroscience,21, 5841-5846.
- Albin,R.L., Makowiec,R.L., Hollingsworth,Z.R., Dure,L.S., Penney,J.B. and Young,A.B. (1992) Excitatory Amino Acid Binding Sites in the Basal Ganglia of the Rat: A Quantitative Autoradiographic Study. Neuroscience,46, 35-48. http://dx.doi.org/10.1016/0306-4522(92)90006-N
- Kalivas,P.W. (1993) Neurotransmitter Regulation of Dopamine Neurons in the Ventral Tegmental Area. Brain Research Reviews, 18, 75-113.http://dx.doi.org/10.1016/0165-0173(93)90008-N
- Urban,K.R. andGao,W.J. (2013) Methylphenidate and the Juvenile Brain: Enhancement of Attention at the Expense of Cortical Plasticity? Medical Hypotheses,81, 988-994.http://dx.doi.org/10.1016/j.mehy.2013.09.009
- Kim, Y., Teylan, M.A., Baron, M., Sands, A., Nairn, A.C. and Greengard, P. (2009) Methylphenidate-Induced Dendritic Spine Formation and DeltaFosB Expression in Nucleus Accumbens. Proceedings of the National Academy of Sciences,106, 2915-2920.http://dx.doi.org/10.1073/pnas.0813179106
- Nestler,E.J. (2008) Review. Transcriptional Mechanisms of Addiction: Role of DeltaFosB.Philosophical Transactions of the Royal Society B: Biological Sciences,363, 3245-3255.http://dx.doi.org/10.1098/rstb.2008.0067
- Robinson,T.E. and Kolb,B. (1997) Persistent Structural Modifications in Nucleus Accumbens and Prefrontal Cortex Neurons Produced by Previous Experience with Amphetamine. The Journal of Neuroscience,17, 8491-8497.
- Robinson,T.E. and Kolb,B. (1999) Alterations in the Morphology of Dendrites and Dendritic Spines in the Nucleus Accumbens and Prefrontal Cortex Following Repeated Treatment with Amphetamine or Cocaine. European Journal of Neuroscience,11, 1598-1604.http://dx.doi.org/10.1046/j.1460-9568.1999.00576.x
- Chao,J. and Nestler,E.J. (2004) Molecular Neurobiology of Drug Addiction.Annual Review of Medicine,55, 113-132. http://dx.doi.org/10.1146/annurev.med.55.091902.103730
- Nestler,E.J. (2004) Molecular Mechanisms of Drug Addiction. Neuropharmacology,47, 24-32. http://dx.doi.org/10.1016/j.neuropharm.2004.06.031
- Gray,J.D., Punsoni,M., Tabori,N.E., Melton,J.T., Fanslow,V., Ward,M.J., Zupan,B., Menzer,D., Rice,J., Drake,C.T., Romeo,R.D., Brake,W.G., Torres-Reveron,A. and Milner,T.A. (2007) Methylphenidate Administration to Juvenile Rats Alters Brain Areas Involved in Cognition, Motivated Behaviors, Appetite, and Stress. The Journal of Neuroscience,27, 7196-7207.http://dx.doi.org/10.1523/JNEUROSCI.0109-07.2007
NOTES

*Corresponding author.