Journal of Transportation Technologies
Vol.07 No.02(2017), Article ID:75364,16 pages
10.4236/jtts.2017.72008
Identifying Existing Bus Service Condition and Analyzing Customer Satisfaction of Bus Service in Dhaka City
Farzana Rahman1, Tanay Datta Chowdhury2, Tanvir Haque3, Rezwanur Rahman3, Aminul Islam3
1Department of Civil Engineering, University of Asia Pacific, Dhaka, Bangladesh
2Department of Civil Engineering, Leading University, Sylhet, Bangladesh
3Military Institute of Science and Technology, Dhaka, Bangladesh

Copyright © 2017 by author and Scientific Research Publishing Inc.
This work is licensed under the Creative Commons Attribution International License (CC BY 4.0).
http://creativecommons.org/licenses/by/4.0/


Received: March 7, 2016; Accepted: April 9, 2017; Published: April 12, 2017
ABSTRACT
Bus systems provide a versatile form of public transportation with the flexibility to serve a variety of access needs throughout an urban area. Efficient operation of the public transport is a key factor for the improvement of living condition in Dhaka city. Transport service performance should be assessed from the passengers’ perspectives to evaluate these perceptions in transportation planning. The exploration of service quality of bus is essential in order to provide a better service in future. The objective of this research is to access overall customer satisfaction in public bus transport of Dhaka city. A questionnaire survey was conducted in five locations in Dhaka city. Bus users’ satisfaction was analyzed by discrete choice logit model towards quality, reliability, safety and security and service provided by buses functioning in Dhaka city. The result indicated that more than half of the respondents believed that the present condition of bus service is not satisfactory. In case of the quality of buses, people think that the body and sitting arrangement of the buses are uncomfortable. Regarding the safety and security condition, main three reasons of dissatisfaction of passengers’ are unsafe driving practices, poor boarding and alighting facilities and lack of law enforcing agencies surveillance. Reasons which make the service unsatisfactory include irregular service provided by buses, regular overcrowding, lack of good standard buses and lack of cleanliness. In spite of these negative views, users’ possessed a positive attitude for buses which is the low travel cost.
Keywords:
Service Quality, Customer Satisfaction, Quality of Buses, Dissatisfaction

1. Introduction
Efficient operation of the public transport is a key factor for the improvement of living condition in a city. Bus systems provide a versatile form of public transportation with the flexibility to serve a variety of access needs throughout an urban area. Transport service performance should be assessed from the passengers’ perspectives hence it is essential to determine passengers’ views of service provided. The characteristics of public transport in Dhaka City are portrayed by traffic congestion and overcrowding, inadequate traffic management, high accident rates and increasing air pollution problems. The service of public transportation in Dhaka is extremely poor and can hardly meet the user’s needs. Public transport plays a crucial role in the overall success of a city’s transportation system. Transport is important for the survival of the modern society [1] . An effective and efficient system of transport can significantly contribute to human development in a wider perspective. It sustains mobility of those classes who can’t afford private vehicle, helps in creating and maintaining livable communities with high density land use, relieves congestion, assures long term sustainability in terms of shared resource consumption and being responsive to the environment. Despite the vital role that buses play in any urban areas, their services are frequently insufficient to meet demand and the services that are provided mostly suffer from low output [1] . In many parts of the world, individuals tend to use their private vehicles due to lack of satisfaction they obtain from the services of public transport. For instance, the findings of Cullinane [2] in an attitudinal survey in UK showed that 41% of private car users would reduce their car usage if public transport became frequently available and reliable. Attitudinal survey based on sampled university students in Hong Kong by Cullinane [3] found that good public transport can discourage car ownership 65% as the respondents in the survey stating their unlikelihood of buying a car in the next five years. Improvement in transport system can have a positive effect on land development [4] . Deng and Nelson further described that high quality of public transport system can greatly improve the accessibility of its catchment area by shortening time. Ebuli and Mazzula also commented that an improvement in the supplied service quality can attract further users [5] . Randheer et al. argued that, in the current scenario of globalization, public transport service needs introspective sensitivity towards the quality of service offered [6] . A modern transport system which provides high quality of services has been a contemporary issue in transport modeling literature [1] [3] [5] [6] [7] .
Dhaka, the capital of Bangladesh is one of the least motorized mega cities in the world but most densely populated with a current population of almost 15 million at annual growth rate of 8% per annum [8] . Bus is the main mode of transportation for the middle and lower income group in the city. This is perhaps the only city of its size without a well-organized, properly scheduled bus system or any type of mass rapid transit system. For such a large city and huge travel demand, mass transit is a pre-requisite for its transportation system. Present contribution of mass transit is only 31% of the passenger trips whereas mass transit should share 80% of the total trips to provide an efficient transportation system [8] . Trends showed that growth rate for the low occupancy travel modes such as cars and cycle rickshaws, were much higher than that of high occupancy travel modes such as buses and mini buses. At present, passenger transport scenario of metropolitan Dhaka shows that the existing bus service is not sufficient to keep pace with the growing demand. Again, a well-planned city should have 25% of total area for its road network where as in Dhaka; only 9% of total area is occupied by road [9] . Perhaps Dhaka could cope with such a need of road infrastructure if there were other options for example a mass transit system as well as an organized bus system [10] . While other Asian cities have high rail usage amongst their public transport options, Dhaka’s is negligible, and without a rail system to supplement the volume on the roads, travelers going longer distances must board the wide array of privately owned buses that operate on the city streets [11] .
Buses in Dhaka city are operated both by private and public sectors. The private sector is dominating and provides a monopoly service (95% of total bus services) compared to public sector operation [12] . The roads of the city are clogged with vehicles all day long making travel intolerable. Different shapes and sizes of vehicles are part of the traffic stream as rickshaws, auto-rickshaws, tempos, taxis, private cars, pedal cycles and a wide range of buses. Day by day the situation is worsening as the number of people intention to acquire private vehicle is increasing in this city.
Bus behavior in Dhaka varies significantly depending on the way drivers and conductors operate them. Skipping of stoppages, cutting routes short and waiting for very long periods at the curb make travelers annoyed which in turn a reasons that passengers avoid riding buses [13] . A common complaint from bus riders in Dhaka include long waits for buses, unexpected delays while the bus is moving, lack of comfort, and long walks from origins and destinations to the bus stops [14] . BRTC (Bangladesh Road Transport Corporation) has launched various types of buses in the routes of Dhaka time to time to improve the quality of the bus service. The BRTC plying three types of buses in Dhaka city; they comprise single decker bus (both AC and Non AC), double decker and articulated Bus. BRTC operated single buses are mostly of ticket based service. Both AC and non AC BRTC buses are plying on the different routes of Dhaka City. Every bus has designated stoppage and ticket counter. These services are mainly plying within the city territory and greater city areas in Dhaka, according to the BRTC web site (www.brtc.gov.bd). Despite several efforts taken by BRTC to improve the bus service of Dhaka city; due to irregularity, corruption, and mismanagement this state run Transport Company could not attain specified goals. It is often been found that all the BRTC bus services remain in good condition up to a year or so after the inauguration and slowly loses their attractiveness due to poor maintenance and operation.
Public transport has the potential to transport more people than individual cars for a given amount of road space (in the case of on-street systems such as buses and trams) or without consuming any road space at all (in the case of off-road systems such as metros and surface rail systems). To make the quality of services provided by bus operators more attractive, safe, conducive and affordable to the general public, and thereby reducing the number of individual private cars on the road the present study seeks to assess the existing bus service condition and to analyze customer satisfaction with the services provided by public bus transport operators in Dhaka. The findings may provide useful information to policy makers for the development of actionable plan to improve the quality of services provided so as to retain customers and avoid operation losses by public transport operators.
2. Literature Review
The transportation system of Dhaka city is predominantly road based. The majority of trips in Dhaka are served on public transport and non-motorized transport modes (NMT) or Para-transits as a significant number of people are poor who cannot afford personal vehicle. As the fare of NMT (such as rickshaws) or other Para-transits are more expensive than the bus fares [15] most of the people are heavily dependent on public transport for their travel [16] . The STP stated that the modal share of trips on public transport in Dhaka is about 44% [17] . Bus services are playing the dominant role in providing public transport facilities of the city. Although the bus provides highest passenger-travel, the modal share of bus in terms of person-trips is comparatively low; hence there is a considerable scope of improvement of modal share of bus by improving bus service in Dhaka city. However, the number of passengers in public transport has been increasing continuously during the last 20 years [18] . On the other hand, various researches [18] [19] [20] claimed that the present bus services are inefficient, unproductive, and unsafe due to long waiting time, delay on plying, long boarding time, overloading, discomfort, long walking distance from the residence/work place to bus stoppages, and so on. Manually controlled signals without having proper automated systems and increasing road congestion affecting buses even more than cars.
The LOS concept, as a tool for evaluating service quality, had been earlier used successfully in context of highways; researchers later extended it to other areas of transportation, including transit systems. Botzow first applied the LOS concept to assess quality of public transit system [21] . The level of service qualitatively measures the effect of factors such as travel time, speed, cost, which in combination with other factors, determine the type of service that any given facility provides to the user under the stated conditions [22] . There are the three major groups of factors [23] :
・ Performance elements affecting users (i.e. operating speed, reliability, safety);
・ Service quality (i.e. convenience and simplicity of use, aesthetics, cleanliness, behavior);
・ Price or the fare rate that the user pays for the service.
On the other hand, Tyrinopoulos and Antoniou found that transfer quality and quality service are the top priority in bus services for the customers in Athens [24] . According to them, the key satisfaction indicators were the service frequency, transfer distance, ticketing system, and vehicle cleanliness. Most of the studies on service level of bus or public transport dealt with operational performance indicators rather than exploring the passenger’s opinion about the quality of ride [25] .
In recent times all organization has increasingly come to understand the importance of customer satisfaction. Service quality is defined as a comparison between customer expectation and perception of service [26] [27] . Service quality in general consists of five distinct dimensions: tangibles (physical facilities, equipment, and appearance of personnel), reliability (ability to perform the promised service dependably and accurately), responsiveness (willingness to help customer and provide prompt service), assurance (knowledge and courtesy of employees and their ability to inspire trust and confidence), and empathy (caring, individualized attention the firm provide its customer). Five performance measures (i.e. travel time, waiting time, accessibility or load factor, regularity of service, and comfort) were used by Sumon [28] to measure quality of some selected (only improved quality one) bus services operating in two routes of Dhaka City. The study of Andaleeb et al. demonstrates that the factors of comfort, need to change buses, behavior of the staff, and government supervisions are significant but quality of the ride, co-passengers behavior, and feelings of insecurity are not significant in predicting passenger satisfaction about bus service in Dhaka city [10] . Nevertheless, fare, frequency of service, waiting time, travel time, etc. also could be the major attributes for assessing the bus service quality. For instance, Stradling et al. [29] conducted self-completion questionnaire in eight areas of the city of Edinburgh and eight underlying factors were reported such as feeling unsafe, preference of walking and cycling, problem with service provision like no direct route, unwanted arousal (i.e., intrusions and interruptions such as inconvenience journey because of overcrowded passengers, other passenger smoking habit, and other annoyed people behavior on the bus, preference of car use, cost, disability and discomfort, and low self-image because of travelling with public transport. For measuring customer satisfaction and service quality TRB handbook has notably created a solid base for both academics and operators for further investigations. It has also introduced a wealthy detailed process for measuring customer satisfaction and transit service quality. These efforts were followed by Hensher and Prioni in identifying a service quality index [30] . Based on these efforts, the European Committee of Standardization developed a comprehensive methodology for measuring service quality. This methodology included an analysis of different approaches and illustrated a list of service quality indicators. All these previous efforts have opened the door for further investigations of bus service quality indicators to understand the link between quality of service and users satisfaction. This paper attempts to explore the existing quality available from the buses operating in Dhaka City and the bus passenger’s feelings about the services.
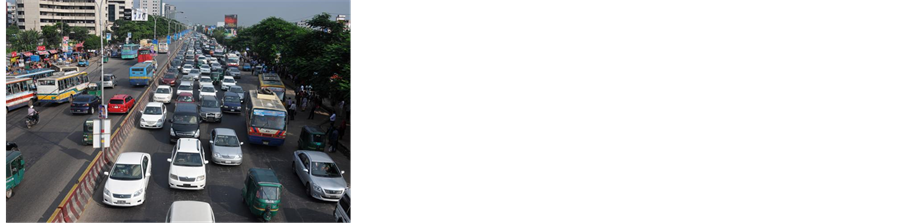
Lots of people living in the dense urban areas of Dhaka own automobiles. Private automobiles are owned by 33 per 1000 persons, lagging behind all other Asian cities [11] . Main reason for increasing vehicle ownership and trips are raising incomes, low quality of public transit services, and urban spatial decentralization [31] (Figure 1).
3. Methodology
Field survey and questionnaire survey was conducted for data collection. Field survey covers the important information of locations, passengers and type of vehicles. Questionnaire survey covers the views of passengers. Respondents were asked to rate their satisfaction as indicated in the questionnaire. Five important locations (Mirpur-12, Azimpur, Uttara, Motijheel and Farmgate) were chosen for the questionnaire survey. These locations were visited on different days during different hours with the objective to cover passengers from all probable locations. Data collection was conducted form 8 - 10 am in the morning and 3 - 5 pm in the afternoon. The variable selected for measuring customer satisfaction are quality, reliability, safety and security of bus service provided by the bus services functioning in Dhaka city. Attributes of the variables selected for this research are public bus fitness, sitting arrangement, bus standard, noise pollution, control and management, travel time, regularity of service, customer service, fitness of buses, integration with supporting modes, driving practice, boarding and alighting facilities, travel cost, cleanliness, fare collection system, overcrowding, bus comfort, security, safe from accident, on board security, security of goods, law enforcing agencies surveillance, lighting facilities and information in bus stops and so on. Field survey locations are listed in Table 1 with all the required information. Figure 2 shows the field survey locations.
For identifying the attributes of passenger (customer) satisfaction, the questionnaire survey was conducted with those passengers who have to travel frequently. The questionnaire consisted five main parts. Part A covers demographic information of the passengers containing questions about respondent’s age, occupation, survey location and users most frequently used routes. Part B is about bus quality. It includes questions about fitness of buses, body and sitting arrangement, standard to attract well-earned people, comfort and noise level inside the bus. Part C is about reliability. It includes question about control and management among different bodies for quality control, waiting time-both in


Figure 1. Buses in Dhaka city.

Table 1. Field survey locations.
 (a) Mirpur-12 (b) Azimpur
 (c) Ajompur, Uttara (d) Farmgate
 (e) Motijheel
Figure 2. Field survey locations.
bus stops and during movement, integration with supporting modes, customer service and travel time and schedule. Part D is about safety and security. It includes questions about driving practice by drivers, boarding and alighting facilities, chances of pick pocketing/hijacking, lighting facilities, feeling secured of goods. Part E is about Service. It includes questions on frequency of service, ticket/fare collection system, boarding facilities for disabled person/women/ children, standard of bus and availability of information (related to routes, timing, bus service etc.) at the bus stoppages. Part F includes questions of satisfaction based on travel cost, travel time, cleanliness, available means of travel, waiting time and boarding and alighting places. Number of respondents was 180. Likert-type scale was used in the questionnaire.
The survey result showed that the participants are mostly student and private service holder at the age range of 21 - 25 and 31 - 35. Table A1 (see Appendix) provides the variables list used in SPSS.
4. Binary Logistic Regression Analysis
Bus users’ satisfaction was analyzed by discrete choice logit model towards quality, reliability, safety and security and service provided by buses functioning in Dhaka city. Binary Logistic Regression (BLR) model is one of the most commonly used statistical techniques for the analysis of binary categorical response variable [32] [33] . The model assumes a binomial distribution for the binary dependent variable and a logit link function. In this research binary regression is used to predict the satisfaction of bus users by using SPSS software. This type of model is a member of the family of models known as generalized linear model. In statistics, logistic regression or logit regression is a type of probabilistic statistical classification model. It is also used to predict a binary response from a binary predictor, used for predicting the outcome of a categorical dependent (i.e., a class label) based on one or more predictor variables (features). That is, it is used in estimating empirical values of the parameters in a model. Logistic regression measures the relationship between a categorical dependent variable and one or more independent variables, which are usually (but not necessarily) continuous, by using probability scores as the predicted values of the dependent variable. Logistic regression is used extensively in numerous disciplines, including the medical and social science fields. If binary values 1 and 0 are used to repre- sent passengers overall good and not-good respectively, then the binary logistic regression model which is commonly known as binary logit model is defined as (33):

where P(Y = 1) describe the probability of a passenger rating the overall service as being good whiles [1 − P(Y = 1)] represent the probability of a passenger rating the overall service as not-good given the satisfaction level of the individual service components. This probability falls between 0 and 1 for all possible independent variables. Also, alpha and beta represent the intercept and a vector of slope coefficients respectively whiles x is a vector of explanatory variables repre- senting the satisfaction level for individual service component. The parameters in the model can be estimated using maximum likelihood estimation method. The estimated model can be evaluated as done in any other generalized linear model. That is, by testing the significant difference between the null model (restricted model) and the fitted model (unrestricted model) for the data.
5. Data Analysis and Result
The Binary Logistic Regression (BLR) model is one of the most commonly used statistical techniques for the analysis of binary categorical response variable [32] [33] . In this research binary regression is used to predict the satisfaction of bus users. Here 1 and 0 are the binary values used for the satisfaction of passenger or not.
Table 2 shows the logistic coefficient (B) associated with the intercept as it is included in the model. The S.E. is the standard error for the B (i.e., how much sample to sample fluctuation in the estimated parameter that is expected in the long run if e an infinite number of samples are considered). Under Variables in the Equation it can be seen that the intercept only model is ln (odds) = −0.475. If both sides of this expression are exponentiated, predicted odds would be found [Exp (B)] = 0.622. The “Wald” is an inferential statistic. When this statistic is evaluated, it is found statistically significant at p < 0.05. The probability of observing a statistic of 9.617 or more extreme is equal to 0.622.
The Hosmer and Lemes how Test is a measure of fit which evaluates the goodness of fit between predicted and observed probabilities. The model is well fitted as the chi-square, χ² = 4, p = 0.857, which indicates that the model predicts values not significantly different from what was observed. The p-value should be greater than the established cutoff (generally 0.05) to indicate good fit (Table 3).
S.E. or standard error is a measure of how stable the estimate is. A large standard error means the estimated coefficient isn’t that well estimated, and a low standard error means a fairly precise estimate. “Sig.” or p value in Table 4 indicates the value focusing the relationship among the dependent and independent variable. The values <0.5 of sig. denotes a strong relationship of independent variable with dependent variable.
Based on stated preference (for example [34] [35] [36] ) and univariate techniques different service feature items are rated based on satisfaction level to measure the service quality as seen in literature. Authors [37] [38] [39] revealed that
Table 2. Variables in the equation.
Table 3. Hosmer and lemeshow test.
passengers are concerned about some factors as safety, comfort, cost, personnel attitudes and information about trips during travelling. Frequency of service has a notable influence on general transport service quality strategies [40] . Eboli and Mazzula [41] found two major attributes of service quality as reliability and punctuality in their studies.
Table 4. Binary logistic regression model.
Table 4 shows “Lack of cleanliness” (p = 0.022), “Lack of good standard bus” (p = 0.015), “Lack of law enforcing agencies surveillance” (p = 0.040) and “Poor customer service” (p = 0.016) has p value less than 0.05. Result shows that these variables have strong relationship with the satisfaction of bus users of Dhaka city. “Lack of cleanliness” and “Lack of good standard bus” are in the group of
Service. So, overall service of the buses in Dhaka city is the major concern of people. “Poor customer service” which is in the group of Reliability is playing an important role for satisfaction of bus users. “Lack of law enforcing agencies suvillance” which belongs to the group of safety and security is one of the major concerns of the bus users’ satisfaction. This analysis finds strong relationship of user satisfaction with “Service”, “Reliability” and “Safety and Security” of bus service. So “Quality” of bus service does not show any sign of strong attachment with the satisfaction of bus users from the model. Bus users are meeting challenges with the standards of discomfort and inconvenience which many potential passengers would find unacceptable and which bus users only accept because they do not have any alternative as mentioned by Simpson [42] .
The study evaluated the important factors which affect passenger satisfaction with the service provided by the buses in Dhaka city. This research differs from the other public transport service satisfaction research because the type of statistical methodology employed for analyzing the overall satisfaction of bus users. This research explains the effects of passengers satisfaction on various service provided by the buses plying in the city. The results established that majority of the bus users’ are unsatisfied with the present overall service provided by the buses. The users view showed that the present bus service is not satisfactory in all aspects such as quality, reliability, safety and service. Most of the respondents think that the qualities of buses are poor at all location of Dhaka city. According to users view poor body and sitting arrangement is the prime reasons for degraded quality of bus service at all the location except Uttara. At Uttara the people think less comfort is the reason of unsatisfactory service. Around half of the users’ experienced that the services provided by the buses in the Dhaka city are not so reliable. Unpredictable travel time and schedule, lack of co-ordination among different bodies and sudden breakdown of buses are the prime concern of people for unreliability of bus service in Mirpur-12, Azimpur and Farmgate. On the other hand the respondenrs of Uttara and Motijheel think that higher waiting time both in bus stops and during movement is the reason of unreliability of buses. Almost half of the respondents’ view is that the safety conditions of buses are poor due to drivers’ unsafe driving practices found at almost all the survey locations. The overall services provided by the buses are poor at all the five location. Different reason came into revelation for poor bus services. Respondents opinion about the unsatisfactory service provided by the buses are overcrowding (at Farmgate); lack of good standard buses (at Mirpur-12); overcrowding (at Azimpur and Motijheel); irregular service and overcrowding (at Uttara); and lack of cleanliness; and overcrowding (at Farmgate). The binary logit model was carried out with 45 variables with considering users’ information, bus quality, bus reliability, safety, security and overall bus service which significantly affect the satisfaction of bus users’. The analysis reveals that customer satisfaction either as a total result or a segment result identified critical points which affect customer satisfaction. “Lack of cleanliness”, “Lack of good standard bus”, “Lack of law enforcing agencies suvillance” and “Poor customer service” comprises the weak point of the present bus service operating in the densely populated Dhaka city.
6. Conclusions
The result indicated that more than half of the respondents believed that the pre- sent condition of bus service is not satisfactory. In case of the quality of buses, people think that the body and the sitting arrangement of the buses are not comfortable. Regarding the safety and security condition, the main three reasons of dissatisfaction of passengers’ are unsafe driving practices, poor boarding and alighting facilities and lack of law enforcing agencies surveillance. In case of the facilities provided by buses, there are a number of reasons which make the service unsatisfactory. That includes irregular service provided by buses, regular overcrowding, lack of good standard buses and lack of cleanliness. In spite of these negative views, users’ possessed a positive attitude for buses which is the low travel cost. Strategies of Government must be driven into a phase which will take care of these concerns to attract new users and also retain the existing users of bus service.
Few people living in the dense urban fabric of Dhaka own automobiles. Private automobiles are owned at a rate of only 33 per 1000 persons, lagging behind all other Asian cities [11] . The poor institutional and regulatory framework, reluctance to enforce existing legislation, and lack of enforcement reduce the capacity of existing roads [43] . There are many measures that can improve the attractiveness and performance of public transport systems e.g. extending services, adapting fee structures, operational improvements, and public transport information provision [44] . The problems arise due to a lack of transportation infrastructure in the city and absence of a transit system to handle the volumes that currently exist. In order to sustain the existing users and to attract new users, the policies related to passenger’s safety, security as well as fare, reliability and overall service offered by the buses in Dhaka city must be taken into account in order to enhance its suitability as a public transport.
Cite this paper
Rahman, F., Chowdhury, T.D., Haque, T., Rahman, R. and Islam, A. (2017) Identifying Existing Bus Service Condition and Analyzing Customer Satisfaction of Bus Service in Dhaka City. Journal of Transportation Technologies, 7, 107-122. https://doi.org/10.4236/jtts.2017.72008
References
- 1. Ali, A.N. (2010) An Assessment of the Quality of Intra-Urban Bus Services in the City of Enugu, Enugu State, Nigeria. Theoretical and Empirical Researches in Urban Management, 6, 74-91.
- 2. Cullinane, S.L. (2002) The Relationship between Car Ownership and Public Transport Provision: A Case Study of Hong Kong. Transport Policy, 9, 29-39.
- 3. Cullinane, S.L. (1992) Attitudes towards the Car in the UK: Some Implications for Policies on Congestion and Environment. Transportation Research Part A, 26, 291-301.
- 4. Deng, T. and Nelson, J.D. (2010) The Impact of Bus Rapid Transit on Land Development: A Case Study of Beijing, China. World Academy of Science, Engineering and Technology, 66, 1196-1206.
- 5. Ebuli, L. and Muzzula, G. (2007) Service Quality Attributes Affecting Customer Satisfaction for Bus Transit. Journal of Public Transportation, 10, 21-34.
https://doi.org/10.5038/2375-0901.10.3.2 - 6. Randheer, K., Al-Motawa, A.A. and Vijay, J.P. (2011) Measuring Commuters’ Perception on Service Quality Using SERVQUAL in Public Transportation. International Journal of Marketing Studies, 3, 21-34.
https://doi.org/10.5539/ijms.v3n1p21 - 7. dell’Olio, L., Ibeas, A. and Cecín, P. (2010) Modelling User Perception of Bus Transit Quality. Transport Policy, 17, 388-397.
- 8. STP (2004) Strategic Transport Plan (STP) for Dhaka, Final Report, 2006. Dhaka Transport Coordination Board.
- 9. Road Maintenance and Management System (RMMS) (2004). Dhaka City Corporation (DCC), Dhaka-1000.
- 10. Andaleeb, S.S., Haq, M. and Ahmed. R. (2007) Reforming Innercity Bus Transportation a Developing Country: A Passenger-Driven Model. Journal of Public Transportation, 10, 1-25.
https://doi.org/10.5038/2375-0901.10.1.1 - 11. Barter, P. (2000) Urban Transport in Asia: Problems and Prospects for High-Density Cities. Asia-Pacific Development Monitor, 2, 33-66.
- 12. Maher, N. (2013) Deficiencies of Existing Public Transport System and a Proposai for Integrated Hierarchical Transport Network as an Improvement Options: A Case of Dhaka City. IOSR Journal of Mechanical and Civil Engineering (IOSR-JMCE), 5, 42-53.
- 13. Zahir, U.Md., Matsui, H. and Fujita, M. (2000) Investigate the Effects of Bus and Passenger Arrival Patterns and Service Frequency on Passenger Waiting Times and Transit Performance of Dhaka Metropolitan Area. In: Sucharov, L. and Brebbia, C.A., Eds., Urban Transport VI: Urban Transport and the Environment for the 21st Century, WIT Press, Boston, 57-64.
- 14. Hoque, M.M., Khondokar, B. and Alam, J.B. (2005) Urban Transport Issues and Improvement Options in Bangladesh. Proceedings of Canadian Transport Research Forum (CTRF) Conference, Toronto, Canada.
- 15. Rahman, M.S.U. (2009) Fuel Consumption of Transport Sector: How the People of Dhaka City Will Be Moving in the Future? Proceedings of the ECEEE Summer Study, Act! Innovate! Deliver! Reducing Energy Demand Sustainably, 1409-1415.
- 16. Hossain, M. (2006) The Issues and Realities of BRT Planning Initiatives in Developing Asian Cities. Journal of Public Transportation, BRT Special Edition, 9, 69-87.
- 17. STP, Standard Transport Planning (2005) Urban Transport Policy: The Strategic Transport Plan (STP) for Dhaka. Dhaka Transport Coordination Board (DTCB), Dhaka.
- 18. Karim, M.M. and Mannan, M.S. (2008) Mass Transit Demand in Dhaka Metropolitan and Review of Alternatives. Ministry of Housing & Public Works (MHPW).
- 19. Rahman, M.S.U. (2010) Special Bus Service for Women in Dhaka City, Bangladesh. 12th World Conference on Transport Research (WCTR), WCTRS, Lisbon.
- 20. Haque, M.M. (2000) Road Planning and Engineering for Promoting Pedestrian Safety in Bangladesh. 10th REAAA Conference, September, REAAA, Tokyo.
- 21. Botzow, H. (1974) Level-of-Service of Evaluating Public Transport. Transportation Research Record: Journal of the Transportation Research Board, No. 519, Transportation Research Board of the National Academies, Washington DC, 73-84.
- 22. Wright, P.H. and Ashford, N.J. (1989) Transportation Engineering Planning and Design. 3rd Edition, Wiley, New York.
- 23. Currie, G.V. (2003) Planning and Design for On-Road Public Transport. Institute of Transport Studies, Traffic Engineering and Management. Monash University, Monash.
- 24. Tyrinopoulos, Y. and Antoniou, C. (2008) Public Transit User Satisfaction: Variability and Policy Implications. Transport Policy, 15, 260-272.
- 25. Hasan, M.N. (1996) The Role of Double-Decker Buses as a Mode of Public Transportation in Dhaka City. MURP Thesis, Bangladesh University of Engineering and Technology (BUET), Dhaka.
- 26. Parasuraman, A., Zeithaml, V.A. and Berry, L.L. (1988) SERVQUAL: A Multiple-Item Scale for Measuring Consumer Perceptions of Service Quality. Journal of Retailing, 64, 5-6.
- 27. Gronroos, C. (1984) A Service Quality Model and Its Marketing Implications. European Journal of Marketing, 18, 36-44.
- 28. Sumon, M.F.R. (2005) Evaluation of Standard of Passenger Bus Services: Some Routes of Dhaka City. MURP Thesis, Bangladesh University of Engineering and Technology (BUET), Dhaka.
- 29. Stradling, S., Carreno, M., Rye, T. and Noble, A. (2007) Passenger Perceptions and Ideal Urban Bus Journey Experience. Transport Policy, 14, 283-292.
- 30. Hensher, D.A. and Prioni, P.A. (2002) A Service Quality Index for Area-Wide Contract Performance Assessment. Journal of Transport Economics and Policy, 36, 93-113.
- 31. He, D. (2006) Bus Rapid Transit (BRT) Developments in China. Paper presented in BAQ Conference, Yogyakarta, Indonesia.
- 32. Nelder, J.A. and Wedderburn, R.W.M. (1972) Generalized Linear Models. Journal of the Royal Statistical Society, 135, 370-384.
https://doi.org/10.2307/2344614 - 33. Agresti, A. (2007) An Introduction to Categorical Data Analysis. 2nd Edition, John Willey and Sons, Inc., Hoboken.
https://doi.org/10.1002/0470114754 - 34. Hensher, D.A. (1991) Hierarchical Stated Response Designs and Estimation in the Context of Bus Use Preferences. Logistics and Transportation Reviews, 26, 299-323.
- 35. Swanson, J., Ampt, L. and Jones, P. (1997) Measuring Bus Passenger Preferences. Traffic Engineering and Control, 38, 330-336.
- 36. Prioni, P. and Hensher, D.A. (2000) Measuring Service Quality in Scheduled Bus Services. Journal of Public Transport, 3, 51-74.
- 37. Nathanail, E. (2008) Measuring the Quality of Service for Passengers on the Hellenic Railways. Transportation Research Part A, 42, 48-66.
- 38. Iseki, H. and Taylor, B.D. (2008) Style versus Service? An Analysis of User Perceptions of Transit Stops and Stations in Los Angeles. Proceedings of the 87th Annual Meeting of the TRB, 13-17.
- 39. Eboli, L. and Mazzulla, G. (2012) Structural Equation Modelling for Analyzing Passengers’ Perception about Railway Services. Procedia-Social and Behavioural Sciences, 54, 96-106.
- 40. Eboli, L. and Mazzulla, G. (2008) Willingness-to-Pay of Public Transport Users for Improvement in Service Quality. European Transport, 38, 107-118.
- 41. Eboli, L. and Mazzulla, G. (2000) How to Capture the Passengers’ Point of View on a Transit Service through Rating and Choice Options. Transport Reviews, 30, 435-450.
https://doi.org/10.1080/01441640903068441 - 42. Simpson, B.J. (1994) Urban Public Transport Today. E & FN Spon, London.
- 43. DMDP (1995) Dhaka Structure Plan 1995-2015. Dhaka Metropolitan Development Plan, Vol. 1, RAJUK.
- 44. Transport Research Centre (2007) Managing Urban Traffic Congestion. European Conference of Ministers of Transport.
Appendix
Table A1. Variable lists used in SPSS.