Agricultural Sciences
Vol.4 No.8(2013), Article ID:35656,9 pages DOI:10.4236/as.2013.48052
Effects of puddling on percolation and rice yields in rainfed lowland paddy cultivation: Case study in Khammouane province, central Laos
![]()
1Faculty of Bioresources and Environmental Sciences, Ishikawa Prefectural University, Nonoichi, Japan; *Corresponding Author: yfuji@ishikawa-pu.ac.jp
2Japan International Research Center for Agricultural Sciences, Tsukuba, Japan
3Institute for Sustainability and Peace, United Nations University, Tokyo, Japan
4Graduate School of Agriculture, Hokkaido University, Sapporo, Japan
Copyright © 2013 Yoichi Fujihara et al. This is an open access article distributed under the Creative Commons Attribution License, which permits unrestricted use, distribution, and reproduction in any medium, provided the original work is properly cited.
Received 19 May 2013; revised 20 June 2013; accepted 10 July 2013
Keywords: Rainfed Lowland Paddy; Rice; Puddling; Percolation; Yield; Laos
ABSTRACT
We investigated the effects of puddling on percolation and rice yields in rainfed lowland paddy cultivation. We selected a study village in Khammouane province, central Laos, and set up non-puddling and puddling plots from high to low positions. Even when puddling was conducted carefully, the ponding water in the plots disappeared in the case of little rainfall. Further, percolations during the later periods of rice growth increased drastically. Therefore, it is difficult to overcome drought stresses only by conducting puddling. We also compared the water conditions in the non-puddling and puddling plots. In the puddling plots at high position and low position along a stream, the number of days without ponding water in the puddling plots was less than that in the non-puddling field in July, suggesting the possibility of a different transplanting date. We tried to estimate the effects of transplanting date on the rice yields and found that transplanting 15 days earlier leads to an increase of 0.5 t/ha in the rice yields. Moreover, the profits from the increased yields exceed the puddling costs considerably, leading to a definite increase in income. Because the transplanting date has no effects in the fields with high ground water, puddling is effective in paddy fields where ponding does not occur to a significant degree.
1. INTRODUCTION
The total area of rainfed lowland paddies in Asia is about 59 million ha, which accounts for approximately 44% of all the rice cultivated land [1]. The rice productivity in rainfed lowland areas is very low because of unstable water resources and low soil fertility, and the average rice yield is estimated to be approximately 2.1 t/ha [2]. Most of these rainfed agricultural areas are left behind from irrigation planning areas, and poverty is still a serious problem [3].
Therefore, it is vitally important to stabilize and improve rice production by efficiently utilizing the limited water resources. Suzuki et al. [4] developed and used a hydrologic model to simulate water movements and estimate rice productivity under various conditions on a sloping land in northeast Thailand. Tsubo et al. [5] developed a water balance model for rainfed lowland rice fields to emphasize lateral water movement within a toposequence and analyzed the water balance characteristics in relation to the topology. Miyagawa [6] compared the rice yields from transplanting and direct seeding using a crop model and reported that the range of seeding times can be extended by the introduction of direct seeding; the rice yield will improve as a consequence. Boling et al. [7] used a sophisticated crop growth model (ORYZA2000) to evaluate the effects of deep tillage, supplementary irrigation, and fertilizer application on the yield of lowland rice in Central Java. They concluded that ground water depth should be taken into account in the selection of interventions designed to increase rice yields.
Although many researchers have used numerical simulations to investigate possible techniques for improvements in water use and cultivation of rainfed rice cultivation areas, very little research has been carried out by conducting actual experiments in rice fields. Sharma et al. [8] compared subsoil compaction, puddling, and plastic barrier to study their effects on the in situ rainwater conservation efficiency and productivity of rainfed lowland rice in loamy sand soil. They concluded that subsoil compaction technology is applicable on a field scale to rainfed rice grown in coarse textured soils. Therefore, even if compaction technology can serve as a basic technique in an irrigated region, it is not known whether it will be effective in rainfed lowland rice environments because of few researches based on actual experiments in rainfed lowland rice fields.
Puddling is one of the most basic tasks in an irrigated paddy field. So, the mechanisms and control of percolation losses in irrigated puddled rice fields have been analyzed, and the effects of puddling on water quality have been also investigated [9-11]. However, the effects of puddling in rainfed paddy fields are still unclear because it is difficult to control free-flowing water and to predict rainfall and ponding. In this study, we selected a site in a rainfed lowland paddy cultivation area in central Laos. We set up non-puddling and puddling plots from high to low positions in this village and investigated the effects of puddling on percolation and rice yields in the rainfed area.
2. MATERIAL AND METHODS
2.1. Study Site
We selected Na Toung village, Mahaxai district, Khammouane province, as the study site to represent a typical rainfed lowland rice area. The location of the study site is shown in Figure 1. The annual rainfall in this area is approximately 2150 mm, and the amount of rainfall is high compared with northeastern Thailand, which is often used as a typical rainfed agricultural area [12,13].
At the start of May, i.e., the beginning of the rainy season, a rice nursery is prepared and the agricultural activities for rice cultivation are started in the area around this village. The farmers then wait for rainfall and plow the paddy fields once or twice using a hand tractor with a disk plow. The farmers then change the disk plow to a tooth harrow to carry out puddling and immediately transplant the nursery. However, harrowing is not sufficiently thorough in many cases and soil lumps up to 10 cm in size are often left unbroken. The agricultural work after transplanting is sometimes not carried out carefully and hardly any weeding is done during the rice growth period. Apart from cow dung used by a few farmers, ba-
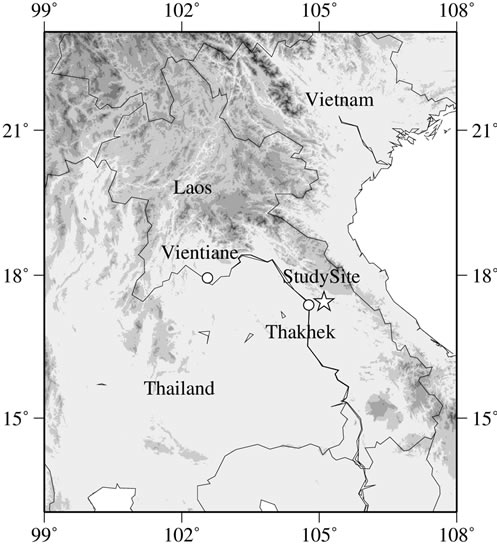
Figure 1. Study areation of the experimental fields.
sically no fertilizer is applied. The number of rice species cultivated in this village is over 10 and most of these are local varieties. The timing of transplanting depends on the rainfall pattern in the year, and it varies from year to year. However, most of the cultivated rice is a photosensitive variety and the harvesting period begins November every year. An analysis of 29 farmers within the village by Yamada [3] revealed that the average rice yield is approximately 1.4 t/ha lower than the average yield of 2.1 t/ha for a rainfed lowland rice area.
2.2. Experimental Method
1) Experimental fields Harrowing and puddling are not conducted very well in the study village, as explained above. Accordingly, we designated paddies where harrowing and puddling are not conducted very well as non-puddling plot and paddies where harrowing and puddling are conducted thoroughly as puddling plot. The difference in topographic elevation within the village paddy area is only a few meters, but this small difference entails variations in soil fertility and water conditions. As a result, the rice yields differ depending on the toposequence positions. Considering these characteristics, we set a transect line from the highest to the lowest position, established three experimental fields on the transect line, and created two sets of non-puddling and puddling plots in each experimental field. The land use of the study village and the location of the experimental fields are shown in Figure 2.
The length of each plot was approximately 4.8 - 6.6 m, and the width of each plot was approximately 2.3 - 3.5 m. The outline of the experimental plots is shown in Figure 3. The height of the bunds was approximately 15 cm, and
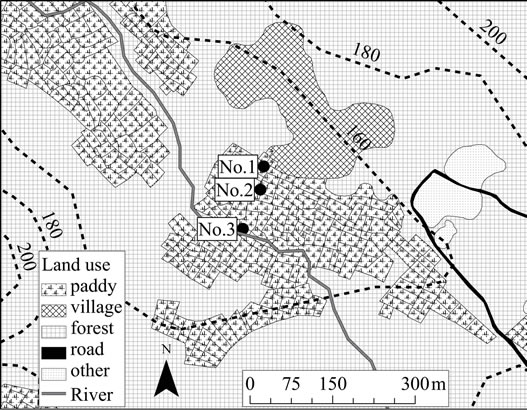
Figure 2. Land use of the study village and location of the experimental fields.
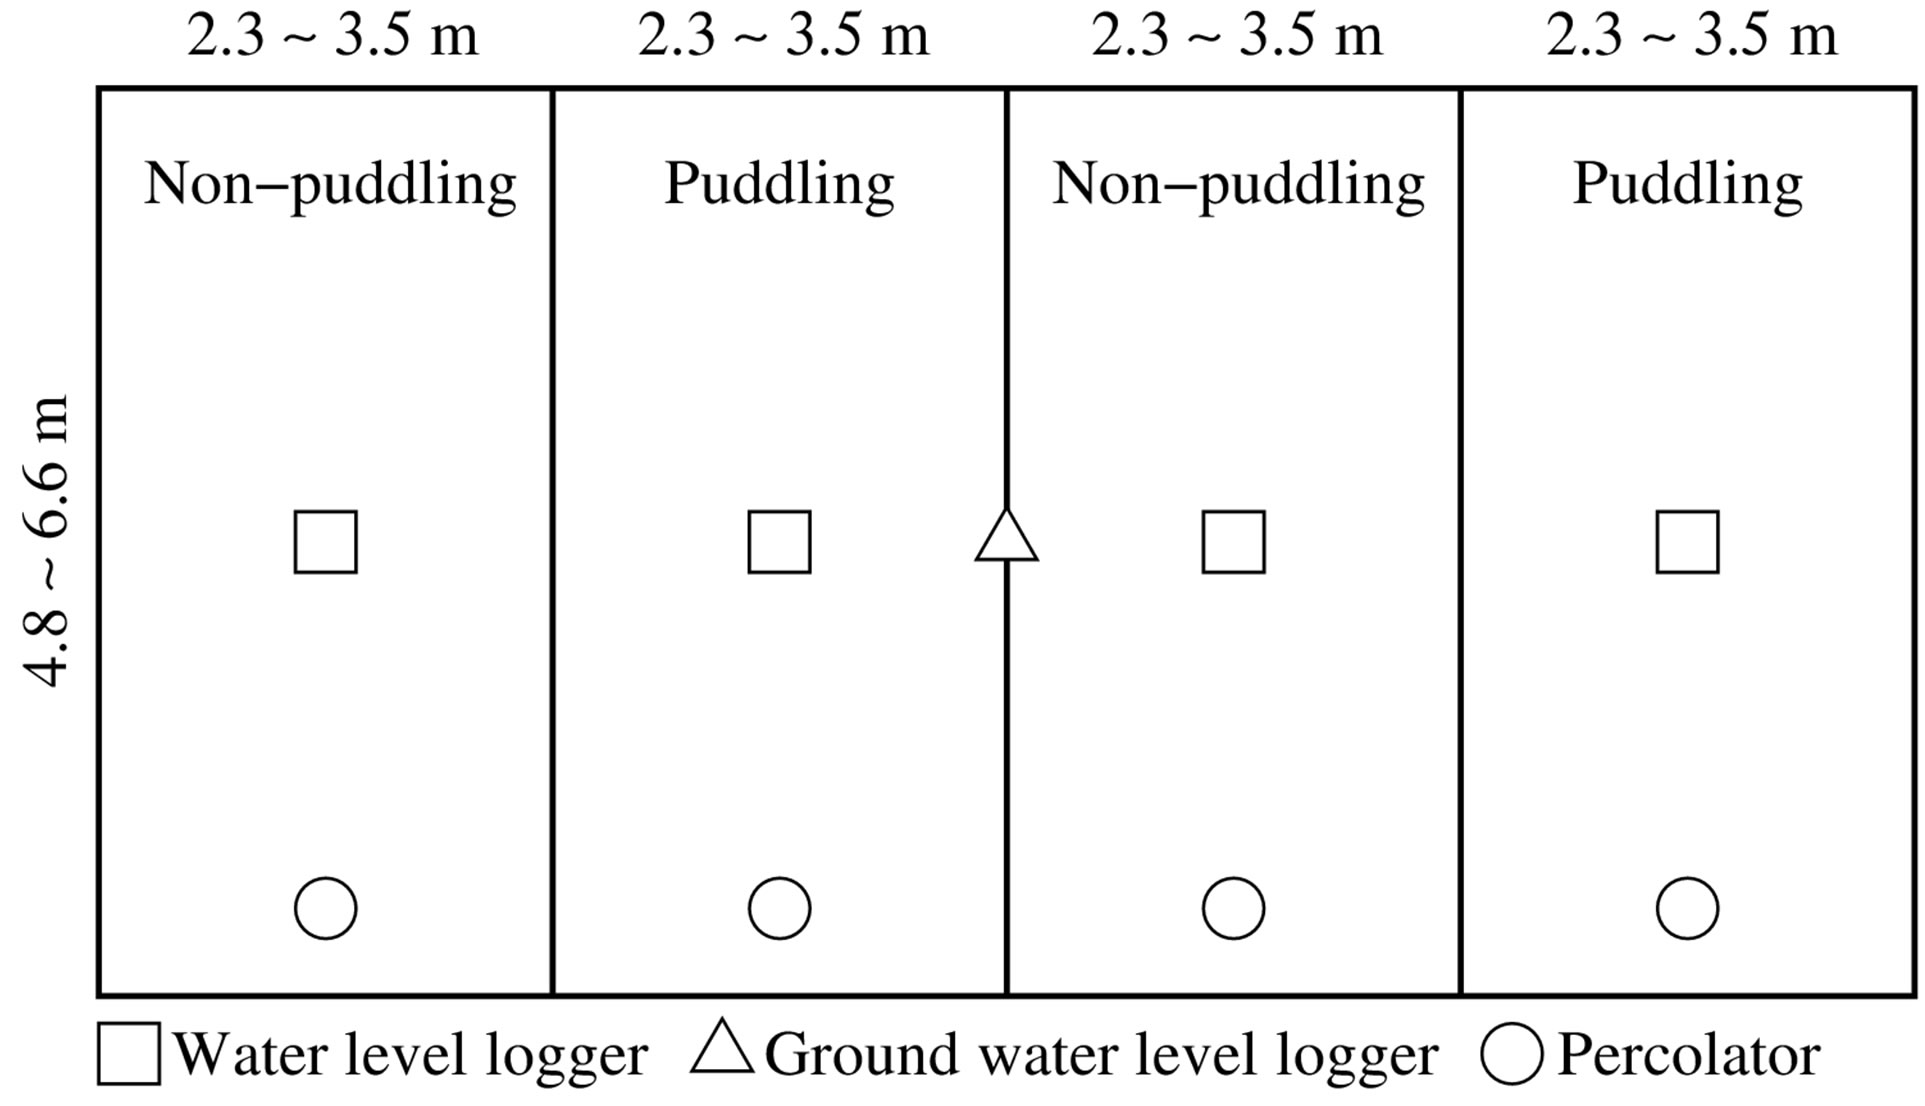
Figure 3. Outline of experimental fields.
we did not create inlets and outlets so that the only water source would be rainfall. The schedule of treatments in the experimental plots is shown in Table 1. On May 18, we plowed 15 cm of soil below the surface in the puddling plots using a hand plow, after waiting for rainfall. We continued plowing until the soil surface was completely broken. After waiting for further rainfall, we carried out puddling on June 4 by mixing the soil carefully using a hand rake; we also coated the levees by the muddy soil to prevent percolation through the bunds. These tasks were repeated on June 28 and 29, completing the treatments in the puddling plots. In the non-puddling plots, the soil was plowed to a depth of 15 cm on May 18 and June 28, but the soil was not broken up very well and 10 cm lumps of soil were left, similar to actual conditions in the village. We used 40-day-old seedlings and transplanted them into all the experimental fields at the same day. The rice variety was Khao Do Yuan, which is the most widely cultivated variety in the study village.
2) Observation methods We took soil samples from the top 15 cm of the surface in the three experimental fields in May 2010, before the start of the experiments, and carried out a physical and chemical analysis. We analyzed total carbon, total
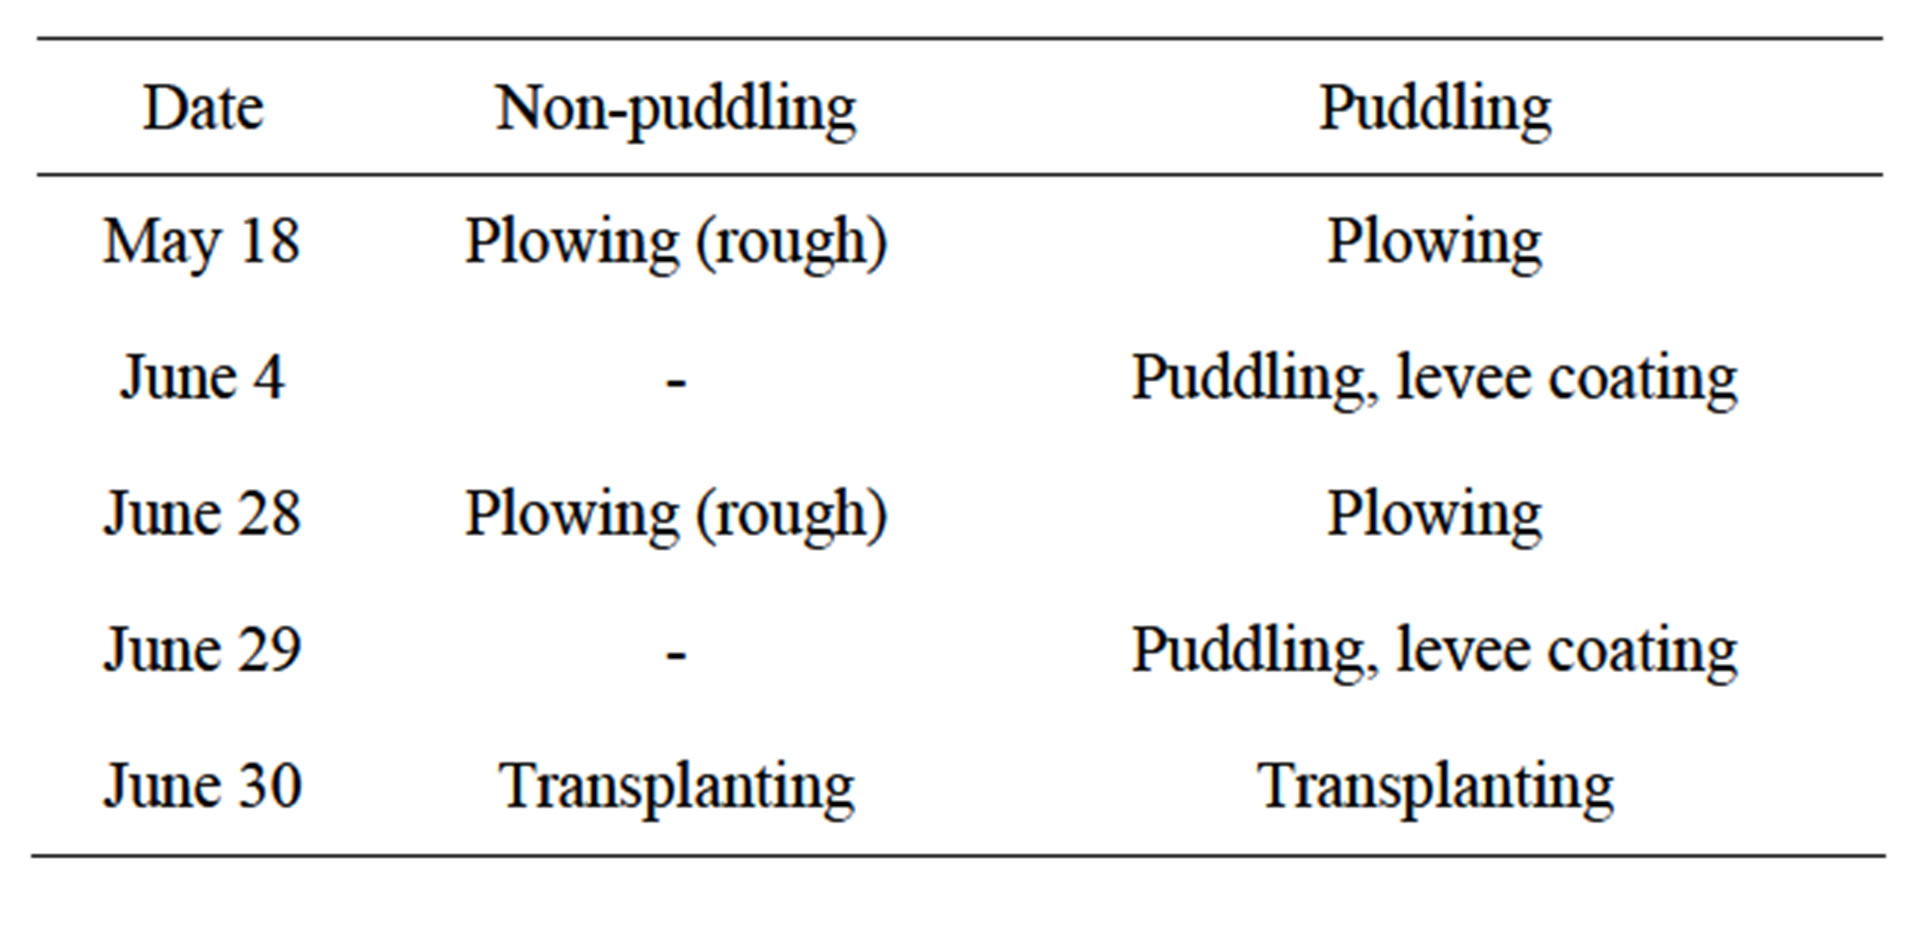
Table 1. Schedule of treatments.
nitrogen, available phosphorus (Bray II), exchangeable potassium, cation exchange capacity (CEC), pH (H2O) as chemical properties. We analyzed soil texture as physical property. We also established a weather station within the village, and observed rainfall, wind speed, radiation, temperature, humidity at one-hour time intervals. We made PVC pipes with holes from the bottom to a height of 0.7 m (the total length of the PVC pipes was 1.6 m), and made a 1.45 m deep hole in the middle of the bund in the experimental fields. We inserted the PVC pipe into this hole, set a water level logger at 1 m depth from the surface, and monitored ground water levels at one-hour time intervals. For surface water levels, we prepared PVC pipes with holes from the bottom to top (the total length of the PVC pipes was 0.8 m), made a 0.2 m deep hole in the each plot of the each experimental field and inserted this pipe into the hole. Water level loggers were set into the pipe to observe surface water levels. When there is no rainfall for some days, the surface water level frequently goes below the surface, so the water level sensor was set below 0.1 m depth from the surface. For deep percolations, we prepared a 20 cm diameter PVC pipe with no hole, and inserted it up to a hard pan which is approximately 20 cm deep in the each plot of the each experimental field. We set a cover to prevent rainfall and evaporation, and observed water level changes manually within the PVC pipe about every 3 days. The changes in water level were divided by the observation period and daily deep percolation was obtained. The cover was not well closed to pass air, and water was poured into the PVC pipe when the water level decreased and the difference between the inside and outside water levels was large. Figure 3 shows the observation instruments in relation to the experimental fields.
We obtained water requirement rates using the surface water level data we observed. Considering that there are no inlets and outlets in the plots, the water requirements (ET + P + L) can be obtained by the following equations.
 (1)
(1)
where ET: evapotranspiration (mm/d), P: percolation (mm/d), L: lateral seepage (mm/d), R: rainfall (mm/d), and ΔH: water level change (mm/d).
3) Evaluation of rice yields Two main factors influencing rice yields are drought stress and delay in transplanting, provided that the soil characteristics are the same in each of the experimental fields. As regards water stress, we started the experiment on the same day in all experimental fields, while any delay in heading date or deficiency in rice yield were recorded as drought stress [14]. Regarding transplanting, we defined ponding water with over 0 mm depth as the criterion of a possible transplanting day, and we estimated the possible transplanting day using the observed surface water data. The decrease in yield per day’s delay in transplanting can be estimated in the following way. In a preliminary survey of 32 paddy fields in this village in 2009, we derived 0.032 t/ha as the yield decrease for each day delay in transplanting; this value is almost the same as reported in previous studies [15,16]. We therefore adopted this value as the yield decrease rate. Then the total decrease due to transplanting delay can be estimated by multiplying this yield decrease rate by the number of days delayed. The heading date was recorded and 1 m by 1 m harvesting was conducted for investigation of rice growth in all the experimental plots.
3. RESULTS
3.1. Rainfall Pattern
The rainfall observed in 2010 at this study site and the past rainfall in Thakhek city, near the study site, are shown in Figure 4. It is found that the rainfall in April and May, 2010 was almost the same as in a normal year, but the June rainfall was only about 60% of normal, while August had more rain and September less than in a usual year. As the rainfall in June was so low, the transplanting did not proceed very well, and was delayed until July or even August.
3.2. Soil Characteristics
The physical characteristics of the soil in the experimental fields are shown in Table 2. The clay content was generally low, about 15%, while the sand content was more than 60%. Thus the soil texture was sandy loam or sandy clay loam. The clay content was higher in the low experimental fields (No. 3) and lower in the high and middle experimental fields (No. 1 and No. 2).
The soil chemical characteristics of the experimental fields are presented in Table 3. Total carbon was about 1% and total nitrogen about 0.1%, both very low. Available phosphorus varied enormously depending on the location, spanning a range of 2.9 - 46.5 mg/kg. CEC was 3.9 - 5.3 cmolc/kg, showing low values as for the other parameters. Considering soil fertility in relation to topology, the high experimental fields were generally more fertile than the low fields, in inverse relation to their clay content. The upper experimental plots (field No. 1) were near to the village, so that livestock frequently entered the paddy fields and cow dung was naturally deposited on the ground. Thus, the soil in the upper fields was considered to be relatively fertile.
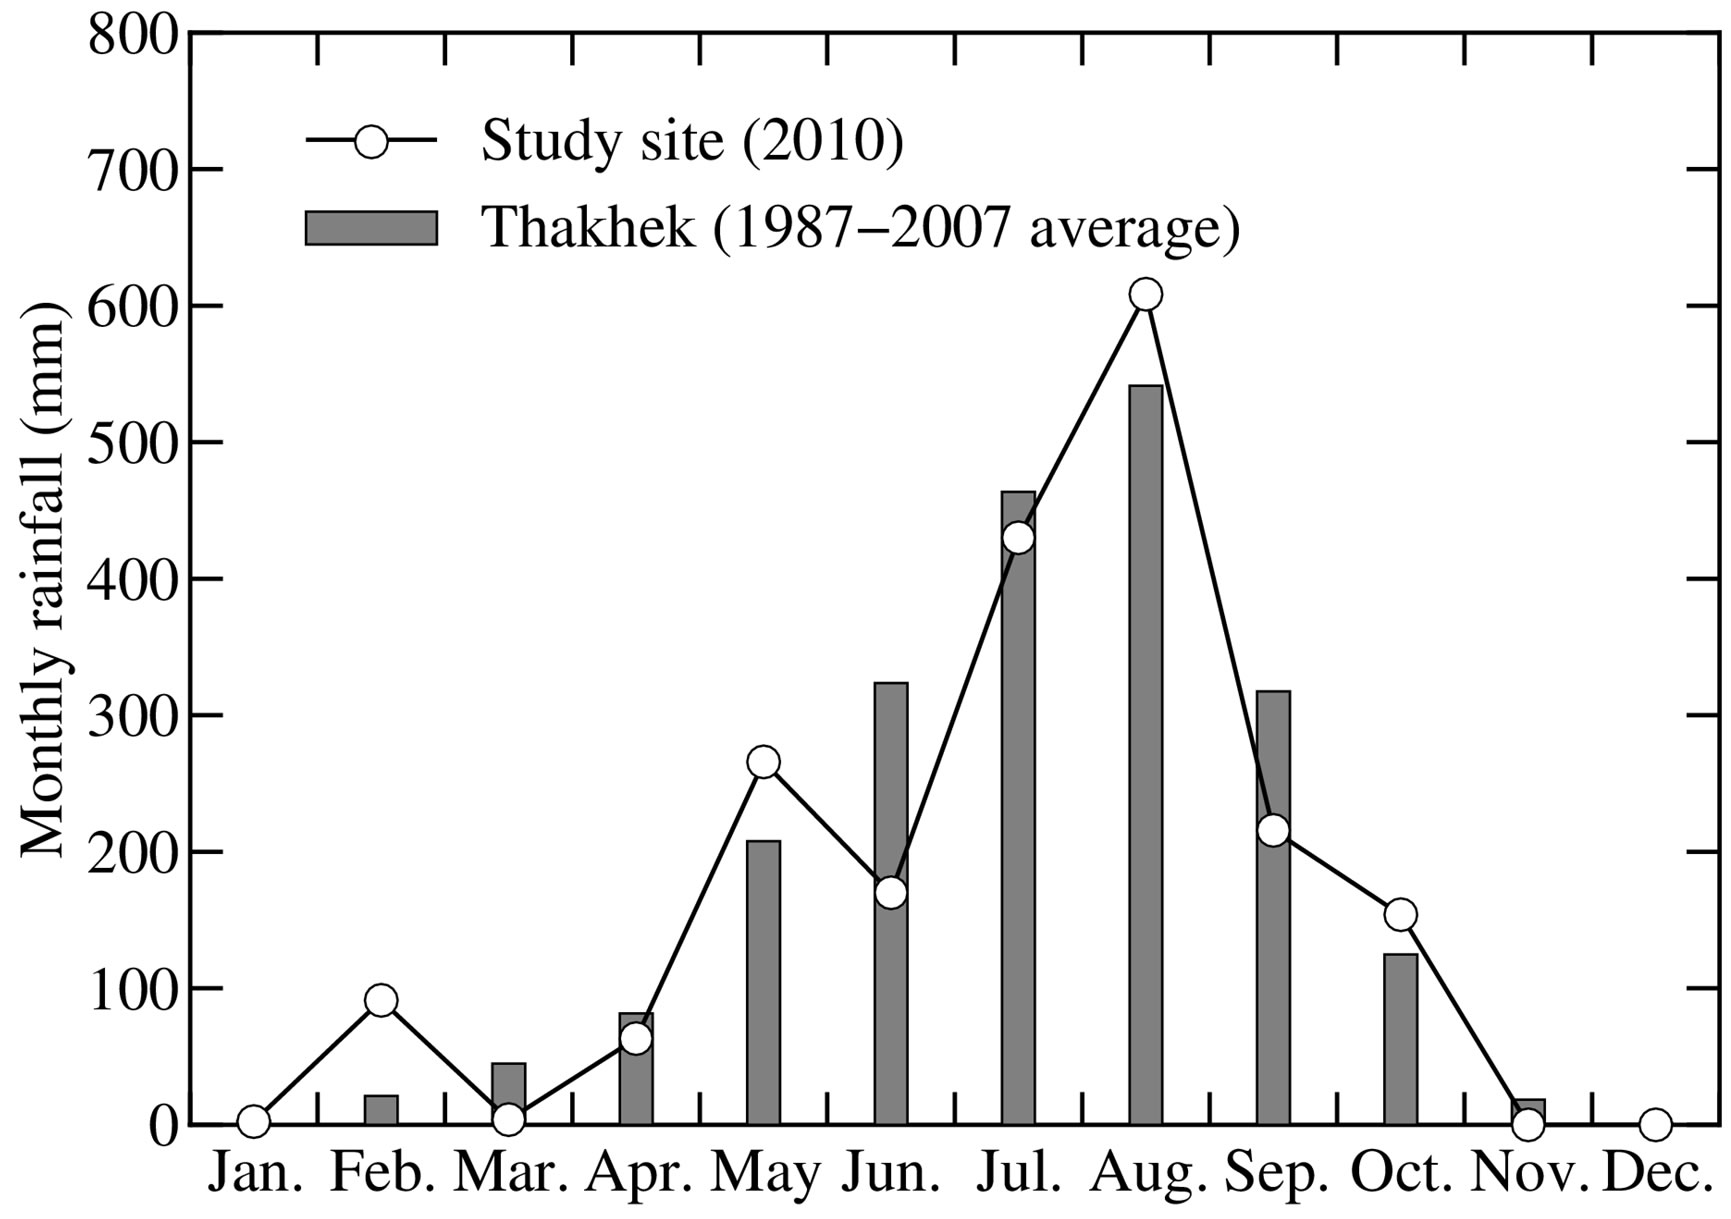
Figure 4. Characteristics of rainfall.
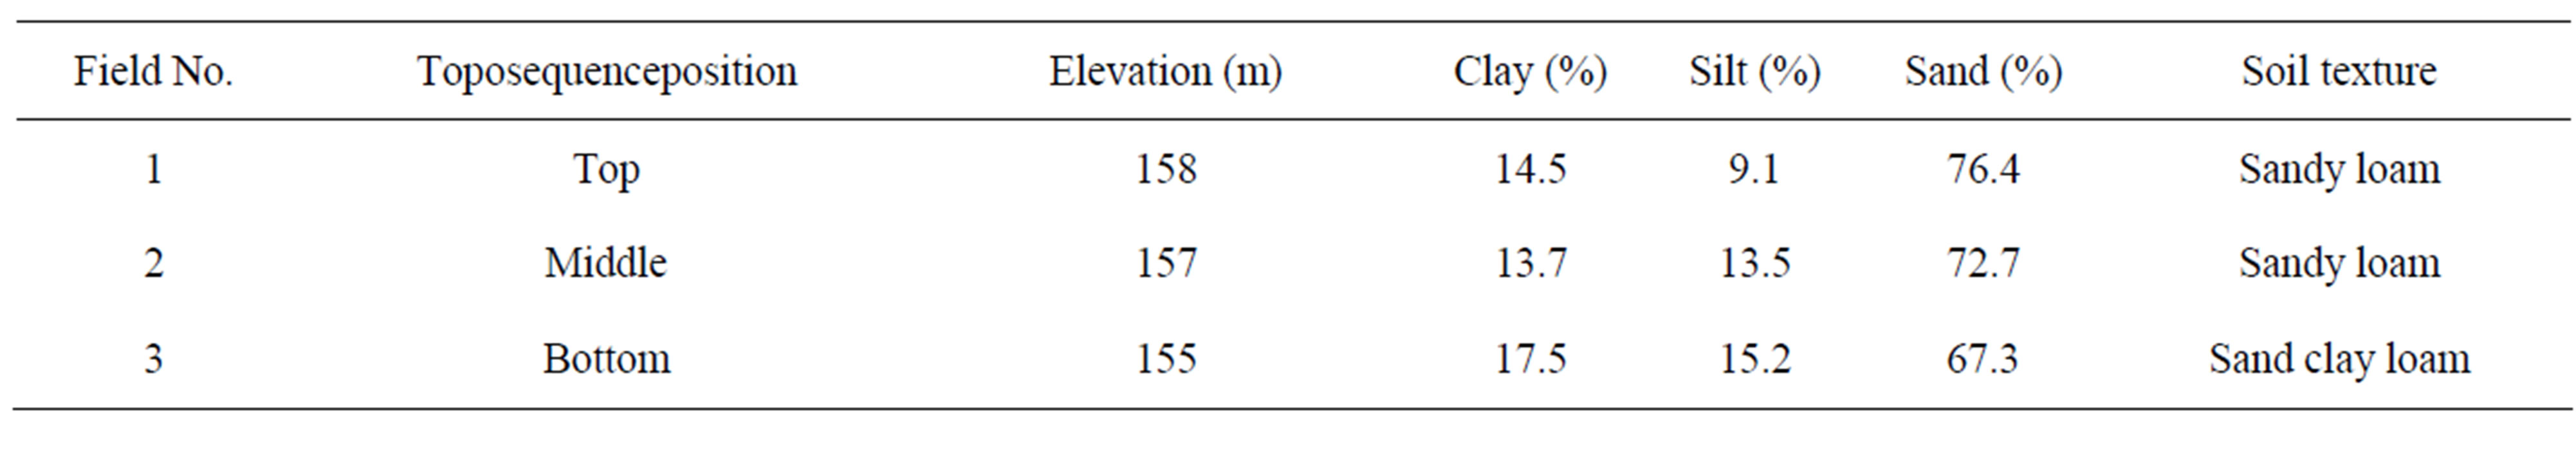
Table 2. Physical soil properties in experimental fields.
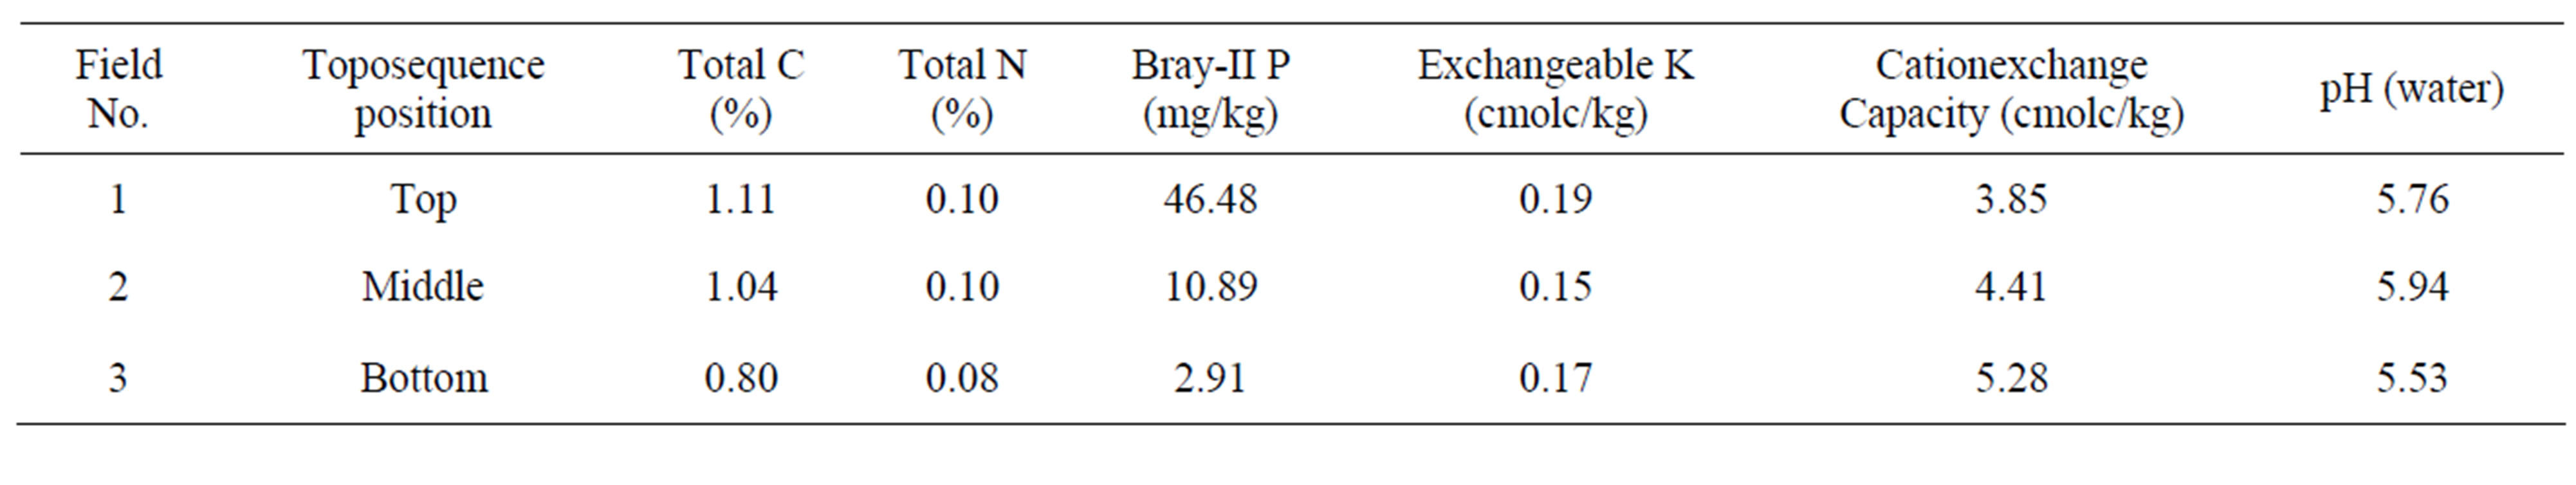
Table 3. Soil chemical properties of the experimental fields.
3.3. Surface and Groundwater
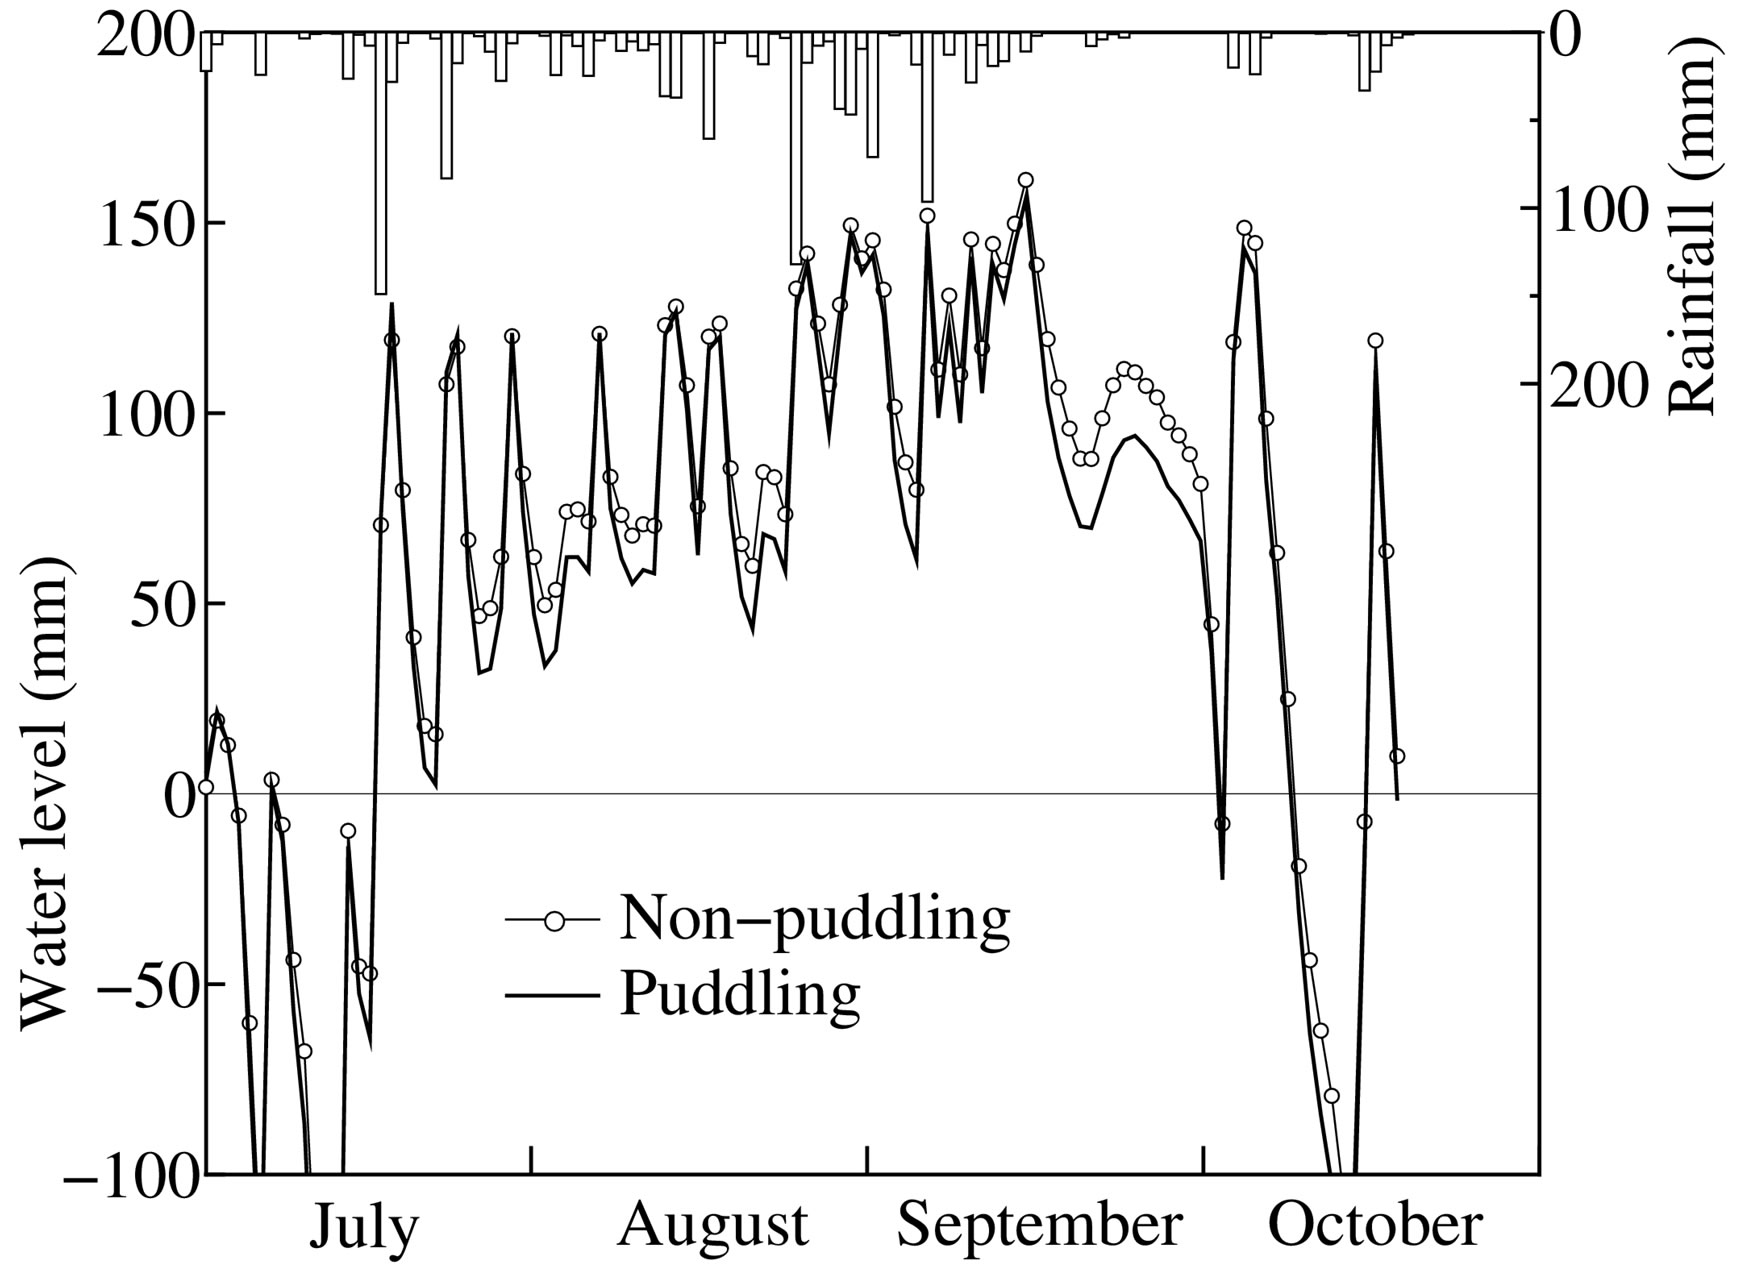
We measured ponding water depths with a ruler at several points in the plots and defined the average of these as the average water depth in the each plot. We converted the water level logger data to match the average water depth. We averaged 2 sets of non-puddling and puddling plots and obtained the daily water depth in the experimental plots (Figure 5). During July and October, when the rainfall is unstable, ponding water disappeared evenin the puddling plots, and the water level frequently dropped to less than 100 mm from the surface. These characteristics are quite different from those of an irrigation paddy area. A comparison of the water levels in the non-puddling and puddling plots revealed that the puddling plots had a higher water level than the non-puddling plots in the highest and lowest experimental fields No. 1 and No. 3, and the water level was higher in the non-puddling plots than in the puddling plots.
Days without ponding water and average water depth are shown in Table 4. The days without ponding water in
 (a) Field No. 1
 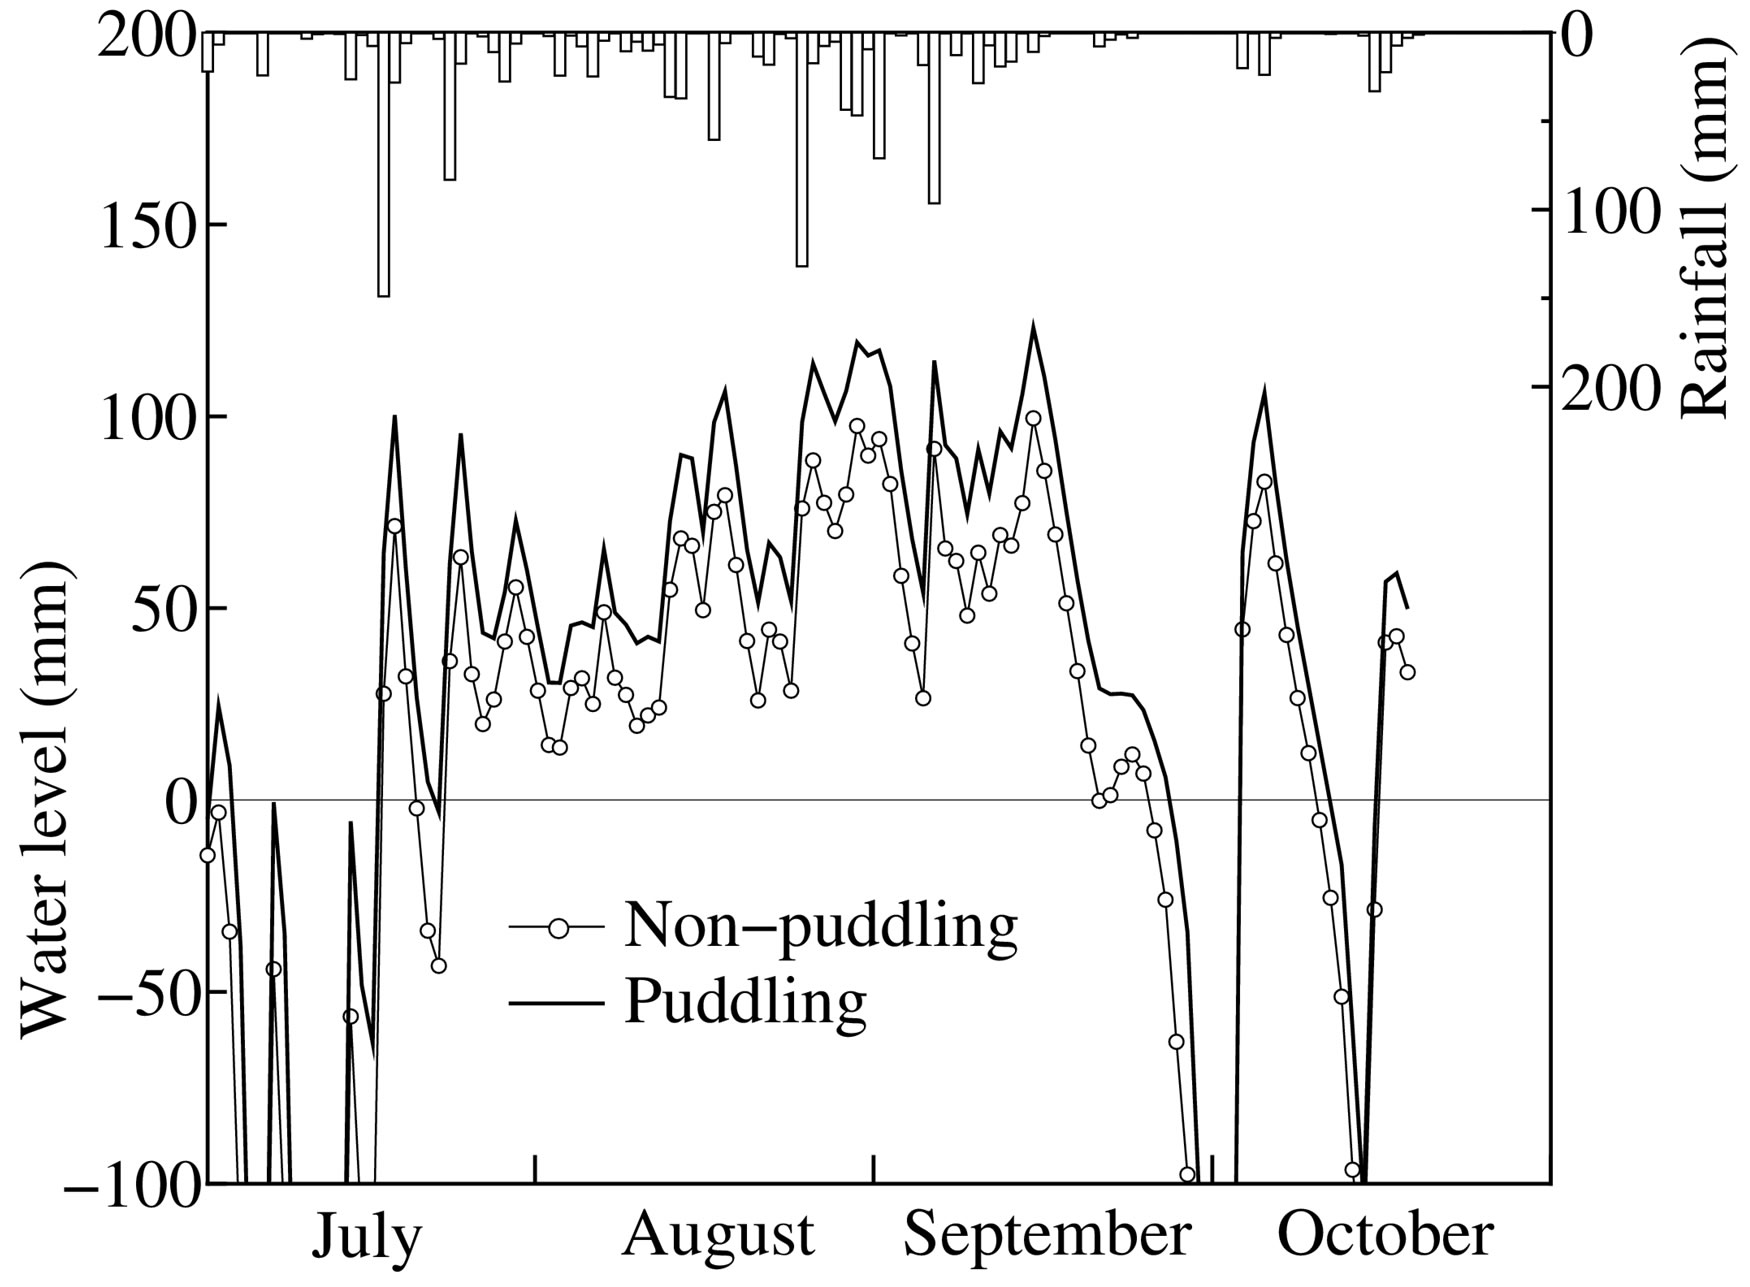 (b) Field No. 2
 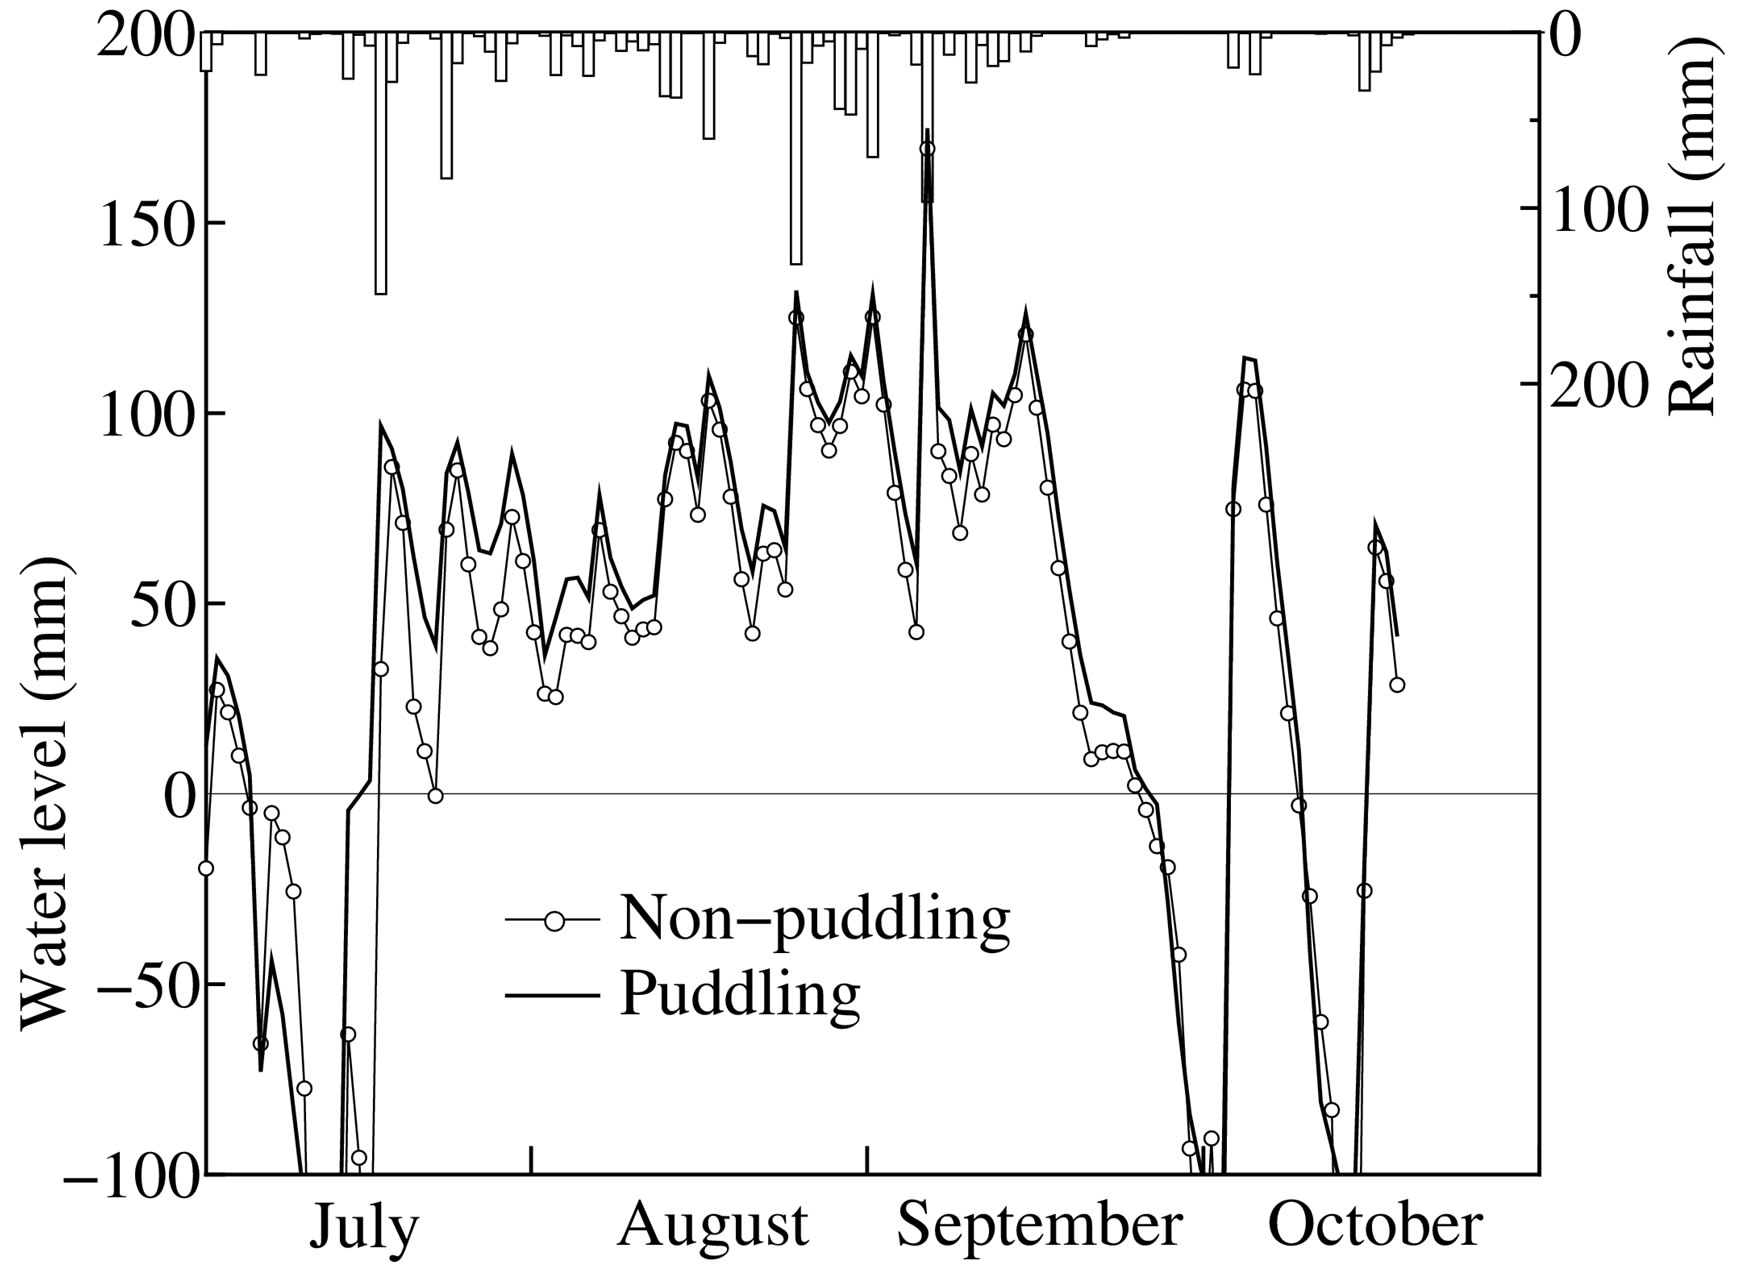 Field No. 3
Figure 5.Water level changes at the experimental fields.
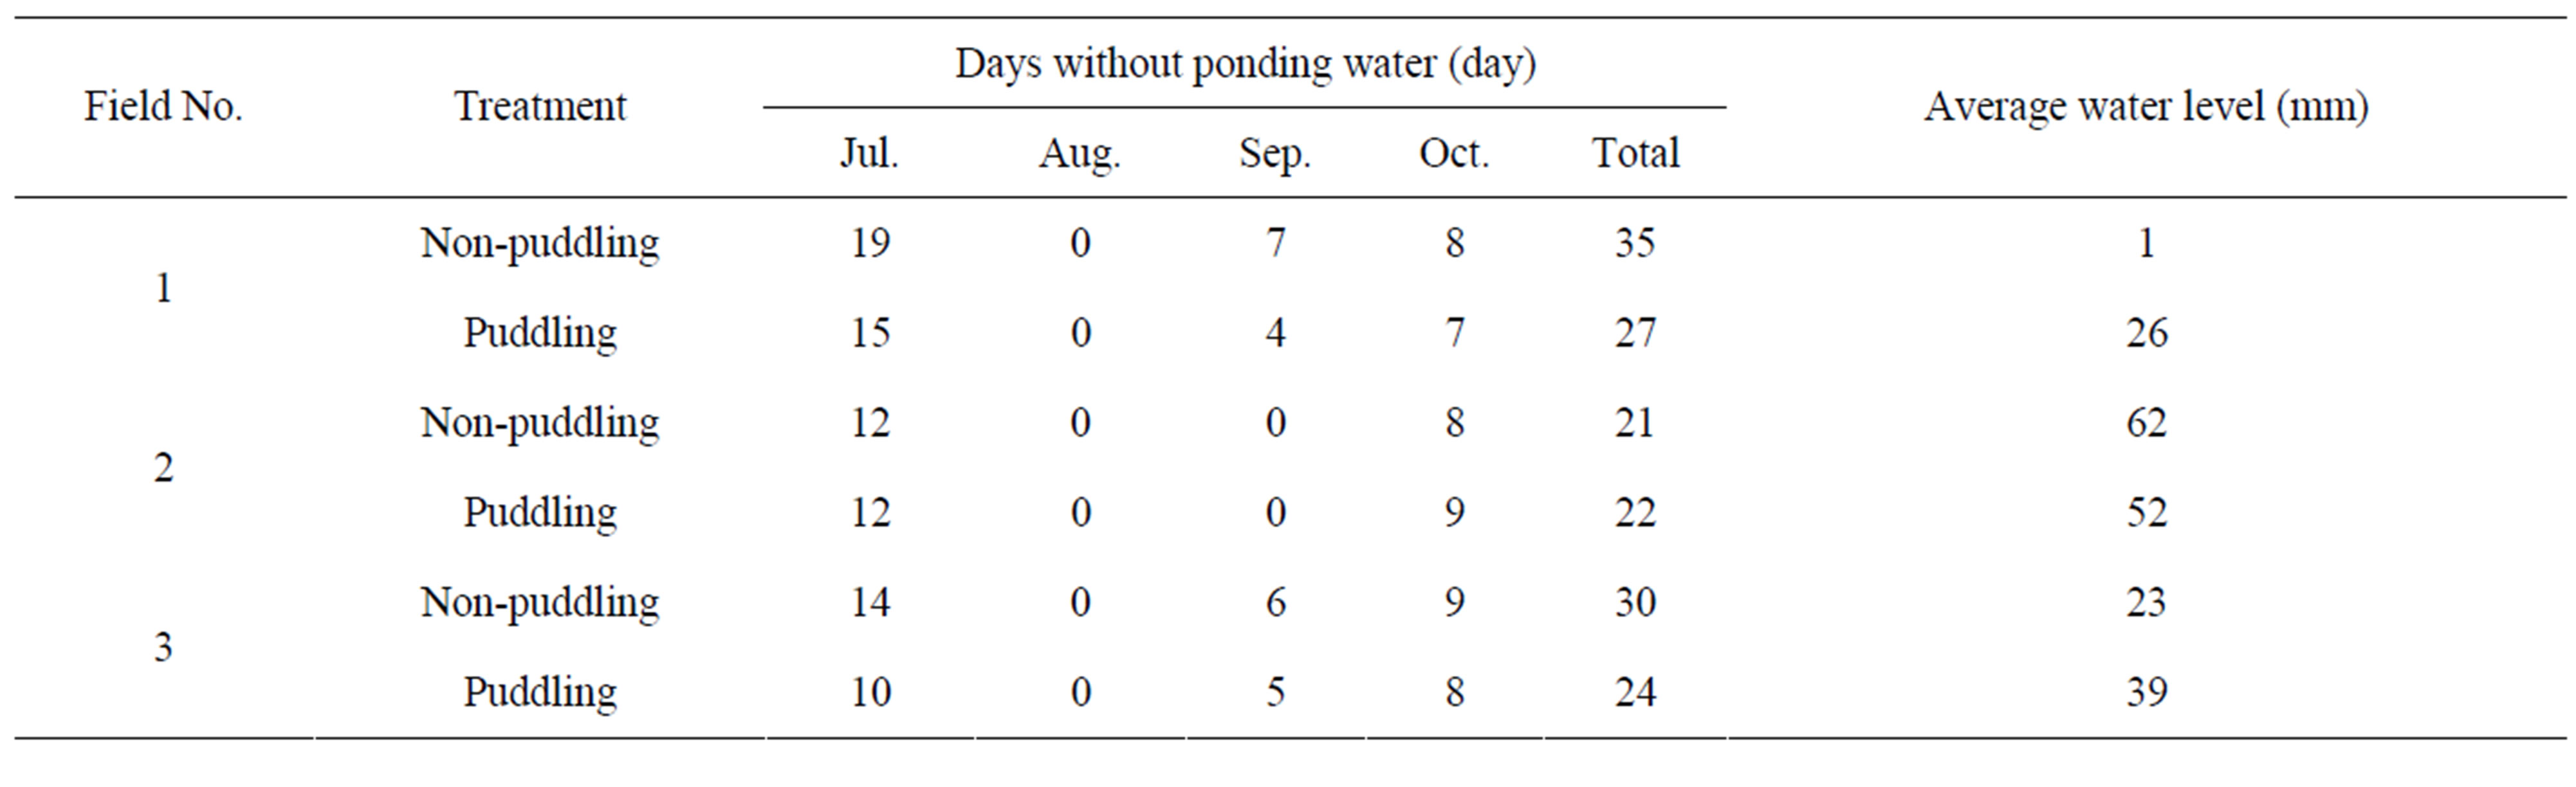
Table 4. Days without ponding water and average water level.
experimental fields No. 1 and No. 3 were 6 - 8 fewer in the puddling plots than in the non-puddling plots. There were 4 fewer days without ponding water in July, indicating that the ponding conditions in July, while transplanting was being conducted, were notably different. On the other hand, there were more days without ponding water in the puddling plots in experimental field No. 2. Average water levels showed the same trends as days with ponding water: in experimental fields No. 1 and No. 3 the water level was 16 - 25 mm higher in the puddling plots, whereas in field No. 2 the water level was higher in the non-puddling plots than in the puddling plots.
The ground water levels observed in each experimental field are shown in Figure 6. A water level of 0 mm means that the ground water has the same level as the surface in each field. Looking at this figure seasonally, we see that the ground water level dropped at the beginning of July, because of the continuous lack of rainfall, and was around or above the surface during August and September, and dropped again in October at the end of the rainy season. If we compare the differences among the three experimental fields, the ground water level in field No. 2 where no effects of puddling were seen was higher, while the ground water levels in No. 1 and No. 3 were similar. In the field with a high ground water level (No. 2), the water level in the paddy is governed by the ground water and no effects of puddling on water level or ponding days were seen. On the other hand, in the plots in the upper part of the site (field No. 1) and in the lower part of the site along the river (field No. 3), the effect of ground water is limited and the effects of puddling on percolation prevention were clearly observed.
3.4. Percolation
The percolation changes in each experimental field are shown in Figure 7. Looked at seasonally, the percolation is large at the beginning of the rainy season, when the ground water is low, and becomes dramatically larger at
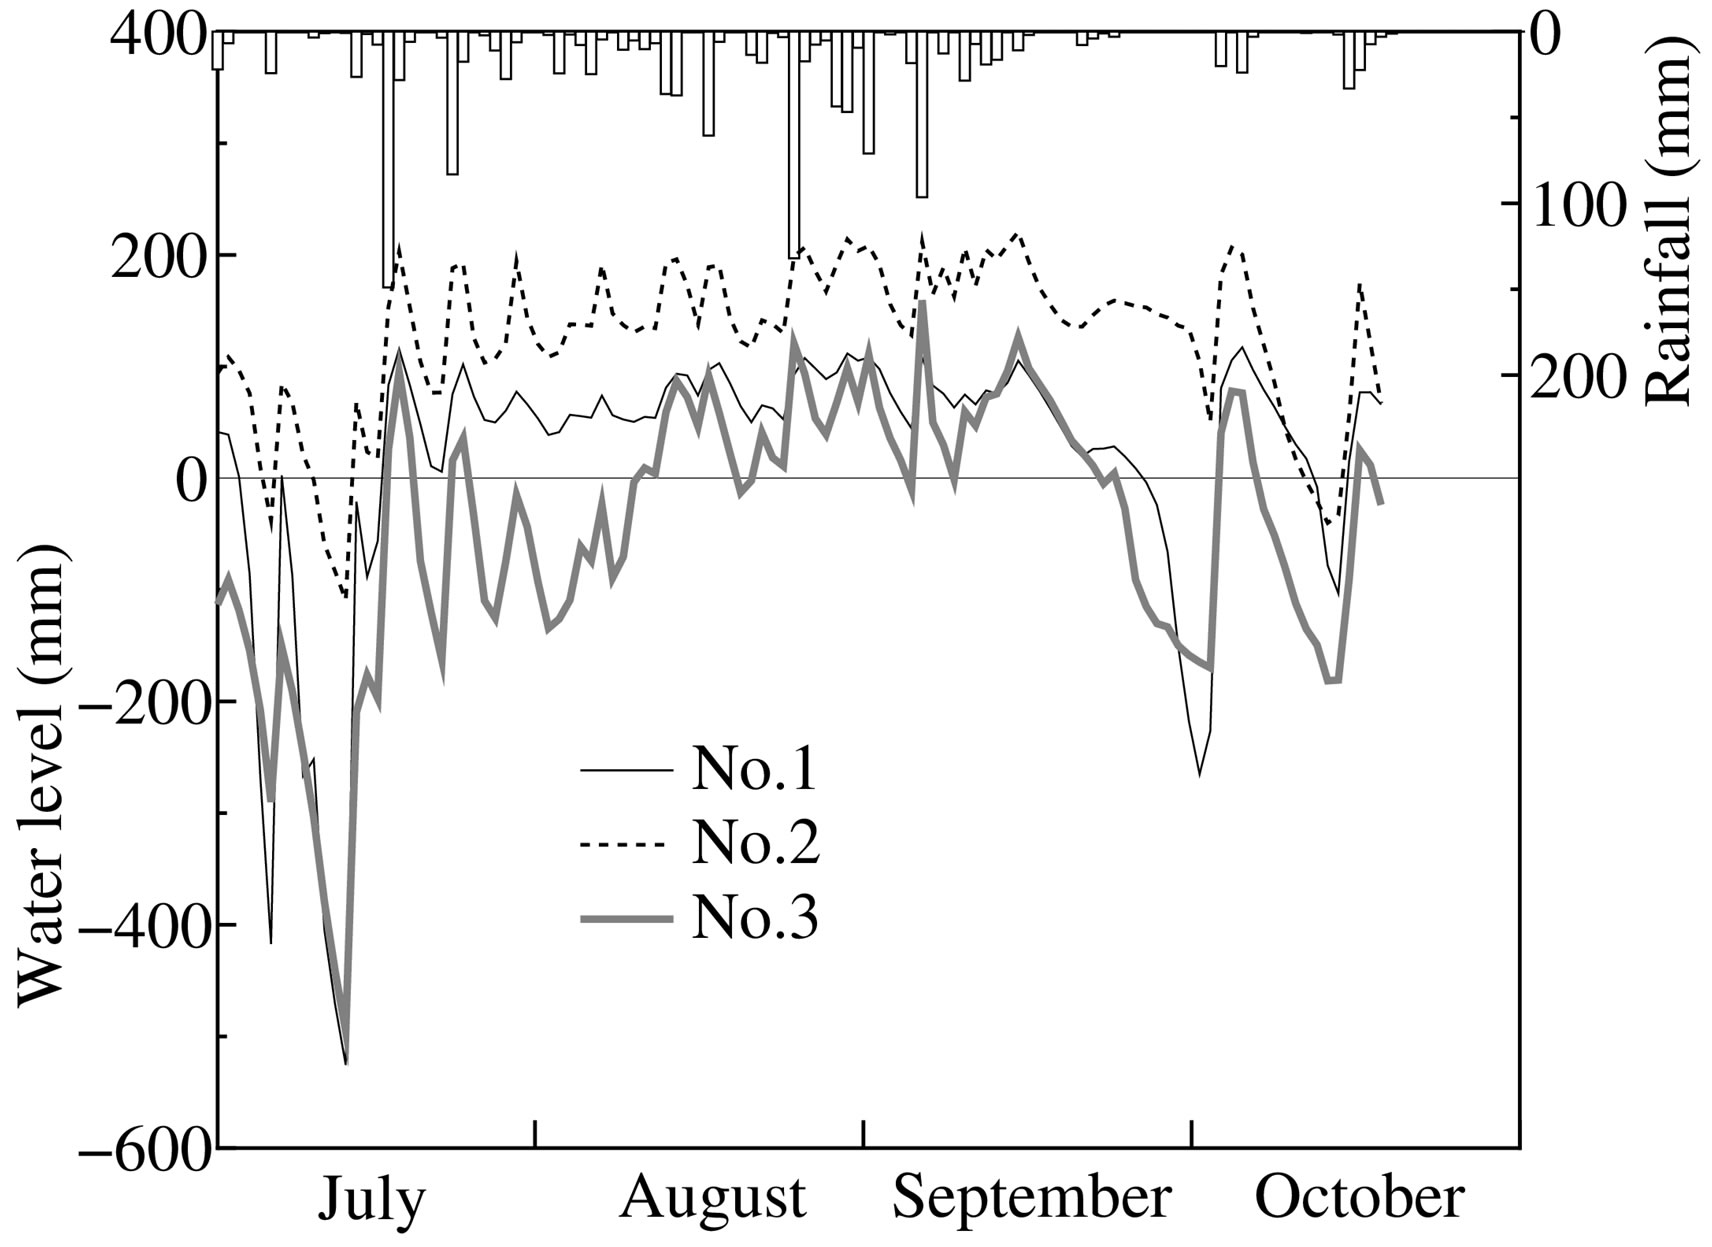
Figure 6. Ground water changes in experimental fields.
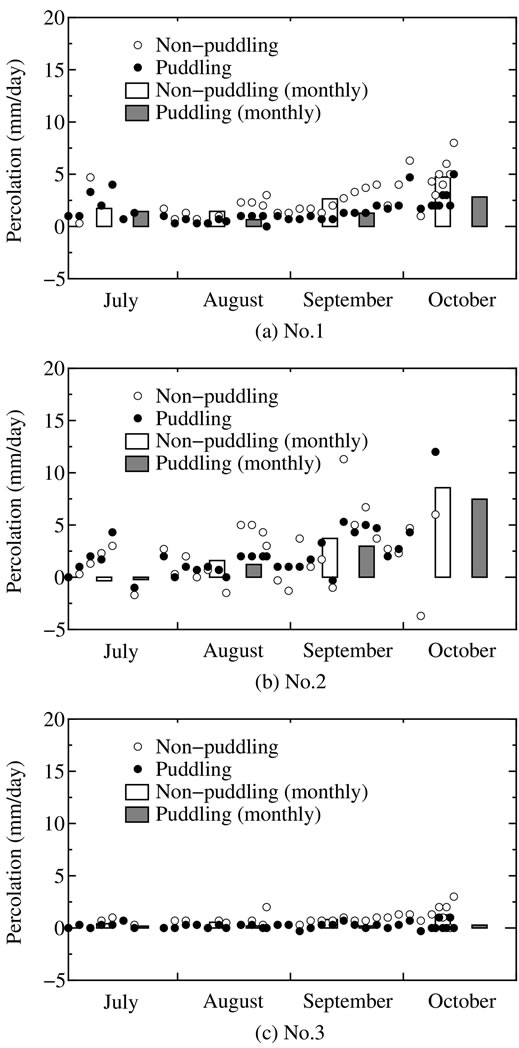
Figure 7. Percolation changes in experimental fields.
the end of the rainy season. The differences in percolation were strongly associated with the location: it was generally large in field No. 2, followed by field No. 1, which had the highest location, while the percolation in field No. 3, which had the lowest location, was generally small. This pattern agrees with that of the clay content in the three locations. Percolation was found to be largely dependent on soil texture. In experimental field No. 2, the percolation was sometimes negative, meaning that water welled up from the ground. The differences between treatments were small compared with the effects of the location of the experimental fields. However, the percolation in the puddling plots was generally less than in the non-puddling plots during all periods. The percolation in the non-puddling plots was 0.6 - 2.5 mm/day, compared with 0.2 - 2.1 mm/day in the puddling plots, indicating that percolation was averagely reduced by 32% in the latter plots. Thus, the percolation was lower in the puddling plots in all experimental fields, confirming the effects of puddling on percolation.
The water requirements for each field are shown in Figure 8. Rainfall data for the village were unavailable from September 13 to October 6, so data from this periodare not plotted on this graph. There are no seasonal changes in the water requirements, and the daily variations were clearly larger than the seasonal variations. In fields No. 1 and No. 3, the water requirement rarely became negative, but was positive in many cases. The losses through the bund were found to be large. On the other hand, in field No. 2 the water requirement was negative in many cases and the gains through the bund were quite large. We calculated the average water requirements during all periods. The water requirements of non-puddling plots were 17 - 18 mm/day, and the re-
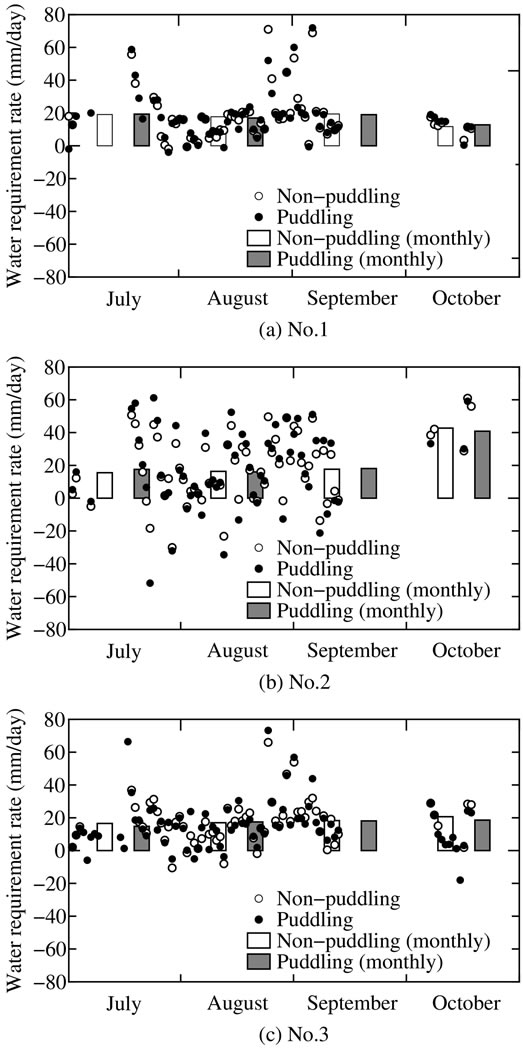
Figure 8.Water requirement changes in experimental fields.
quirements of puddling plots were also 17 - 18 mm/day; there was thus no difference between the treatments in this respect. Because the water depth is different in each field, and the days with ponding water are also different, the water requirements could not be calculated under the same conditions.
3.5. Yield
The heading dates showed no differences among the experimental fields, nor any differences between treatments: the date was September 19 - 21. The rice yields in each experimental field are shown in Figure 9. Rice yields were over 3 t/ha in experimental fields No. 1 and No. 2, but less than 2 t/ha in experimental field No. 3. The yield was mainly dependent on location and also showed an association with the available phosphorus, as shown in Table 3. However, there were no significant differences between non-puddling and puddling plots; the results show that the yields of puddling plots were in fact slightly lower than those of non-puddling plots. This means that there was no drought stress during this growth period, because there was no difference between yields when the transplanting was conducted on the same day. All these rice yields were higher than the average rice yields in the village (1.4 t/ha). This was because the soil in the experimental fields was more fertile than in other areas and the bunds in the experimental fields were stronger than in normal practice; other related factors probably also played a part.
4. DISCUSSION
In experimental field No. 2, where the ground water was high and inflow from the ground and through the bunds was observed, the effects of puddling on days without ponding water and on surface water level were not clear. However, it can be concluded that puddling is effective in reducing percolation, even in a rainfed paddy (Figure 7). The percolation at the end of the rice growing period reached a strikingly high level due to cracks or macro pores.
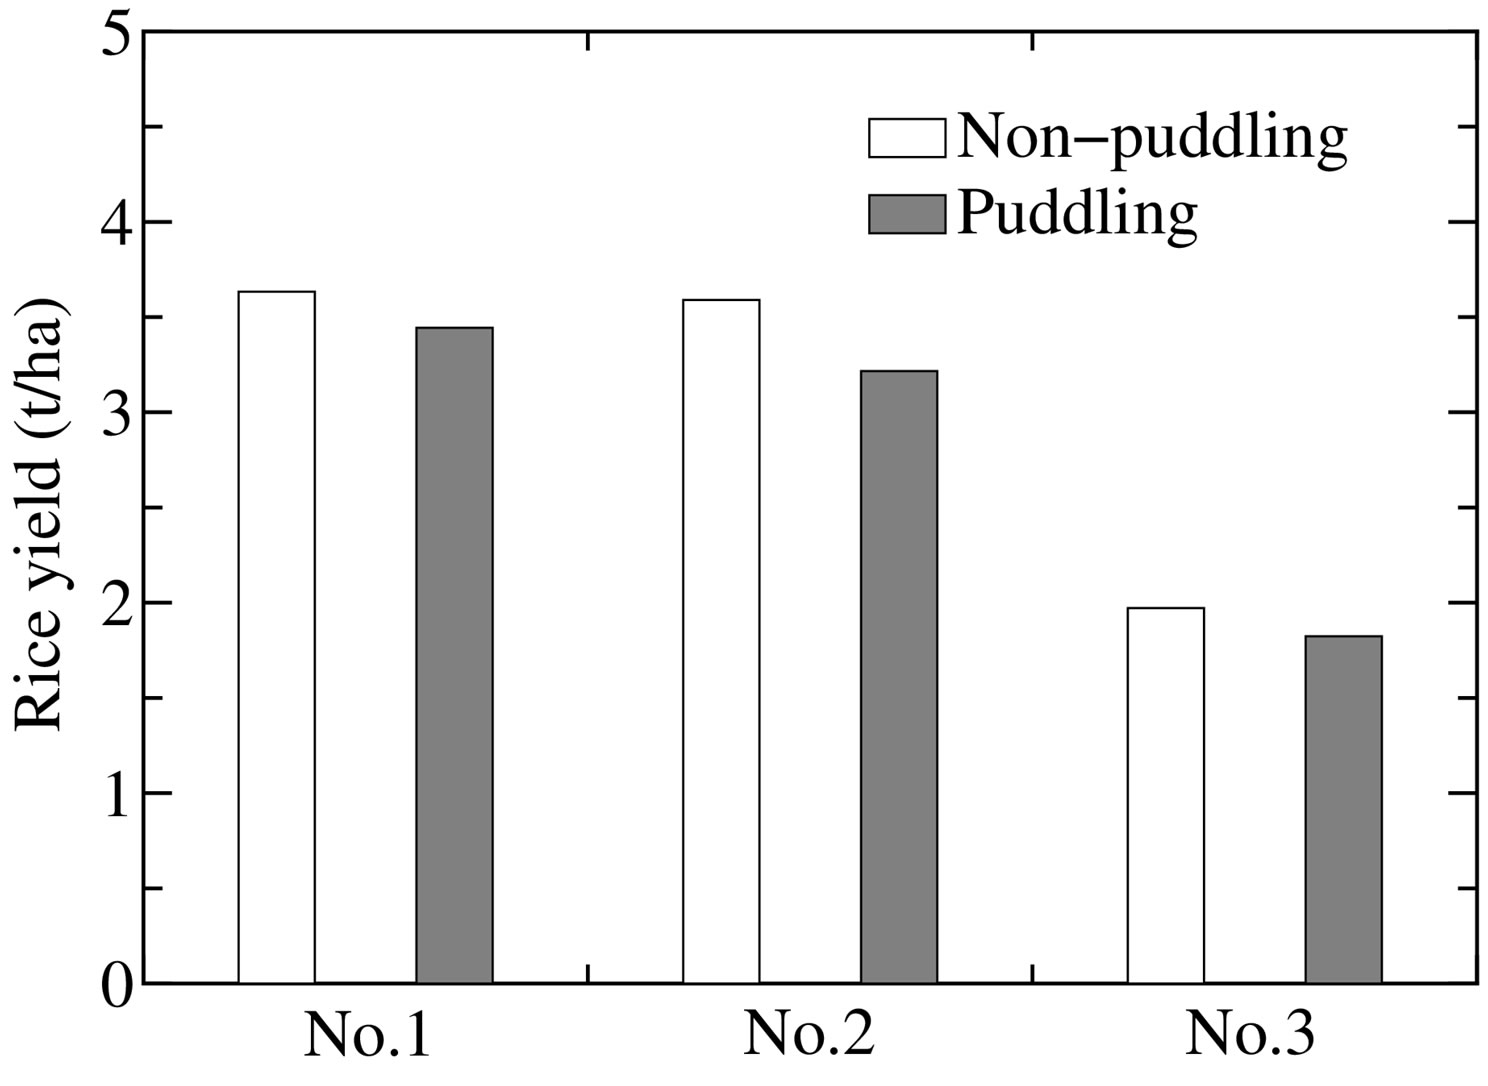
Figure 9. Rice yields.
Ponding water disappears frequently when the input from rainfall is low, even if puddling is conducted carefully. Puddling alone cannot be expected to overcome drought stress. On the other hand, there were large differences between the top and bottom fields (No. 1 and No. 3) and the intermediate field (No. 2) regarding the ponding days in July, while the puddling plots had 4 less days without ponding than the non-paddling plots (Table 3). If ponding water disappears in July, when transplanting is normally conducted, it is impossible to proceed with transplanting. The delay leads to a shortening of the growth period and consequently to a decrease in rice yields. For example, the first date that ponding water occurred in a non-puddling plot of experimental field No.1 was July 17, compared with July 2 in the puddling plot. Thus, one could say that the transplanting was delayed by 15 days as a result of the rainfall pattern in this study year. Multiplying those 15 days by the rice yield decrease rate (0.032 t/ha/day) gives an approximate difference of 0.5 t/ha, meaning that the average rice yield of 1.4 t/ha could be increased to 1.9 t/ha.
If the average rice yield of 1.4 t/ha was increased to 1.9 t/ha by conducting puddling, how would that translate into profit? Based on our interviews in the study village, it costs about 240,000 kip (about 24 USD) per 1 ha to do plowing or puddling by tractor. The price of rice in the village is 35,000 kip (about 3.5 USD) per 12 kg. The profit from 0.5 t rice is thus about 1,460,000 kip (146 USD). This greatly exceeds the costs of puddling, which would therefore appear to be certainly profitable.
Based on the results above, the effect of puddling on the possible transplanting date is larger than the reducetion of drought stress by prevention of percolation. Early transplanting prolongs the growth period, increasing rice yields, and the profit from the increase in yield outweighs the cost of puddling. However, effects on noponding days and water surface levels should not be expected in paddies where the ground water level is relatively high. Thus, puddling should not be conducted in all fields, but only in paddies where natural ponding water is insufficient.
5. CONCLUSTIONS
We investigated the effects of puddling on percolation and rice yields in rainfed lowland paddy fields. We selected a study village in Khammouane province, central Laos, and established non-puddling and puddling plots in sites that ranged from high to low positions. Puddling was found to reduce percolation in all fields. However, percolation increased drastically during the later periods of rice growth. Therefore, it is difficult to overcome drought stresses through puddling alone.
We also compared the water conditions of the nonpuddling and puddling plots. Even when puddling was conducted carefully, the ponding water in the fields disappeared in the case of low rainfall. In the puddling plots in the highest and lowest positions along a stream, the number of days without ponding water was less than that in the non-puddling plots, implying a potential difference in the transplanting date.
We tried to estimate the effects of transplanting date on the rice yields and found that transplanting 15 days earlier leads to an increase of 0.5 t/ha in the rice yields. Moreover, the profits from the increased yields are coniderably greater than the puddling costs, leading to a definite increase in income. Puddling has no effect in fields with high ground water, but can be effective in paddy fields where ponding does not occur to a significant degree.
6. ACKNOWLEDGEMENTS
This research was financially supported by a project administered by the Japan International Research Center for Agricultural Sciences (JIRCAS) titled “Intensification of water use and diversification of farm operations through farmer participatory approach in rainfed agriculture of Indochina”. We thank the National Agriculture and Forestry Research Institute (NAFRI) for helping our observations at the study site and the International Center for Tropical Agriculture (CIAT) for offering many useful comments on this study.
REFERENCES
- Maclean, J.L., Dawe, D.C., Hardy, B. and Hettel, G.P. (2002) Rice almanac: Sourcebook for the most important economic activity on earth. CABI Publishing, Wallingford.
- Wade, L.J., Fukai, S., Samson, B.K., Ali, A. and Mazid, M.A. (1999) Rainfed lowland rice: Physical environment and cultivar requirements. Field Crops Research, 64, 3-12. doi:10.1016/S0378-4290(99)00047-7
- Yamada, R. (2010) Agricultural structure and poverty in rainfed areas of central Laos. Journal of Agricultural Development Studies, 20, 50-57 (in Japanese).
- Suzuki, K., Goto, A., Mizutani, M. and Sriboonlue, V. (2003) Simulation model of rainfed rice production on sloping land in Northeast Thailand. Paddy and Water Environment, 1, 91-97. doi:10.1007/s10333-003-0017-0
- Tsubo, M., Fukai, S., Tuong, T.P. and Ouk, M. (2007) A water balance model for rainfed lowland rice fields emphasising lateral water movement within a toposequence. Ecological Modelling, 204, 503-515. doi:10.1016/j.ecolmodel.2007.02.001
- Miyagawa, S. (1997) Simulation of water uses improvement effect in rain-fed rice cultivation in Northeast Thailand. Japanese Journal of Tropical Agriculture, 41, 275- 285.
- Boling, A.A., Bouman, B.A.M., Tuong, T.P., Murty, M.V.R. and Jatmiko, S.Y. (2007) Modelling the effect of groundwater depth on yield-increasing interventions in rainfed lowland rice in Central Java, Indonesia. Agricultural Systems, 92, 115-139. doi:10.1016/j.agsy.2006.05.003
- Sharma, P.K., Ingram, K.T. and Harnpichitvitaya, D. (1995) Subsoil compaction to improve water use efficiency and yields of rainfed lowland rice in coarse-textured soils. Soil and Tillage Research, 36, 33-44. doi:10.1016/0167-1987(95)00499-8
- Adachi, K. (1992) Effect of puddling on rice physical: Softness of puddled soil on percolation. In: Asian Institute of Technology, Proceedings of International Workshop of Soil and Water Engineering for Paddy Field Management, Asian Institute of Technology, Bangkok, 220-231.
- Tabuchi, T. and Yamafuji, I. (1992) Effect of puddling on percolation rate and nitrogen concentration in percolating water. Journal of the Japanese Society of Soil Physics, 66, 47-54.
- Tuong, T.P., Wopereis, M.C.S., Marquez, J.A. and Kropff, M.J. (1994) Mechanisms and control of percolation losses in irrigated puddled rice fields. Soil Science Society of America Journal, 58, 1794-1803. doi:10.2136/sssaj1994.03615995005800060031x
- Ogura, C., Sukchan, S. and Narioka, H. (2007) Characteristics of precipitation in Nong Saeng Village, Khon Kaen Province, Northeast Thailand. Japan Agricultural Research Quarterly, 41, 325-332.
- Fujihara, Y., Oda, M., Horikawa, N. and Ogura, C. (2011) Hydrologic analysis of rainfed rice areas using a simple semi-distributed water balance model. Water Resources Management, 25, 2061-2080. doi:10.1007/s11269-011-9796-z
- Homma, K., Horie, T., Shiraiwa, T., Sripodok, S. and Supapoj, N. (2004) Delay of heading date as an index of water stress in rainfed rice in mini-watersheds in Northeast Thailand. Field Crops Research, 88, 11-19. doi:10.1016/j.fcr.2003.08.010
- Homma, K., Horie, T., Shiraiwa, T. and Supapoj, N. (2007) Evaluation of transplanting date and nitrogen fertilizer rate adapted by farmers to toposequential variation of environmental resources in a mini-watershed (Nong) in Northeast Thailand. Plant Production Science, 10, 488- 496. doi:10.1626/pps.10.488
- Hasegawa, T., Sawano, S., Goto, S., Konghakote, P., Polthanee. A., Ishigooka, Y., Kuwagata, T., Toritani, H. and Furuya, J. (2008) A model driven by crop water use and nitrogen supply for simulating changes in the regional yield of rain-fed lowland rice in Northeast Thailand. Paddy and Water Environment, 6, 73-82. doi:10.1007/s10333-007-0099-1