Low Carbon Economy
Vol. 3 No. 3 (2012) , Article ID: 22484 , 4 pages DOI:10.4236/lce.2012.33008
Dieselization and Road Transport CO2 Emissions: Evidence from Europe*
![]()
1NECE and University of Beira Interior, Management and Economics Department, Estrada do Sineiro, Covilhã, Portugal; 2University of Beira Interior, Covilhã, Portugal.
Email: acardosomarques@gmail.com; amarques@ubi.pt
Received June 11th, 2012; revised July 15th, 2012; accepted July 25th, 2012
Keywords: Road Transport; CO2 Emissions; Fuel Prices; Dieselization
ABSTRACT
Road transport carbon dioxide emissions were analyzed, by focusing on a panel of 14 European countries for the time span 1995-2007. We deal with the existence of contemporaneous correlation by using the Panel Corrected Standard Errors estimator. We extend the empirical literature by controlling the effect of new diesel passenger car registrations and the average power of those vehicles. The price of gasoline and income reduce road transport carbon dioxide emissions, while population density and average power of new diesel passenger cars raises those emissions. We deepen the debate about dieselization, concluding that saving emissions by using diesel tend to be surpassed by the increased kilometers driven.
1. Introduction
European countries have been expressing deep environmental concerns for some time and now play a leading role worldwide in the fight against pollution. To achieve this purpose, the European Union (EU) has been implementing environmental policies to counteract the degradation of the ozone layer and to bring the green house effect to an end. The EU has established directives for its member states in order to restrain and diminish the emission of greenhouse gases (GHG), namely carbon dioxide (CO2), chlorofluorocarbons, methane, nitric acid and ozone. Since CO2 is the major GHG released into the atmosphere (98% in 2007 for the EU15), it is essential to reduce its emissions in order to work against global warming and climate change. Substantial CO2 emissions originate in the transport sector (25% in 2007 for the EU15, excluding the international traffic departing from the EU) and almost all of this comes from road transporttation (93% in 2007 for the EU15). This large contribution makes this sector one of the largest polluters with respect to oil fuel combustion.
The road transport sector includes both motorcycles and automobiles. The latter consist of: 1) passenger cars (PC) (84.4% of the number of automobiles sold in 2007 for the EU15); 2) commercial vehicles (15.2%); and 3) buses and coaches (0.4%). Since PCs constitute the majority of automobiles on European roads, they play a crucial role in road transport CO2 emissions. As a consequence, the EU decided to make voluntary agreements with the automobile manufacturers’ associations, the ACEA [1] JAMA [2] and KAMA [3], in order to promote the decrease of the average CO2 emissions per km, by each new PC.
The literature regarding CO2 emissions from PCs brings to the fore a vast normative perspective, but it suffers from scarce empirical support. This paper contributes to the empirical evidence, focusing on the drivers of road transport CO2 emissions. Overall, the nature of drivers can be socio-economic, demographic, energetic, manufacturer or market. In particular, we work on the questions: 1) is dieselization actually reducing CO2 emissions released by PCs? And 2) how does GDP per capita influence CO2 emissions? The responses may define important policy measures to facilitate a reduction in road transport CO2 emissions. For this purpose, we use a panel dataset for thirteen years (1995-2007) from the EU15 (except Greece). These countries belong to Europe, which has been in the front line of the reduction of road transport CO2 emissions, and they are selected to fulfill the criteria of the longest time span with available data for drivers we control. In accordance with the common policies guidance from the EU, the econometric methods take into account the contemporaneous correlation.
We extend the literature on road transport CO2 emissions by: 1) showing the relevant role of the drivers of new diesel PC registrations per 1000 inhabitants, and the average power of new diesel PCs registered; 2) shedding light on the debate of the pros and cons of dieselization; 3) discussing the importance of car sharing and the use of public transport in the reduction of CO2 emissions; and 4) applying panel econometric techniques that cope well in the presence of common political guidance.
The paper is organized as follows: the second section consists of a literature review, the third presents the data and methodology used in this work. Section 4 provides the results obtained, the fifth section discusses those outcomes and section 6 concludes.
2. Literature Review
In a modern society, CO2 emissions are generated by numerous sectors. Energy industries, manufacturing, construction, transport and other sectors, like comercial/institutional, residences, agriculture/forestry/fishery, all contribute to environmental damage. According to the source of CO2 emissions, different literature is applied and several methodologies can be found. The literature on road transport CO2 emissions, particularly from PCs, evolves according to two main perspectives: 1) the normative; and 2) the empirical. The normative focuses on the analysis of CO2 emissions, considering both characteristics and fleet composition of PCs [4]. The empirical perspective includes several techniques, namely the decomposition analysis of CO2 emissions [5], and the panel data approach [6]. The influence of the various vehicle characteristics on the changes in CO2 emissions from PCs was analysed by [5], in Greece and Denmark between 1990 and 2005. In their turn, Ryan et al. [6] focused on the relationship among variables like fuel price, vehicle taxes, income and population density.
As noted by Stead [7], PCs using different fuel types release different amounts of CO2. Indeed, the average diesel PC releases smaller quantities of CO2 per km in comparison to the average gasoline car [8]. A diesel engine consumes 20% to 30% less fuel per km than a gasoline engine equivalent [9]. Nevertheless, while consuming 20% less, it only releases 9% fewer grams (g) of CO2 per km than gasoline engines [10]. Apart from the fuel economy of diesel PCs, as Pock [11] pointed out, diesel cars have also been upgraded, namely in comfort and driveability, and their retail price is lower in relation to gasoline cars in most European countries. This has all contributed to the trend known in Europe as dieselizetion, which consisted of a sustained diesel market growth. On the one hand, authors such as Fontaras and Samaras [12] and Cuenot [13], connect dieselization to a reduction in CO2 emissions, as a consequence of the increased fuel efficiency of diesel engines. On the other hand, recent literature minimizes the impact of this trend in reducing CO2 emissions, because of the higher distance travelled by diesel PCs [14]. This phenomenon of longer trips taken by diesel PCs deserves further analysis.
Diesel PCs release inferior average CO2 emissions per km than gasoline cars, when travelling the same distance. Nevertheless, as Schipper [14] points out, these type of vehicles in Europe travel 40 to 100% more than their gasoline counterparts, namely since most taxi drivers, salesmen and businessmen use them. For example, in 2005, in France diesel PCs were driven 64% further than gasoline ones and, in Germany, 80% more [15]. Also in Denmark, in 2007, Papagiannaki and Diakoulaki [5] mentioned that diesel cars travelled twice as far as gasoline PCs.
As stated earlier, the increasing demand for diesel is due to its lower retail price compared to gasoline in most European countries. This asymmetry is a consequence of the lower taxation applied to diesel, which results partly from the professional transport sector lobby, as noted by Pock [11]. Moreover, this author points out that, in the short run, higher fuel prices decrease vehicle use, while in the long run, they cause a reorganization of the PC fleet to more efficient gasoline cars and diesel ones. In the former case, this is true since diesel price and diesel PC ownership expenses are reasonably low. Therefore, in the long run, given the correlation between fuel consumption and road transport CO2 emissions [6], as the former decreases, so CO2 emissions diminish. Such fuel consumption reduction is directly caused, on the one hand, by fewer kilometers driven in the long run [16,17] and, on the other hand, by lower speeds on roads. In fact, fuel consumption diminishes as more drivers circulate at optimum speeds [18]. All these consequences of high fuel prices arise from its impact on families and individuals’ income.
When there are higher incomes, two opposite behaviors can arise. According to Storchmann [19], in the short run, individuals tend to drive more, increasing road transport CO2 emissions. In contrast, over time buyers have greater opportunity to acquire powerful vehicles, but also better equipped with regard to fuel efficiency and technology [18]. Hamilton and Turton [20], when studying GHG emissions in OECD countries from 1982 to 1997, and Hatzigeorgiou et al. [21], when analysing CO2 emissions in Greece between 1990 and 2002, pointed out GDP as the greatest contributor to CO2 emissions. Nonetheless, Tapio et al. [22] noted that in the EU15 countries, from 1960 to 2000, GDP growth decoupled from energy use and, therefore, from CO2 emissions. Another socio-economic factor affecting CO2 emissions is population. Although it makes a positive contribution to road transport CO2 emissions, its effect is not very noteworthy due to the small variations in population figures over time [5]. Nonetheless, it is worthwhile mentioning that increasing population density reduces the number of gasoline PC [6], favouring the use of diesel cars.
Another contributor to road transport CO2 emissions is PC power, which is highly correlated with PC weight. Zervas [4] reported a rise in the average maximum power of both gasoline and diesel cars, from 1995 to 2003, as a result of the improved combustion efficiency. The increase in PC weight and power were in part a result of dieselization [10]. Diesel PCs have experienced a greater growth in power than gasoline ones. Since diesel PCs had to find more torque to increase their power/weight ratio in comparison to gasoline cars, they became more powerful. As a consequence, fuel consumption and CO2 emissions also increased, counteracting the advance of technological standards in fuel efficiency. Regardless of the technical aspects, the last word about the average power of PCs, as Bonilla [18] points out, belongs to consumers, whose preferences when buying a new PC depend on their income.
The greater demand for diesel in Europe produces, however, a negative outcome in the whole CO2 emissions, because it generates inefficiency in the entire fuel supply chain. Indeed, the adjustment of European refineries to the production of diesel causes an increase in CO2 emissions due to higher energy loss. Exportation of gasoline and importation of diesel associated with the lower and higher demand, respectively, of the European PC fleet increases CO2 emissions due to international transportation [23].
In the EU, most decisions aimed at reducing CO2 emissions have a common guidance. To the best of our knowledge, the scarce empirical literature on road transport CO2 emissions has not yet taken into account the possible existence of contemporaneous correlation between the EU countries as a result of the similar policies measures taken in all member states. To that extent, apart from the variables mostly suggested by literature (GDP per capita, population density, and gasoline price), we control for the effect of new diesel PC registrations and average power of new diesel PCs registered on road transport CO2 emissions. The next section describes the data, method and estimation process.
3. Data and Methods
In order to select the appropriate methodology that will give us a full understanding of the object on which we are focused, we must have a thorough understanding of the available data. In this section we present the data, their sources and main characteristics, as well as pursuing a discussion about the methodological choices.
3.1. Data
Data from the year 1995 to 2007 were used, for a panel of 14 EU member states: Austria, Belgium, Denmark, Finland, France, Germany, Ireland, Italy, Luxembourg, the Netherlands, Portugal, Spain, Sweden and the United Kingdom. Greece was excluded for lack of data. Due to the inexistence of data prior to 1995 and subsequent to 2007 for some of the variables, the maximum time span was ascertained (1995-2007). Furthermore, because the remaining countries of EU27 only offer data from 2000 for some variables, we had to limit the study to EU15, except Greece. Otherwise, the actual period of thirteen years (1995-2007) would be only eight years (2000- 2007). Although the number of observations is not exactly the same for all countries, missing values are few, isolated, and purely random. Therefore, we can apply the estimators in our unbalanced panel without causing inconsistency in these estimators.
The main goal of this paper is to make an empirical evaluation, for a panel of 14 European countries, of the explanatory power of several variables over the following dependent variable: road transport CO2 emissions (CO2ROAD). The explanatory variables for understanding the course of CO2ROAD are in accordance with the literature. GDP per capita and population density are important socio-economic drivers of CO2ROAD due to their influence on the PC fleet composition and on the number, frequency, length and speed of journeys. The price of gasoline is highly correlated with the price of diesel, allowing us to control for the impact of energy pricing on CO2ROAD. New diesel PC registrations per 1000 inhabitants enable us to understand the conesquences of dieselization on CO2ROAD. New diesel PC average power, as one of the three major vehicle characteristics (power, weight, engine capacity), allows us to control for the influence of manufacturer drivers on CO2ROAD.
GDP per capita (GDPPC). Income produces two opposite outcomes in families and individuals’ behaviours. On the one hand, a positive signal is observed when higher incomes lead both to increasing the propensity to drive more [19] and to buying powerful vehicles, contributing towards raising CO2ROAD. On the other hand, a negative signal is identified when higher incomes allow individuals to acquire PCs with more advanced fuel efficiency technologies [18]. The final signal depends on the dominance of these two opposite effects.
Population density (POPDENS). The literature suggests that population influences positively CO2ROAD. The influence is generally low, because over time population does not suffer significant changes [5]. POPDENS has an effect on the PC fleet, since the number of gasoline cars diminishes when POPDENS increases [6]. This effect produces an outcome on CO2ROAD. In accordance, we control for this variable, expecting that large POPDENS will contribute to greater CO2ROAD.
Gasoline price (PRICEG). Energy prices infer on consumer behaviours and preferences, because:
Their available incomes become affected. As a result of high fuel prices, drivers may decrease their fuel consumption travelling at optimum speeds [18]. Moreover, in the long run, the distances travelled may be reduced [16,17] and car owners tend to replace gasoline cars with more fuel efficient ones or with diesel ones [11]. Most PCs worldwide are propelled through gasoline or diesel combustion. PRICEG and diesel price are highly correlated, which prevents their simultaneous use in the estimation, in line with the collinearity concerns. We control for PRICEG, given that it is commonly used in the empirical literature [11,16,17]. A negative relationship is expected between this variable and the CO2ROAD.
New Diesel PC registrations per 1000 inhabitants (DIESCAR). DIESCAR is used to measure the level of dieselization. As discussed before, the literature suggests two opposite effects regarding dieselization. On the one hand, one could expect a negative signal to CO2ROAD, given that, comparatively, diesel PCs emit lower average CO2 emissions per km [12,13]. On the other hand, a positive signal could be expected due to the larger distances travelled by diesel PCs [14] and thus, dieselization may induce the increase of CO2ROAD. This divergence in the contribution of DIESCAR to CO2ROAD, makes it relevant to identify whether the predominant effect is negative or positive.
New Diesel PC Average Power (AVPOWERD). AVPOWERD corresponds to the average power of new diesel PCs registered in one country for a year. A strong increase in AVPOWERD was observed from 1995 to 2007 [3,24]. Following the literature, we control for AVPOWERD. Since more power requires more fuel consumption ceteris paribus, a positive signal for AVPOWERD is expected in explaining CO2ROAD.
Table 1 shows the variables, their sources and descriptive statistics.
3.2. Methods
With regard to CO2ROAD, within the EU several policy measures have been taken, which impact on all member countries. One example is the mandatory agreement with the automobile manufacturers’ associations to achieve the average emission released by new PCs of 120g of CO2 per km by 2012 [24]. As noted by De Filippis and Scarano [25], a genuine cultural orientation in Europe has led to a continuous fight against GHG emissions.
Both this common guidance for the automobile manufacturers’ associations from the EU and the strong connection between the policies of their member countries have led to the belief that there is contemporaneous correlation. Thus, this phenomenon arouses the need to use the adequate estimators.
We proceed to analyse the structure of the panel data, which may incorporate error terms with complex composition. To do so, we make a first visual inspection of the data. After that, we test for the presence of three main phenomena: heteroskedasticity, panel autocorrelation and contemporaneous correlation. We carry out econometric analysis using the Stata 11.
The visual inspection of the correlation matrix suggested that the concurrent use of the variables is far from a concern (Table 2).
Indeed, the correlation coefficients signal the absence
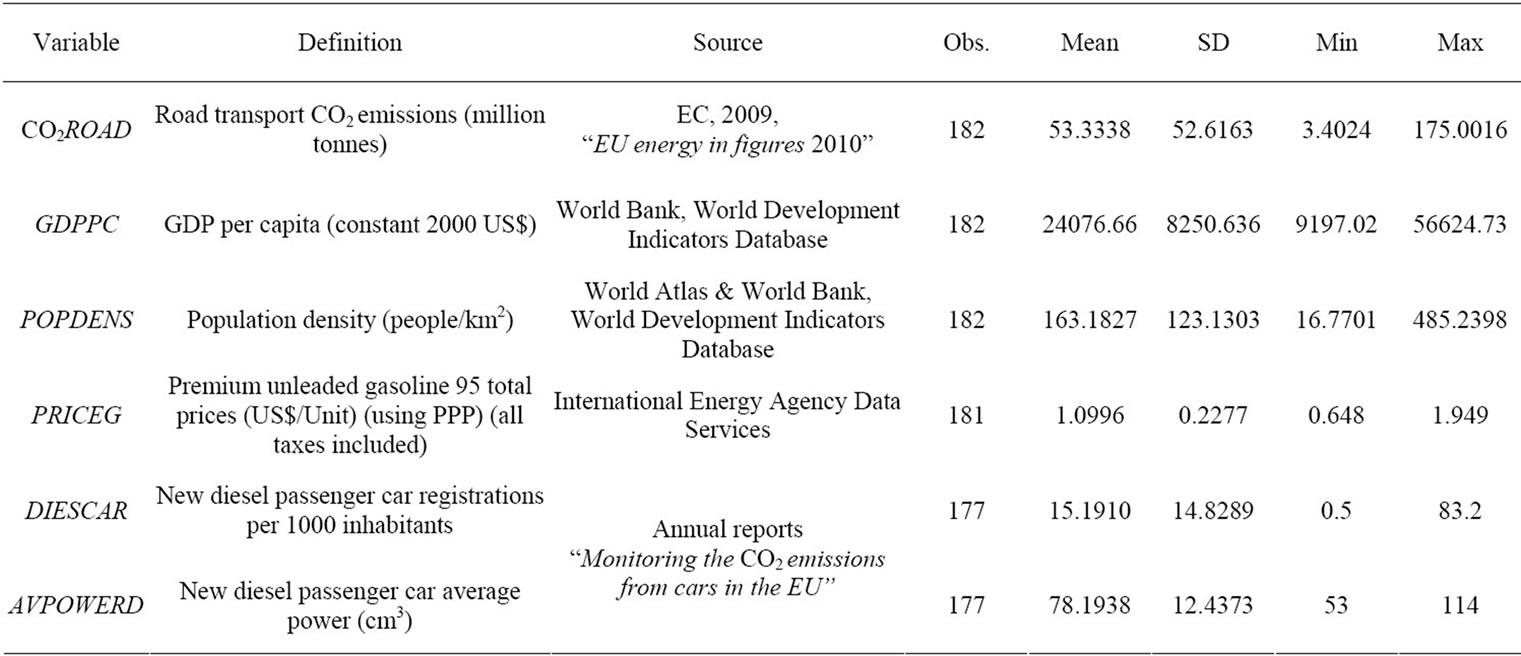
Table 1. Variables, sources and descriptive statistics.
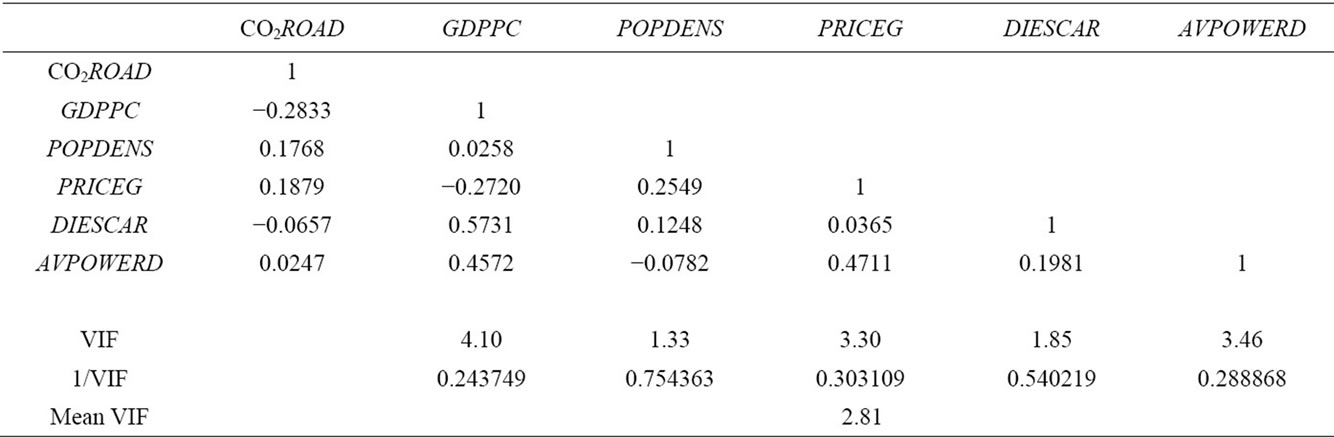
Table 2. Correlation matrix and Variance Inflation Factor (VIF).
of collinearity among variables. Despite this evidence, in order to solve any remaining doubt about collinearity, we also analysed the Variance Inflation Factor (VIF) test for multicollinearity. Both the mean VIF of 2.81 and the low values for the individual VIF reveal that collinearity is, in fact, not a problem.
After this preliminary analysis of the nature of the data, we advance by testing the presence of heteroskedasticity and panel autocorrelation. The existence of groupwise heteroskedasticity is tested through the modified Wald statistic test [26] in the residuals of a fixed effect regression. The presence of serial correlation is appraised by providing the Wooldridge test. Ultimately, the presence of countries’ independence is tested by applying both the parametric testing procedure proposed by Pesaran [27], and the semi-parametric test proposed by Frees [28,29], either to random effects or fixed effects. Once the presence of these phenomena has been established, the common panel data estimators, random effects (RE) and fixed effects (FE), lead to inefficiency in coefficient estimation and to bias in the standard errors. As a conesquence, the appropriate estimators are the Feasible Generalized Least Squares (FGLS) and the Panel Corrected Standard Errors (PCSE). However, given that the number of periods is smaller than the number of countries, the appropriate estimator to handle panel-level heteroskedasticity and contemporaneous correlation is the PCSE [30].
The general model to estimate is:
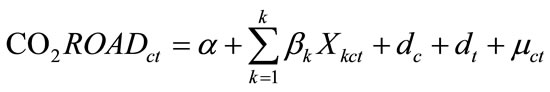 (1)
(1)
with ηct being serially uncorrelated, but correlated over countries, the error term is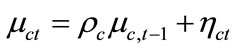 . Dummy variables dc and dt relate to country and time, respecttively. As pointed out by Cameron and Triverdi [31], the PCSE estimator permits; 1) first-order autoregressive models for
  to be employed over time, 2)
  to be correlated over countries; and 3)
  to be heteroske dastic. The specification tests and the estimation results are presented in the following section.
4. Results
The specification tests summarized in Table 3 are crucial to correctly defining the best-suited estimator to proceed to our analysis. The presence of heteroskedasticity, panel autocorrelation and contemporaneous correlation was appraised.
The modified Wald statistic reveals that the errors exhibit groupwise heteroskedasticity, while the Wooldridge test leads to the rejection on the null of no first-order autocorrelation. Regarding the assessment of contemporaneous correlation, both for random and fixed effects, the Frees test strongly suggests the refection of the null hypothesis of cross-sectional independence. Simultaneously, the evidence from the Pesaran test is not so strong, i.e., the null hypothesis is rejected for the fixed effects regression model only with a 10% significance level. In sum, the specification tests suggest that our panel reveals that there is: 1) heteroskedasticity, probably as a conesquence of differences in the countries on CO2ROAD; 2) autocorrelation of order one; and 3) contemporaneous correlation across the countries, although in the Frees test the null of countries independence is strongly rejected.
In order to cope with the presence of these phenomena, we use the PCSE estimator given that in our panel data
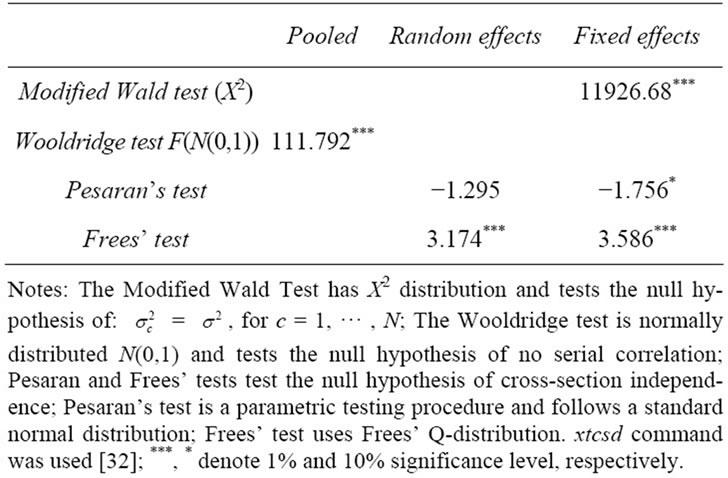
Table 3. Specification tests.
the number of countries is larger than the number of periods. This estimator turns out to be adequate both in thepresence of panel-level heteroskedasticity and contemporaneous correlation, and in finite cases performs better than the asymptotically efficient FGLS [33]. Moreover, in order to check the robustness of the results achieved with the PCSE estimator, we follow two options. The first one is to apply the common panel data estimators, RE and FE. Results accomplished with the PCSE estimator are robust if the other models, such as RE and FE estimators, return different results. In that case, it seems that there is inefficiency in coefficient estimation and biased standard errors, by using the common panel data estimators. The second one is to test various assumptions about the variance across countries and serial correlations. If the results remain in essence unchanged, then the option of using the PCSE estimator is strengthened.
We start by estimating a pooled OLS model (model I) and then we work upon a panel data structure by applying the RE (model II) and FE (model III) estimators. For the models 1 to 3 the error term in Equation (1) is . We assume that regressors are uncorrelated with μct and allow Xct to be correlated with the time-invariant element of the error, ηc. After that, we estimate the model presupposing the various assumptions, as follows: model IV—correlation over countries and no autocorrelation; model V—country-level heteroskedastic errors and common first-order autoregressive error (AR1); model VI—correlation over countries and autocorrelation AR(1); and model VII—correlation over countries and autocorrelation country-specific AR(1). Table 4 shows the results.
The results in Table 4 show that there are no changes in the signal of the estimated coefficients. Overall, we can only observe changes in the level of significance, namely when comparing the common panel data estimators, RE and FE, with the panel data estimator PCSE, which is indeed an expected outcome, given the presence of contemporaneous correlation in our panel. In fact, in line with what was pointed out by Reed and Ye [30], this evidence could come from the inefficiency in coefficient estimation and biased standard errors when we use these common panel data estimators, under the scenario of no cross-sectional independence.
In order to deepen the consequences of unseemly use of inefficient estimators in the presence of contemporaneous correlation, we additionally provide two exclusion tests for the variables that RE and FE estimators suggest as playing a non-relevant role in explaining the CO2- ROAD, i.e. the variables DIESCAR and AVPOWERD.
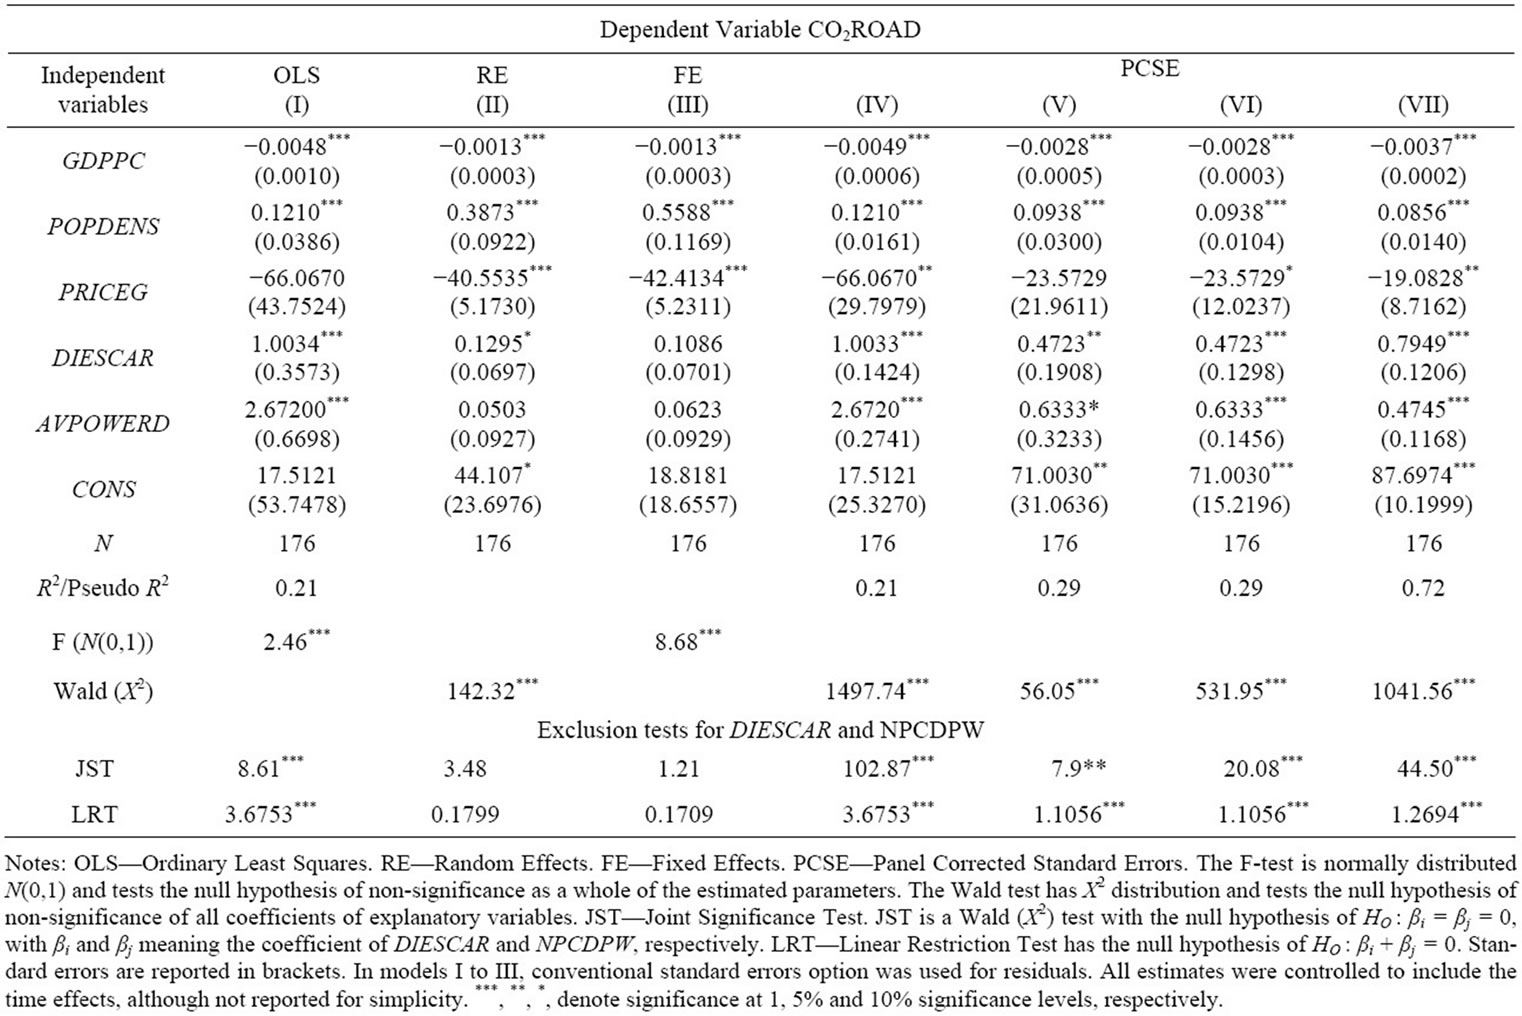
Table 4. Estimation results.
We provide the Joint Significant Test (JST) for all the estimated models. Only for the common panel data estimators do we not reject that null that both coefficients of these variables are equal to zero. In other words, DIESCAR and AVPOWERD together must be retained as explanatory variables, in contrast to what the inefficient estimators RE and FE suggest. Moreover, the same evidence is achieved when we apply the Linear Restriction Test (LRT) of the coefficients. For all models, except for the RE and FE estimators, we strongly reject that the hypothesis of the sum of the coefficients of DIESCAR and AVPOWERD is zero.
As shown, the PCSE estimator proves to be appropriate to meet the nature of our panel data, so they are thereafter the reference models, namely model VII. In this model we assume both correlation over countries and country-specific first-order autocorrelation. The results support the negative effect of the GDPPC on the CO2ROAD. The effect of POPDENS on CO2ROAD is highly statistically significant, and is positive. The larger the POPDENS, the larger the CO2ROAD will be. In general, the results show that there is a negative and statistically significant relationship between PRICEG and CO2ROAD. Both DIESCAR and AVPOWERD favour CO2ROAD. That relationship is, in fact, positive and statistically significant.
5. Discussion
It is worthwhile emphasizing that models I to III do not entirely follow the specification tests from Table 3. They are estimated as an indicator of robustness of the results achieved from the PCSE estimator (models IV to VII). The former are the reference models for discussion, namely model VII, where we assume both correlation over countries and autocorrelation AR(1) which is country-specific.
The negative and highly statistically significant relationship between GDPPC and CO2ROAD suggests that a rise in income does not imply more CO2ROAD. Nevertheless, in the short run, higher income allows greater distances to be driven [19] and powerful vehicles to be bought, increasing CO2ROAD, it also enables consumers to buy PCs with better advanced fuel saving technologies [18]. Moreover, with higher income, the recurrent replacement of PCs is more likely to happen, bringing more fuel efficient PCs to the existing fleet at a faster pace. In this way, there is a double contribution to decreasing CO2ROAD. Our results do not contradict those of Tapio et al. [22], who, when addressing the EU15 countries between 1960 and 2000, pointed out that economic growth no longer means increasing energy use and, thus, CO2 emissions.
Our results show a positive and highly statistically significant relationship between AVPOWERD and CO2ROAD. This is in line with what was expected. The nature of this relationship is stable, even in the presence of increasing dieselization for the time span and countries analyzed. In other words, dieselization was not enough to overcome the increasing CO2ROAD due to the rise of AVPOWERD. This result is in accordance with what was expected, reinforcing the robustness of our results and the adequacy of our option to control for this driver. Regarding the design of eventual policy measures, in order to reduce CO2ROAD, the EU could optimize the advancing fuel saving technologies by restraining the maximum power for automobile manufacturers’ associations, according to PC size.
As regards demography, we observed a positive and highly statistically significant contribution of POPDENS to CO2ROAD. Concerning general CO2 emissions, this relationship was also reported by Hamilton and Turton [20], Hatzigeorgiou et al. [21], and by Papagiannaki and Diakoulaki [5] relative to CO2ROAD. It follows that since a larger POPDENS is associated with higher CO2ROAD, any people movements that increase population densities, such as both external and internal migrations, could cause damage to the environment. In order to mitigate this effect, policies should encourage people to reduce CO2ROAD in their daily routines, namely through car sharing and the use of public transport.
The CO2ROAD is negatively related to PRICEG. In fact, there is a negative and statistically significant relationship between these variables. Several reasons can help to explain this relationship. First, higher PRICEG can induce lower fuel consumption as a result of PCs being driven at optimum speeds [18]. Second, it can persuade people, in the long run, to reduce kms driven [16,17]. Third, in the long run, high PRICEG can influence consumer decisions to opt to buy vehicles with more advanced fuel saving technologies and powered by cheaper fuels [11], or even, to replace the use of PCs with public transport. In order to impact CO2ROAD, the design of public policies could manage taxes penalizing fuel prices. Nevertheless, such policies would imply harmful consequences to economic activities, both directly and indirectly. Thus, it is crucial to achieve the appropriate balance between them.
With regard to dieselization, we shed light on the lack of consensus in the literature. In line with Schipper [14], we find a positive relationship between DIESCAR and CO2ROAD. In fact, this relationship is highly statistically significant and is resistant to different assumptions taken gasoline PCs travel the same number of kms per year. However, this assumption seems to us far from real. For within models. This evidence deserves a deep reflection, given that some literature assumes that both diesel and instance, Schipper [14] notes that diesel PCs in Europe travel 40% to 100% more than gasoline ones. That misspecification could be the source of the negative sign achieved by this literature, such as Zervas [34]. It follows that public policies promoting the acquisition of diesel PCs maybe be contributing to environmental damage.
6. Conclusions
This paper focuses on a panel of 14 EU countries from 1995 to 2007, to analyze the impact of several drivers on road transport CO2 emissions. We innovate by using the PCSE estimator, which proves to be appropriate, taking into consideration the existence of contemporaneous correlation among the various countries. We contribute by showing the relevance of new drivers in explaining road transport CO2 emissions; meanwhile, we extend the debate about the dieselization effect on those emissions. Overall, the results are robust.
Income and the price of gasoline contribute towards mitigating road transport CO2 emissions. On the other hand, population density and the average power of new diesel PCs registered have the opposite impact, i.e., they contribute to exacerbating those CO2 emissions. As far as dieselization is concerned, our findings are crucial to fully understanding this trend by showing that saving emissions from using diesel tends to be surpassed by the increased kms driven. Indeed, we show that a large share of new diesel PCs contributes to more road transport CO2 emissions. This result with a positive signal does not depend on the debatable assumption that diesel and gasoline PCs travel the same number of kms per year.
The designers of public policies should be aware that dieselization and PC power are causing an increase in road transport CO2 emissions. On the one hand, further research is needed to better understand the real effect of the increasing kms driven by diesel PCs on road transport CO2 emissions. On the other hand, once a positive relationship between PC power and road transport CO2 emissions has been verified, then it is advisable that public policy should make powerful PCs more expensive and could, alternatively, promote agreements with automobile manufacturers’ associations in order to limit power in new PC models.
7. Acknowledgements
We gratefully acknowledge the generous financial support of the NECE—Research Unit in Business Science and Economics, sponsored by the Portuguese Foundation of Science and Technology.
REFERENCES
- EC, “Recommendation (1999/125/EC) of 5th February 1999 on the Reduction of CO2 from Passenger Cars,” European Comission, Brussels, 1999.
- EC, “Recommendation (2000/304/EC) of 13th April 2000 on the Reduction of CO2 from Passenger Cars (JAMA),” European Comission, Brussels, 2000.
- EC, “Recommendation (2000/303/EC) of 13th April 2000 on the Reduction of CO2 from Passenger Cars (KAMA),” European Comission, Brussels, 2000.
- E. Zervas, “Analysis of the CO2 Emissions and of the Other Characteristics of the European Market of New Passenger Cars. 1. Analysis of General Data and Analysis per Country,” Energy Policy, Vol. 38, No. 10, 2010, pp. 5413-5425. Hdoi:10.1016/j.enpol.2010.02.008
- K. Papagiannaki and D. Diakoulaki, “Decomposition Analysis of CO2 Emissions from Passenger Cars: The Cases of Greece and Denmark,” Energy Policy, Vol. 37, No. 8, 2009, pp. 3259-3267. Hdoi:10.1016/j.enpol.2009.04.026
- L. Ryan, S. Ferreira and F. Convery, “The Impact of Fiscal and Other Measures on New Passenger Car Sales and CO2: Evidence from Europe,” Energy Economics, Vol. 31, No. 3, 2009, pp. 365-374. Hdoi:10.1016/j.eneco.2008.11.011
- D. Stead, “Relationships between Transport Emissions and Travel Patterns in Britain,” Transport Policy, Vol. 6, No. 4, 1999, pp. 247-258. Hdoi:10.1016/S0967-070X(99)00025-6
- B. Los and B. Verspagen, “Localized Innovation, Localized Diffusion and the Environment: An Analysis of Reductions of CO2 Emissions by Passenger Cars,” Journal of Evolutionary Economics, Vol. 19, No. 4, 2009, pp. 507-526. Hdoi:10.1007/s00191-009-0146-8
- I. Al-Hinti, A. Al-Ghandoor, B. Akash and E. Abu-Nada, “Energy Saving and CO2 Mitigation through Restructuring Jordan’s Transportation Sector: The Diesel Passenger Cars Scenario,” Energy Policy, Vol. 35, No. 10, 2007, pp. 5003-5011. Hdoi:10.1016/j.enpol.2007.04.024
- T. Zachariadis, “On the Baseline Evolution of Automobile Fuel Economy in Europe,” Energy Policy, Vol. 34, No. 14, 2006, pp. 1773-1785. Hdoi:10.1016/j.enpol.2005.01.002
- M. Pock, “Gasoline Demand in Europe: New Insights,” Energy Economics, Vol. 32, No. 1, 2010, pp. 54-62. Hdoi:10.1016/j.eneco.2009.04.002
- G. Fontaras and Z. Samaras, “A Quantitative Analysis of the European Automakers’ Voluntary Commitment to Reduce CO2 Emissions from New Passenger Cars Based on Independent Experimental Data,” Energy Policy, Vol. 35, No. 4, 2007, pp. 2239-2248. Hdoi:10.1016/j.enpol.2006.07.012
- F. Cuenot, “CO2 Emissions from New Cars and Vehicle Weight in Europe; How the EU Regulation Could Have Been Avoided and How to Reach It?” Energy Policy, Vol. 37, No. 10, 2009, pp. 3832-3842. Hdoi:10.1016/j.enpol.2009.07.036
- L. Schipper, “Automobile Fuel; Economy and CO2 Emissions in Industrialized Countries: Encouraging Trends through 2008?” Transport Policy, Vol. 18, No. 2, 2011, pp. 358-372. Hdoi:10.1016/j.tranpol.2010.10.011
- K. Bodek and J. Heywood, “Europe’s Evolving Passenger Vehicle Fleet: Fuel Use and GHG Emissions Scenarios through 2035,” Publication No. FFEE 2008-03 RP. Laboratory for Energy and Environment, MIT, 2008.
- B. Liddle, “Long-Run Relationship among Transport Demand, Income and Gasoline Price for the US,” Transportation Research Part D, Vol. 14, No. 2, 2009, pp. 73-82.Hdoi:10.1016/j.trd.2008.10.006
- D. Greene, “Rebound 2007: Analysis of US Light-Duty Vehicle Travel Statistics,” Energy Policy, Vol. 41, 2012, pp. 14-28. Hdoi:10.1016/j.enpol.2010.03.083
- D. Bonilla, “Fuel Demand on UK Roads and Dieselisation of Fuel Economy,” Energy Policy, Vol. 37, No. 10, 2009, pp. 3769-3778. Hdoi:10.1016/j.enpol.2009.07.016
- K. Storchmann, “Long-Run Gasoline Demand for Passenger Cars: The Role of Income Distribution,” Energy Economics, Vol. 27, No. 1, 2005, pp. 25-58. Hdoi:10.1016/j.eneco.2004.03.002
- C. Hamilton and H. Turton, “Determinants of Emissions Growth in OECD Countries,” Energy Policy, Vol. 30, No. 1, 2002, pp. 63-71. Hdoi:10.1016/S0301-4215(01)00060-X
- E. Hatzigeorgiou, H. Polatidis and D. Haralambopoulos, “CO2 Emissions in Greece for 1990-2002: A Decomposition Analysis and Comparison of Results Using the Arithmetic Mean Divisia Index and Logarithmic Mean Divisia Index techniques,” Energy, Vol. 33, No. 3, 2008, pp. 492-499. Hdoi:10.1016/j.energy.2007.09.014
- P. Tapio, D. Banister, J. Luukkanen, J. Vehmas and R. Willamo, “Energy and Transport in Comparison: Immaterialisation and Decarbonisation in the EU15 between 1970 and 2000,” Energy Policy, Vol. 35, No. 1, 2007, pp. 433-451. Hdoi:10.1016/j.enpol.2005.11.031
- B. Kavalov and S. Peteves, “Impacts of the Increasing Automotive Diesel Consumption in the EU,” European Commission Joint Research Centre, Ispra, 2004.
- European Comission, “Regulation (EC) No. 443/2009 of the European Parliament and of the Council of 23 April 2009,” European Comission, Brussels, 2009.
- F. De Filippis and G. Scarano, “The Kyoto Protocol and European Energy Policy,” European View, Vol. 9, No. 1, 2010, pp. 39-46. Hdoi:10.1007/s12290-010-0121-7
- C. Baum, “Residual Diagnostics for Cross-Section Time Series Regression Models,” The Stata Journal, Vol. 1, No. 1, 2001, pp. 101-104.
- M. H. Pesaran, “General Diagnostic Tests for Cross Section Dependence in Panels,” Working Paper 1229, Cambridge Working Papers in Economics, Faculty of Economics, Cambridge, 2004.
- E. Frees, “Assessing Cross-Sectional Correlation in Panel Data,” Journal of Econometrics, Vol. 69, No. 2, 1995, pp. 393-414. Hdoi:10.1016/0304-4076(94)01658-M
- E. Frees, “Longitudinal and Panel Data: Analysis and Applications in the Social Sciences,” Cambridge University Press, Cambridge, 2004. Hdoi:10.1017/CBO9780511790928
- W. R. Reed and H. Ye, “Which Panel Data Estimator Should I Use?” Applied Economics, Vol. 43, No. 8, 2011, pp. 985-1000. Hdoi:10.1080/00036840802600087
- A. Cameron and P. Triverdi, “Microeconometrics Using Stata,” Stata Press, College Station, Texas, 2009.
- R. E. De Hoyos and V. Sarafidis, “Testing for CrossSectional Dependence in Panel-Data Models,” The Stata Journal, Vol. 6, No. 4, 2006, pp. 482-496.
- N. Beck and J. Katz, “What to Do (and Not to Do) with Time-Series Cross-Section Data,” American Political Science Review, Vol. 89, No. 3, 1995, pp. 634-647. Hdoi:10.2307/2082979
- E. Zervas, “SCO2 Benefit from the Increasing Percentage of Diesel Passenger Cars. Case of Ireland,” Energy Policy, Vol. 34, No. 17, 2006, pp. 2848-2857. Hdoi:10.1016/j.enpol.2005.05.010H
NOTES
*Research supported by: NECE, I&D unity funded by the FCT—Portuguese Foundation for Science and Technology, Ministry of Education and Science.