Open Journal of Modelling and Simulation
Vol.2 No.3(2014), Article
ID:48211,15
pages
DOI:10.4236/ojmsi.2014.23012
An Agent-Based Model for Studying the Impact of Herd Mobility on the Spread of Vector-Borne Diseases: The Case of Rift Valley Fever (Ferlo Senegal)
Python Ndekou T. Paul1, Alassane Bahwang#_s:sup1, Papa Ibrahima Ndiayewang#_s:sup2, Jacques André Ndione3
1Esp-UCAD, UMMISCO, Dakar, Senegal
2UAD, Bambey, Senegal
3CSE, Dakar, Senegal
Email: pppython@yahoo.fr, alassane.bah@gmail.com, papaibra@yahoo.com, jacques-andre.ndione@cse.sn
Copyright © 2014 by authors and Scientific Research Publishing Inc.
This work is licensed under the Creative Commons Attribution International License (CC BY).
http://creativecommons.org/licenses/by/4.0/


Received 16 April 2014; revised 23 May 2014; accepted 20 June 2014
ABSTRACT
Vector-borne diseases are highly sensitive to environment and to environmental changes. Rift Valley Fever (RFV) is a mosquito-borne zootic virus associated with severe diseases in human beings and economic consequences to livestock sector. Animal and human movements have a fundamental impact on RVF transmission. In recent years, there has been a growing interest in the use of mathematics and agent based models to represent and analyze the dynamic of RFV transmission. However, no previous study has taken into consideration animal herds’ mobility and precipitation factors to understand the disease spread. This limitation underlines the necessity to use computational model approach based on multi-agent system in the study of vector-borne diseases transmission and diffusion. In this paper, a multi-agent system combining conceptual model expressiveness is used to study animal herds’ mobility and the precipitation parameter impact on the Rift Valley Fever outbreak in Ferlo Barkedji in Northern Senegal. Simulation scenarios with various parameters, including rain quality, hosts, vectors, camp dispersal around ponds, etc., are unrolled. The different results we have obtained show that the evolution of the number of infected hosts and infected vectors depend on the degree of animal herds’ mobility and on precipitations. Our model provides a framework that permits predicting the spread of the disease associated with the mobility of animal herds.
Keywords:Vector-Borne Diseases, Rift Valley Fever, Multi-Agent System, Diseases Modeling, Agent Based

1. Introduction
Rift Valley Fever (RVF) is an acute fever causing viral “anthropozoonosis” that affects domestic animals such as cattle, buffalo, sheep, goats, camels among others. The RVF virus (RVFV) is a member of the genus Phlebovirus in the family Bunyaviridae. It is responsible for premature abortion and perinatal mortality in livestock and for hemorrhagic fever and encephalitis in humans. Indeed, veterinary offices in Kenya are the first to report the RVF among livestock in the early 1900s. Numerous epidemic/epizootic outbreaks have been reported periodically in many African countries in the past 30 years [1] -[5] . Since 2000, the virus has been located outside the African continent, mainly in Saudi Arabia and Yemen [6] [7] and 2008 in Mayotte [8] .
In West Africa and particularly in Senegal and southern Mauritania, RVF epidemics do not seem to follow trends as it is the case in East Africa [9] -[13] . Linthicum et al. [14] , when using the Normalized Difference Vegetation Index (NDVI) [15] as a proxy for rainfall, have highlighted possible linkages between rainfall and RVF epidemics, the relationships between RVF occurrences, interannual variability of the warm phase of El NioSouthern Oscillation (ENSO), and rainfall excess over Kenya [16] . Thus the RVF is associated with years of unusual heavy rainfall events [14] .
In Senegal, many mosquito species were found infected with RVF virus [11] [17] -[20] . After the RVF outbreak of 1987, entomological studies were carried out in Senegal from 1991 to 1996 to identify the sylvatic vectors of the virus [12] . These studies proved that the epidemiological role of mosquito species involved in the RVF transmission cycle (Aedes sp. and Culex sp.) in Senegal is peculiar.
The environmental maintenance of the virus is mainly due to the so-called “vertical transmission” while the Culex sp. amplifies the phases of the virus cycle. Although the above factors differ from those in East and Southern Africa [21] , they all use the same type of breeding sites and feed on cattle and sheep [18] [22] [23] .
In fact, epidemiological studies of RVF are complex because of nature and the multiplicity of the ways of transmission:
• many vectors species transmit the pathogen to livestock
• transovarian transmission exists for some mosquito species
• existence of direct transmission to humans with blood contact, secretion or milk from ill animals.
Herds’ mobility plays a great role on vector borne-disease [24] -[33] . The impact of Herd’s mobility on dynamic transmission modeling of that vector borne-disease is a challenge of Sahelian research laboratories. Many mathematic models and agent based models have been the object of research on vector borne-disease [34] [35] . However, these research focus on transmissions on a local scale [4] [27] [35] -[37] . Some other scientists have worked on the outbreak factors of the disease [38] -[40] .
Specific cases of research on herds’ mobility and their implications on disease transmission in the Valley Fever in Ferlo (Senegal) remain an ongoing issue. The simultaneous use of mobility scale and rainfall scale on the same modeling has not taken into account yet the outbreak and the supervision of RVF propagation in the short and long term in Senegal (Ferlo).
This paper seeks to propose a new approach of modeling with ABM which integrates rainfall daily precipitations, environmental and epidemiological data in order to grasp the impact of animal herds’ mobility on the Rift Valley Fever transmission in the Barkedji area of Ferlo Senegal. RVF is a highly contagious disease. We lay emphasis on the hypothesis that the seasonal movements and the daily grazing activities of mobile animal herds impact meaningfully on RVF transmission.
To achieve the main goal of our work, the paper is structured as follows:
In the first part, we will present the geographic characteristics of the Ferlo region (Senegal). A brief presentation of the literature of the use of mathematic models in epidemiology and their limits as well as a short presentation of agent based model are tackled in the second part. The third part deals with the agent based modeling of the host-vector infection processes by the RVF and their interactions with the environment. Also in this part, a general conceptual modeling of data is presented as well as the diagrams of state transitions of the mosquito life cycle. The fourth and fifth parts present respectively the different stage of the simulation and the description of the different results of which the entry parameters depend on herds’ mobility and the rainfall. The sixth part comments on the obtained results before concluding.
2. The Study Field: Barkedji
Our study area, Barkedji, is endowed with a Sahelian climate characterized with a rainy season from July to October. In this period, the area is under the whims of maritime influence from the deflected trade winds and water-vapor advection from the eastern Atlantic Ocean [11] [41] . The mean annual rainfall there is mainly provided by squall lines, and ranges from 300 mm to 500 mm [42] .
During the summer monsoon, a large quantity of small and temporary ponds are thus formed leading to an environment favoring mosquitoes’ breeding and hatching, including A. vexansarabiensis and C. poicilipes associated with the RVF [11] [18] . In fact, these seasonal ponds are seen as key places where cattle and vectors do meet, and as such become potent sources for epidemics. In the Ferlo region, ponds are widely distributed, some isolated, and others organized in clusters of all sizes. Different types of ponds exist with different level of vegetation cover inside and different degrees of turbidity [11] . Vegetation cover includes embedded trees such as Acacia sp., Mytragena inermis, Diospyrosme spiliformis and Balanite saegyptiaca, annual herbaceous plants such as Oryza barthii (wild rice), Cassia obsutifolia, Eragrostis tremula and Schoenefeldia gracilis, and floating vegetation such as Cenatotheca sesamoïdes (water-lilies).
3. Material and Methods
In order to understand the epidemiological cycle complexity of vector-borne diseases, several methods were proposed with representation, understanding and often forecasting objectives. They can generally fall into two groups: conceptual models and mathematical models.
The conceptual models applying to qualitatively describe the disease include geographical models. They generally make it possible to describe the spatial distribution of the vector and provide the possibility to visualize potential risk zones in the shape of maps. The methods consist in looking for correlation between the distribution of vectors and environmental parameters. The method has widely been used in the study of diseases such as malaria [43] animal trypanosomosis [44] cholera [45] and more particularly RVF [14] [46] .
At the mathematical level, the Kernack and Mackendrick models [47] , based on a compartmented description of the population as susceptible (s) exposed [E], infected [I] and recovered [K] subjects, have played an important role in the development of the mathematical epidemiology [34] [48] . Many applications on vector-borne diseases exist in the literature especially on malaria [49] and the Rift Valley Fever. They are essentially based on the vectorial capacity calculation (C) and the basic reproduction rate (R0) [47] :
• The vectorial capacity of a population of vectors is defined as the average number of bites that the vectors having bitten an infecting individual, inflect on the host population during the rest of their lives, once the intrinsic incubation cycle is completed.
 (2)
(2)
where m is the mosquito density per human, a is a average number of bites per day for each mosquito, p is the probability of a mosquito surviving trough any one day, and n is the extrinsic incubation period.
• The basic reproduction rate which is defined as the number of secondary cases generated from the introduction of a first infected case into a sensitive host population [47] :
 (2)
(2)
where r is the recovery rate and C the vectorial capacity.
If R0 upper than 1 then the disease spread, otherwise its decrease. Nevertheless, taken individually, the two approaches present limits. The validity area and the results (generalization) from a local scale to a regional scale of geographical model set a certain number of accuracy problems.
Besides, this modelling type does not take into account the vectors populations temporal variability. As for the epidemiological models, they hardly take into account the link with the environment, the epidemics space propagation and particularly their operationalization set huge difficulties on the ground.
Considering the different limits, it seems necessary, to satisfactorily study the dynamics the Barkedji rift valley fever transmission to combine both the conceptual and mathematical approach with the help of the agent based modelling and simulation. As a matter of fact, the multi-agent simulation, the unifying paradigm of our viewpoint, provides a modeling and simulation (innovative) vision in the epidemiology, as it uses not only the direct representation of individuals (the agents) (host, vectors for example) but also that of their interactions. It thus makes it possible to solve complex problems associated with societies whose macro level organization results from the different micro level interactions that are at the level of agents, of individuals. It, in addition, provides the user the advantage of being part and parcel of the simulation. The latter uses the simulator as if it was a miniature laboratory displacing individuals, changing their behavior and modifying their environmental condition [22] .
The first stage (Stage 1) of a multi-agent simulation consist in breaking up the real phenomenon into an environment in which a finite set off self-sufficient and discrete objects associated by static and dynamic connections. The second stage (Stage 2) makes it possible starting from the environment definition (if it exists), the objects and links uniting them to create a model by transforming the objects into self-sufficient computer entities called agents. As for the last stage (Stage 3), common to all simulation types, it consists in refining the model in function of joint observations of reality and the simulations inferred from the model. The object of the study then is to apply this approach to the study of the RVF vectorial transmission at Barkedji, by combining, as indicated, the mathematical approach for the description of some agents dynamics and conceptual one for the assumption of the actors behaviors and logics [36] .
4. The Agent-Based Model (RVF_Model)
A thorough analysis, based on investigation, carried out on the ground at Barkedji, makes it possible to show that, generally, vector-borne diseases and particularly RVF bring hosts and vectors into action in an environment influenced by the climate (Figure 1). Those interactions condition the epizooty appearance.
What is at stake us therefore to understand the determinants which have an impact on the spread of the epizooty in a Sahelian zone anthropized environment.
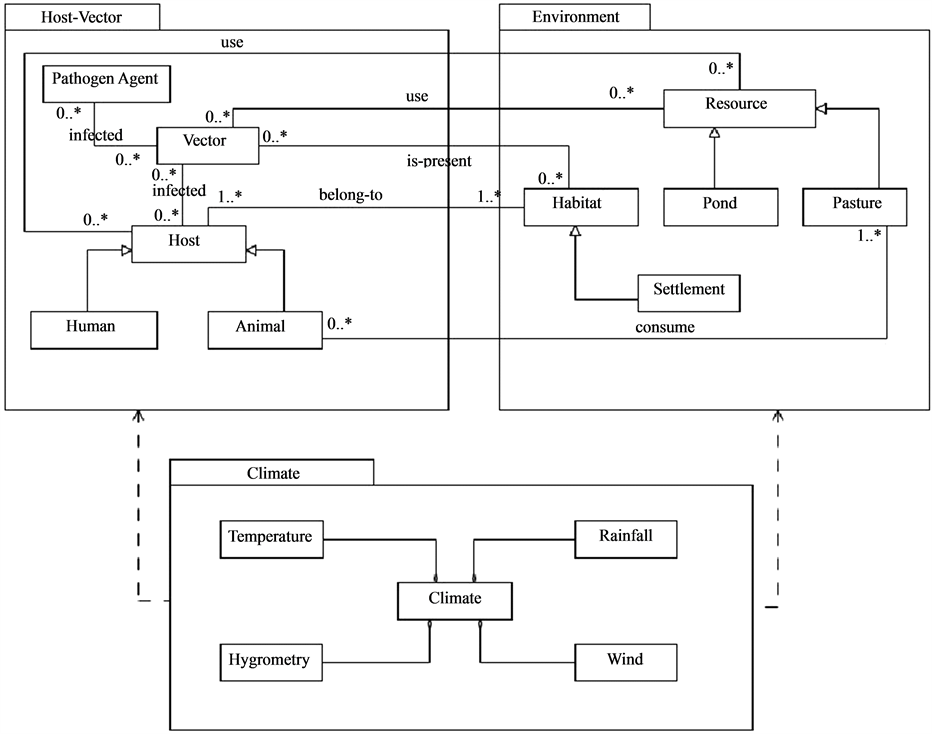
Figure 1. RVF general conceptual model.
Step 1: Breaking up the system studied into entities.
As advocated by the agent modelling approach, a break up of the system into different entities is proposed, highlighting their relationships with the help of the UML1 notation. This reification process aims at identifying the main elements of the system to study.
This first analysis provides a break up in the form of packages gathering the modelling elements that are here the entities (or classes in the UML sense) of the system studied following a logical cutting up taking into the disease different dimension: ecological, climatic and sociological.
The “Host-vector” package describes the hosts and vectors space as well as their relationships. The “Environment” packages describe the constituent elements of the environment that are the different villages and settlements, and the resources represented here by the ponds (temporary Water points) and the livestock fodder resources.
The “climate” package assumes the different factors that have a strong impact on the behavior of the hosts, dynamic vectors and environment itself. That is mainly the rainfall, the temperature and the winds.
Step 2: Agentification
This second stage improves the first analysis model by only keeping the static or dynamic elements deemed relevant by the modeler in connection with the question posed. The object isto be inspired by the vowel approach
(A: agents, E: environment, I: interactions) [50] [51] for the agent model description.
4.1. RVF Model Environment (E)
The environment of this model (Figure 2) in this model version will be represented by a variable dimension grid (nxm) where will be positioned this model agents. Two agent groups can be distinguished: those that are spatialized (G1) and those that are not (G2):
G1 = {AFrom Environment package, AFrom Host-vector package}
AFrom environment package = {Pond, Pasture, Settlement}
AFrom Host-vector package = {Host, Vector}
G2 = {A’From Climate package}
A’ From Climate package = {Climate}
Each spatialized element has three particular attributes:
• position which stores the element coordinates on the grid;
• Shape which the geometric nature of its representation on the grid;
• and state which provides a particular viewpoint on the agent or the object.
4.2. Agent and Interactions (A & I)
4.2.1. Pond
The pond dynamics belonging to G1 is central in the vector-borne diseases occurrence and diffusion process. It is the host and vectors meeting place. They represent the homes of a number of diseases as malaria, Rift Valley Fever (RVF) etc. their dynamics in relationship with climate and environment conditions condition the life cycle of the vectors. The pond (Figure 3) has the following characteristics:
• Physical parameters
• Climate parameters and
• Pedological parameters.
The pond is a complex system. His dynamic (hydrological balance) assumes two functions:
• a production function (water gain) allowing the water input in the pond to be calculated and
• a transfer function allowing the pond emptying (water loss) to be assumed.
![]() (3)
(3)
4.2.2. Gain or Production Function
The water gain is function of the runoff and the amount of direct rain received by the pond
![]() (4)
(4)

Figure 2. The environment of the simulation.
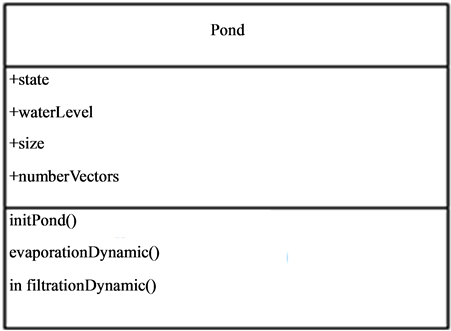
Figure 3. Description of the pond entity.
4.2.3. Losses or Transfer Function
This function assumes the infiltration, the evaporation and feeding or consumption of live-stock and humans
![]() (5)
(5)
Infiltration: the infiltration essentially depends on the type of soil (Table 1), as a result on the soil permeability. There is different type of infiltration functions used in the literature according to Jaton [52] . Nevertheless it is possible to calculate the soil permeability by means of experimentations.
Evaporation: The assessment proposed in the table below (Table 2) was made with the help of an experimentation done by FAO (Source FAO). It is strongly linked to the climate of the concerned area. In our case we are in the Sahelian area.
Consumption: This amount essentially depends on the configuration of the different settlements around the water point and on the size of the live-stock which come to drink. The pastoralists reckon.
4.2.4. Vectors
The mosquitoes vectors of the rift valley fever which are the Aedes and the Culex (Figure 4) follow a biological cycle taking place partly in the water then partly in the air.
After hatching the eggs, the larvae and nymphs grow in the water. The young adult still called neonate emerges

Table 1 . Infiltration rate according to the sol type (source FAO).
Table 2. Monthly evaporation rate (source FAO).
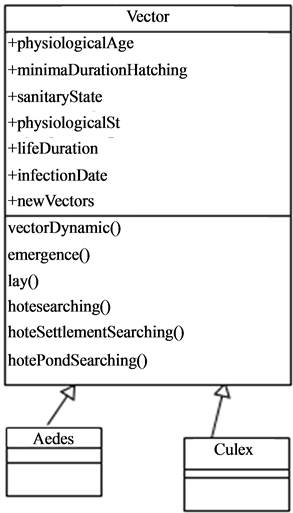
Figure 4. The different type of vectors.
at the end of this aquatic development phase (Figure 5, Figure 6). The female neonates mate with the male and thus being their air life. Once (fecundated), the females need a blood meal necessary to the maturation of the eggs that will be laid on the banks for the Aedes or on the surface of the water for the Culex. This blood-hatching cycle represents the trophogonic cycle and generally lasts three to four days and is strongly dependent on the climate and environment conditions The repetition of this trophogonic cycle enables the infection of the mosquito (Figure 7) by a sick. The development duration or incubation of the pathogen also called the extrinsic cycle is about 10 days. At the end of the cycle, the mosquito becomes capable of transmitting the virus to a new animal if the latter is not immunized.
4.3. Hosts
The hosts (Figure 8), in the current version of the present model, are mainly live-stock that are not in free pasture and move in their environment in search of water points and pastures in the nearest of their settlements.
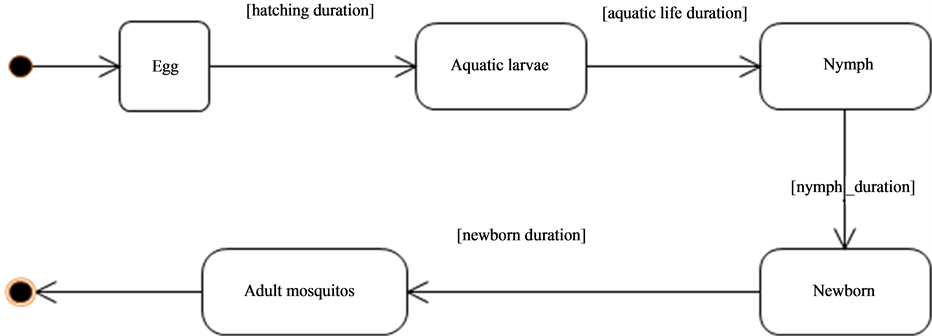
Figure 5. Mosquitoes life cycle.
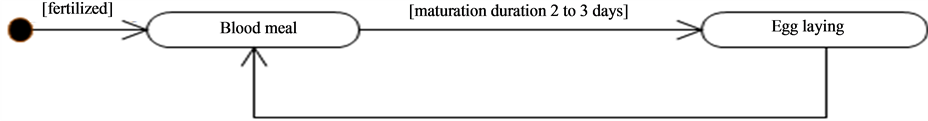
Figure 6. The trophogonic cycle.
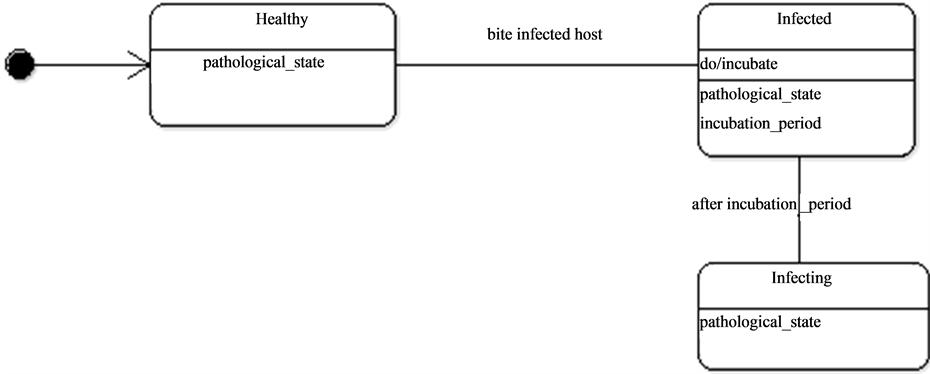
Figure 7. The pathological state dynamics.
They thence can be in contact with the mosquitoes as they wonder around and particularly at water points which constitute the main important living places. Once the host is bitten by an infected mosquito it passes through an incubation period (Figure 9) before being infecting. In some conditions, hosts can become resistant.
Step 3: Implementation, calibration and refining
Starting from this analysis, the RVF model has been implemented by using CORMAS platform [53] which is composed by spatial, social and passive entities according to its meta-model.
5. Experimental Description
To determine the number of infected hosts, a number of simulations on animal herds’ mobility were performed:
a) The first step consists of initializing the parameters such as the number of healthy hosts, the number of infected hosts, the number of healthy vectors, the number of infected vectors, the number of settlements, the number of water ponds, the degree of mobility and the amount of resources.
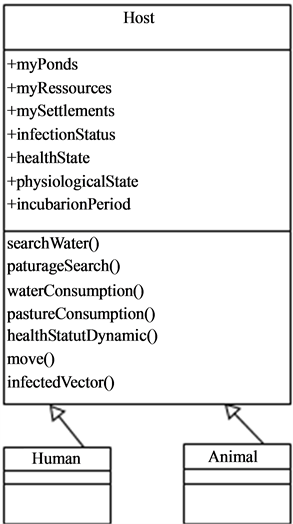
Figure 8. Class diagram showing the hosts and his possible mobility.
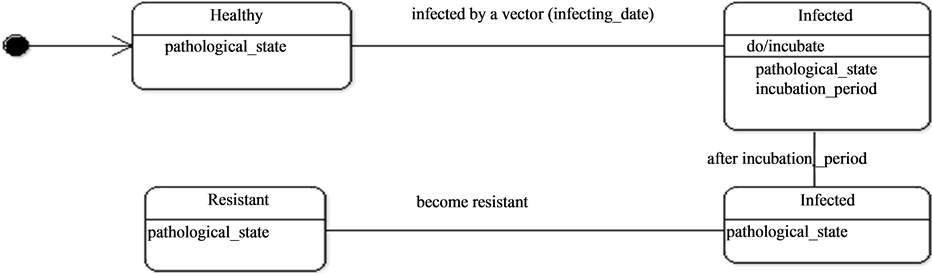
Figure 9. Hosts dynamics.
b) The second stage of the simulation is the observation of the animal herds’ mobility for 30 days equaling a month. We have chosen 30 days because the maximum lifetime of a vector is 21 days.
c) The last step of this experimentation is to practice a sensitivity analysis on the degree of animal herds’ mobility to measure its impact on the number of infected vectors and infected hosts. The study of this mobility takes into consideration the variability of the rainfall. The input parameters are essential for the start of the simulation. We created the environment with resources, settlements and water ponds that have to be in their original stages before the beginning of the simulation. In our model, the simulation environment represents approximately 100 square meters. Each iteration corresponds to a single day. The numbers of fixe parameters that we used are respectively 20 water ponds, 20 settlements.
6. Experimental Result
For the simulation, we used the following data: a grid of 100 square meters which correspond to the environment, 50 healthy hosts, 10 infected hosts, 10 healthy vectors, 5 infected vectors, 20 settlements and 20 ponds. As the life cycle of vectors (egg, larva, mosquito, adult) depends significantly on rainfalls, we took different values of pluviometry respectively 5 mm for moderate rains and 18 mm for strong ones in order to show the impact of the rain on the infection dynamics. In the beginning of the simulation, the different agents are placed at random in the simulation environment. The agent displacement involves only herds. Vector agents, once placed in the ponds no longer move and wait for the local hosts so that they will be bitten. When practicing a sensitivity analysis on the mobility degree, we obtained the following results:
• Figure 10(a) displays the dynamics of the number of infected hosts under the situation when the rainfall in the Ferlo region is moderate with 5 mm per day.
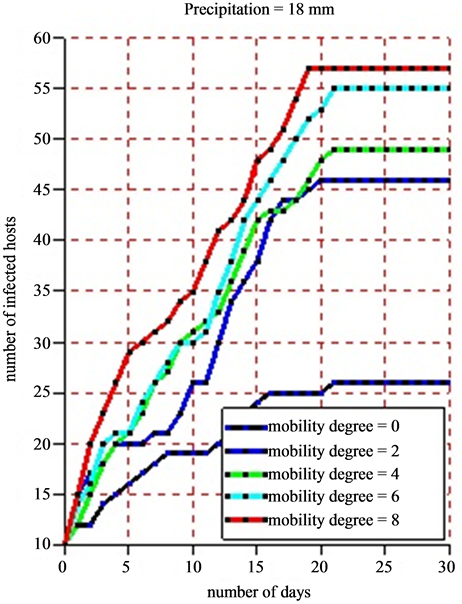
• Figure 10(b) shows the dynamics of infected hosts for a pluviometry of 18 mm per day.
• Figure 11 presents the evolution of the number of infected hosts after the average lifetime of vectors for moderate rainfalls equaling 5 mm and strong rainfalls equaling 18 mm per day.
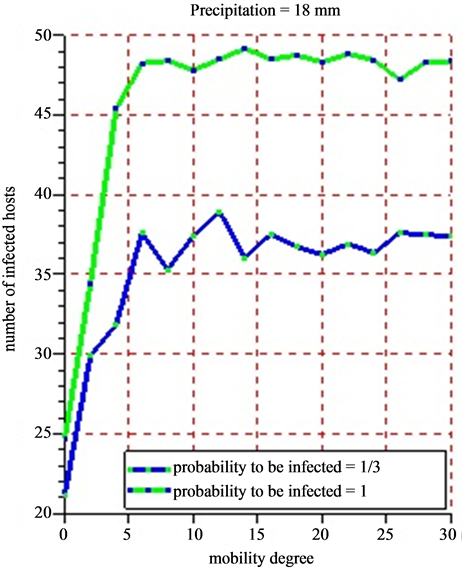
• Figure 12(a) (rainfalls = 5 mm) and Figure 12(b) (rainfalls = 18 mm) present each the dynamics of the average number of infected hosts for each of the 5 successive simulations practiced on mobility scale. Each case of Figure 12(a) and Figure 12(b) takes into account the probability of infected hosts.
1) In Case of Taking into Account Rainfall Precipitations and Sensitivity Value of Mobility degree.
2) In Case of Taking into Account the Probability That Hosts have to be infected.
7. Discussion
Herds’ mobility plays a significant role in the emergence and transmission of the Rift Valley fever. Strong rains contribute to increase the volume of the ponds. This growing brings a multiplication of mosquito larvae which emerge and become adult. Some animals with pathogenic agents are going to move towards the ponds and infect in some conditions healthy vectors. The mobility degree in this situation is the radius of the cell where each host agent chooses the pond to drink. Interactions between hosts and vectors are going then to contribute to the propagation of the disease. During the dry season, when being displaced, herds are not in contact with ponds; this is the reason why the number of infections tends to stabilize.
For a simulation of 30 days, an average lifetime of 21 days with vectors, a pluviometry of 5mm, results show
 (a)
(a)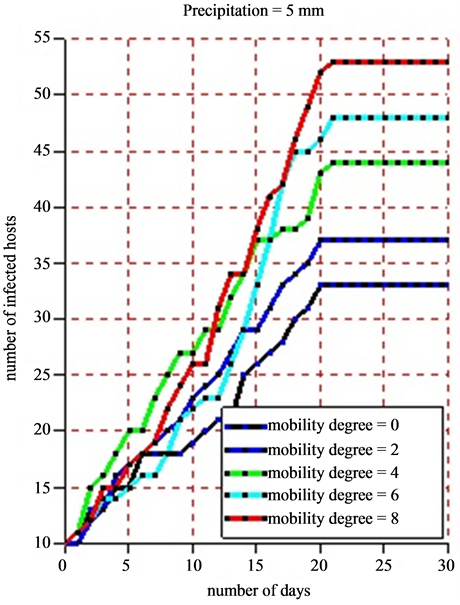 (b)
(b)
Figure 10. (a) and (b) 8 simulations are practiced for each scale of the pluviometry (5 mm and 18 mm). For each of them, we vary the mobility degree from 0 to 8 with a difference of 2 and we note down the number of infected hosts. The time pace is a day and a simulation is practiced in 30 days. The maximum lifetime of vectors is 21 days.
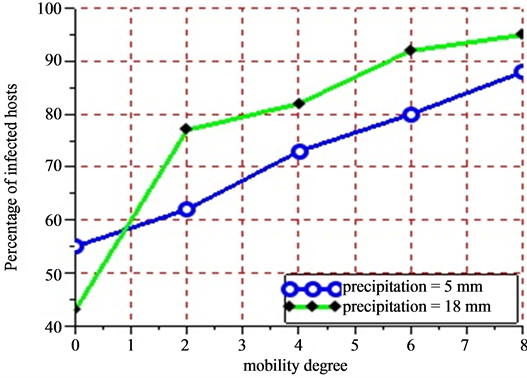
Figure 11. Show the evolution in percent of the number of infected hosts after 21 days according to the mobility degree of sensitivity of herds and two values of precipitations. Figure 11 is the abstract of Figure 10. After 21 days, the number of infected hosts became constant due to the fact that all infected vectors died. For the initial values of the degree mobility ranging from 0 - 8 with a difference of 2 and rainfalls equaling 5 mm, the results obtained give respectively 55%, 62%, 73%, 80% and 88% for the rate of the number of infected hosts. For the initial values of mobility ranging from 0 - 8 with a difference of 2 and rainfalls equaling 18 mm, the results give respectively 43%, 77%, 82%, and 95% for the rate of the number of infected hosts.
 (a)
(a)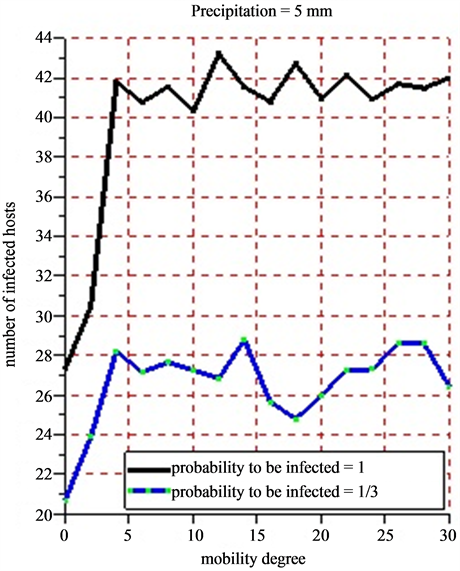 (b)
(b)
Figure 12. (a) (b) 5 successive simulations are practiced for each of the 15 values of mobility degree varying from 0 to 30 with a difference of 2 for a period of 30 days. The infection probability is fixed varying the intensity of the rainfall. The results show the evolution of the average number of infected hosts for a period of 30 days.
a slight growth of the number of infected hosts on the Figure 10(a) and Figure 10(b). Beyond 21 days corresponding to the maximum lifetime of a vector, the rate of infection of host remains stable due to the fact that all vectors in this phase have a death physiological state. The sensitivity analysis of the mobility degree shows that when its value increases, the number of infected hosts beyond 21 days increases too. Indeed, if herds stay in their different settlements (the mobility degree equaling 0), all along the simulation, the obtained infection rate is 55%. Then, we notice that this rate moves to 62% when the mobility degree is risen to 2 for a new simulation (Figure 11). When fixing the mobility degree to 8, we find an infection rate equaling 88% that show an absolute variation of 33% with regards to the absence of herds’ mobility.
When varying the intensity of the rainfall of 5 mm for a moderate one to a rainfall of 18 mm for a strong one, we notice a growth of the number of infected hosts. In fact, when we fix the mobility degree to 8 for a period of 30 days, we obtain 88% of infection rate for a pluviometry of 5 mm precipitations and 95% of infection rate for a pluviometry of 18 mm, which makes an absolute variation of 7% in infection rate terms.
The rainfall plays an important role in increasing the numbers of infected hosts with a direct consequence in the spread of the Rift Valley fever in Ferlo (Senegal). Because vectors do not live outside the water ponds as mentioned in this article. The farther the victims can go in search of water source, the more the Rift Valley fever will spread quickly. Taking into account the probability for a host to be infected, we have noticed that the probability of infection is close to 1 and the intensity of the weak rain, whereas the number of infected hosts is very high. If the probability of infection is close to 1 and the rain intensity is weak, then the number of infected hosts decreases. This is due to the fact that when we have moderate rains with less than 5 mm, water ponds tend to dry. This dryness of the water ponds will impact on the growth of the population vectors.
When practicing 5 successive simulations for each of the values of the mobility degree varying from 0 to 30 with a difference of 2 (Figure 12(a) and Figure 12(b)), the average value of the number of obtained infected hosts tend to stabilize little by little that the mobility degree varies. In all cases, herds’ mobility starts only when the rain intensity has a certain value. The bigger that value, the more the number of the vectors grows. This fast growth of vector populations will reinforce the infection growth. Studying the correlations between the mobility degree, pluviometry and infection probability could lead to have new knowledge on the transmission of the Rift Valley Fever in Ferlo (Senegal). The agent based model developed constitutes nucleus basis for any simulation looking for observing or predicting the evolution of the Rift Valley Fever in Ferlo (Senegal).
8. Conclusion
Understanding daily herds’ mobility has allowed us to scrutinize the patterns of the Rift Valley Fever spread. Through simulations on an artificial environment in which daily movements of animals are explicitly identified at random, we studied the impact of the initial conditions of herds’ mobility on the propagation process and the emergence of the disease. The results from the experimentation have shown that the understanding of herds’ movement to the water ponds can significantly reduce the disease infection rates. Reducing the distances covered by animals searching for water sources also lowers the risk of infection rate. The results underscore that mobility is not the sole factor that increases the infection rate. Besides, there is the rainfall which plays a major role.
Thus, controlling the rainfall amounts to controlling the filling of water ponds. If the ponds are dry, then herds cannot go to them, which reduce the infection rate. The probability of animal herds to be infected is crucial. If it is controlled, a decrease in the propagation of the disease can be witnessed. Analyzing animal herds’ mobility in the long term can help find a contingency plan for the prevention of the Rift Valley Fever. The agent-based model that we have developed provides a framework for predicting the spread of the disease related to animal herds’ mobility.
References
- Hoogstraal, H., Meegan, J.M., Khalil, G.M. and Adham, F.K. (1979) The Rift Valley Fever Epizootic in Egypt 1977-1978, Ecological and Entomological Studies. Transactions of the Royal Society of Tropical Medicine and Hygiene, 73, 624-629. http://dx.doi.org/10.1016/0035-9203(79)90005-1
- Lefèvre, P.C. (1997) Actualité de la fièvre de la vallée du Rift, Quels enseignements tirer des épidémies de 1977 et 1987. Médecine Tropicale, 57, 61S-64S.
- Meegan, J.M. (1979) The Rift Valley Fever Epizootic in Egypt 1977-1978: I. Description of the Epizootic and Virological Studies. Transactions of the Royal Society of Tropical Medicine and Hygiene, 73, 618-623. http://dx.doi.org/10.1016/0035-9203(79)90004-X
- Woods, C.W., Karpati, A. M., Grein, T., McCarthy, N., Gaturuku, P., Muchiri, E., Dunster, L., Henderson, A., Khan, A.S., Swanepoel, R., et al. (2002) An Outbreak of Rift Valley Fever in Northeastern Kenya. Emerging Infectious Diseases, 8, 138-144. http://dx.doi.org/10.3201/eid0802.010023
- Zeller, H.G., Fontenille, D., Traoré-Lamizana, M., Thiongane, Y. and Digoutte, J.P. (1997) Enzootic Activity of Rift Valley Fever Virus in Senegal. American Journal of Tropical Medicine and Hygiene, 56, 265-272.
- Jupp, P.G., Kemp, A., Grobbelaar, A., Leman, P., Burt, F.J., Alahmed, A.M., Al Mujalli, D., Al Khamees, M. and Swanepoel, R. (2002) The 2000 Epidemic of Rift Valley Fever in Saudi Arabia: Mosquito Vector Studies. Medical and Veterinary Entomology, 1, 245-252.http://dx.doi.org/10.1046/j.1365-2915.2002.00371.x
- Miller, B.R., Godsey, M.S., Crabtree, M.B., Savage, H.M., Al-Mazrao, Y., Al-Jeffri, M.H., Abdoon, A.M., Al-Seghayer, S.M., Al-Shahrani, A.M. and Ksiazek, T.G. (2002) Isolation and Genetic Characterization of Rift Valley Fever Virus from Aedesvexans arabiensis, Kingdom of Saudi Arabia. Emerging Infectious Diseases, 8, 1492-1494. http://dx.doi.org/10.3201/eid0812.020194
- Sissiko, D., Giry, C., Gabrié, P., Tarantola, A., Pettinelli, F., Collet, L., D’ortenzio, E., Renault, P. and Pierre, V. (2009) Emergence chez l’homme de la fièvre de la vallée du rift à Mayotte. Bulletin Epidémiologique Hebdomadaire-Institut de Veille Sanitaire (INVS), 4, 33-36.
- Ba, Y., Diallo, D., Kebe, C.M.F., Dia, I. and Diallo, M. (2000) 2005: Aspects of Bioecology of Two Rift Valley Fever virus Vectors in Senegal (West Africa): Aedes vexans and Culex poicilipes (Diptera: Culicidae). Journal of Medical Entomology, 42, 739-750.http://dx.doi.org/10.1603/0022-2585(2005)042[0739:AOBOTR]2.0.CO;2
- Jouan, A., Le Guenno, B., Digoutte, J.P., Philippe, B., Riou, O. and Adam, F. (1988) A Rift Valley Fever Epidemic in Southern Mauritania. Annales de l’Institut Pasteur/Virologie, 139, 307-308. http://dx.doi.org/10.1016/S0769-2617(88)80046-7
- Lacaux, J.P., Tourre, Y.M., Vignolles, C., Ndione, J.A. and Lafaye, M. (2007) Classification of Ponds from High-Spatial Resolution Remote Sensing: Application to Rift Valley Fever Epidemics in Senegal. Remote Sensing of Environment, 106, 66-74. http://dx.doi.org/10.1016/j.rse.2006.07.012
- Ndione, J.-A., Besancenot, J.-P., Lacaux, J.-P., Sabatier, P. (2003) Environnement et épidémiologie de la fièvre de la vallée du Rift (FVR) dans le bassin inferieur du fleuve Sénégal. Environnement, Risques et Santé, 2, 176-182.
- Ndione, J.A., Diop, M., Lacaux, J.P. and Gaye, A.T. (2008) Variabilité intra-saisonnière de la Pluviométrie et émergence de la fièvre de la vallée du rift (FVR) dans la vallée du fleuve Sénégal: Nouvelles considérations. Climatologie, 5, 83-97.
- Linthicum, K.J., Assaf, A., Compton, J.T., Kelley, P.W., Myers, M.F. and Peters, C.J. (1999) Climate and Satellite Indicators to Forecast Rift Valley Fever Epidemics in Kenya. Science, 285, 397-400.
- Jarlan, L., Tourre, Y.M., Mougin, E.P. and Mazzega, P. (2005) Dominant Patterns of AVHRR NDVI Interannual Variability over the Sahel and Linkages with Key Climate Signals (1982-2003). Geophysical Research Letters, 32, Article ID: L04701.
- Anyamba, A., Linthicum. J. and Tucker, C.J. (2001) Climate-Disease Connections: Rift Valley Fever in Kenya. Cadernos de Saúde Pública, 17, S133-S140.http://dx.doi.org/10.1590/S0102-311X2001000700022
- Ba, Y., Diallo, D., Dia, I. and Diallo, M. (2006) Comportement Trophique des Vecteurs du Virus de la Fièvre de la Vallée du Rift au Sénégal: Implications dans l’épidémiologie de la Maladie. Bulletin de la Société de Pathologie Exotique, 99, 283-289.
- Fontenille, D., Traore Lamizana, M., Diallo, M., Thonnon, J., Digoutte, J.-P. and Zeller, H.G. (1998) Nouveaux vecteurs de la fièvre de la vallée du Rift en Afrique de l’Ouest. Emerging Infectious Diseases, 4, 289-293. http://dx.doi.org/10.3201/eid0402.980218
- Garrett-Jones, C. and Rab, B. (1964) The Assessment of Insecticidal Impact on the Malaria Mosquito’s Vectorial Capacity, from Data on the Proportion of Parous Females. Bulletin of the World Health Organization, 31, 71-86.
- Thonnon, J., Picquet, M., Thiongane, Y., Lo, M., Sylla, R. and Vercruysse, J. (1999) Rift Valley Fever Surveillance in the Lower Senegal River Basin: Update 10 Years after the Epidemic. Tropical Medicine and International Health, 4, 580-585. http://dx.doi.org/10.1046/j.1365-3156.1999.00437.x
- Meegan, J.M. and Bailey, C.L. (1988) Rift Valley Fever. Arbovirus Epidemiology and Ecology, 4, 51-76.
- Ferber, J. (1995) Les systèmes multi-agents: vers une intelligence collective, InterEditions.
- Ndiaye, P.I., Bicout, D.J., Mondet, B. and Sabatier, P. (2006) Rainfall Triggered Dynamics of Aedes Mosquito Aggressiveness. Journal of Theoretical Biology, 243, 222-229. http://dx.doi.org/10.1016/j.jtbi.2006.06.005
- Green, D.M., Kiss, I.Z. and Kao, R.R. (2006) Modelling the Initial Spread of Foot-and-Mouth Disease through Animal Movements. Proceedings of the Royal Society B: Biological Sciences, 273, 2729-2735. http://dx.doi.org/10.1098/rspb.2006.3648
- Bajardi, P., Barrat, A., Savini, L. and Colizza, V. (2012) Optimizing Surveillance for Livestock Disease Spreading through Animal Movements. Journal of the Royal Society Interface, 9, 2814-2825.
- Kao, R.R., Green, D.M., Johnson, J. and Kiss, I.Z. (2007) Disease Dynamics over Very Different Time-Scales: Foot-and-Mouth Disease and Scrapie on the Network of Livestock Movements in the UK. Journal of the Royal Society Interface, 4, 907-916. http://dx.doi.org/10.1098/rsif.2007.1129
- Gibbens, J.C., Sharpe, C.E., Wilesmith, J.W., Mansley, L.M., Michalopoulou, E., Ryan, J.B.M. and Hudson, M. (2001) Descriptive of Epidemiology of the 2001 Foot-and-Mouth Disease Epidemic in Great Britain: The First Five Months. Veterinary Record, 149, 729-743.
- Gilbert, M., Mitchell, A., Bourn, D., Mawdsley, J., Clifton-Hadley, R. and Wint, W. (2005) Cattle Movements and Bovine Tuberculosis in Great Britain. Nature, 435, 419-496. http://dx.doi.org/10.1038/nature03548
- Kao, R.R., Danon, L., Green, D.M. and Kiss, I.Z. (2006) Demographic Structure and Pathogen Dynamics on the Network of Livestock Movements in Great Britain. Proceedings of the Royal Society B, 273, 1999-2007. http://dx.doi.org/10.1098/rspb.2006.3505
- Keeling, M.J., et al. (2001) Dynamics of the 2001 UK Foot and Mouth Epidemic: Stochastic Dispersal in a Heterogeneous Landscape. Science, 294, 813-817. http://dx.doi.org/10.1126/science.1065973
- Kiss, I.Z., Kao, R.R. and Green, D.M. (2006) The Network of Sheep Movements with Great Britain: Network Properties and Their Implications for Infectious Disease Spread. Journal of the Royal Society Interface, 3, 669-677. http://dx.doi.org/10.1098/rsif.2006.0129
- Fèvre, E.M., de C. Bronsvoort, B.M., Hamilton, K.A. and Cleaveland, S. (2006) Animal Movements and the Spread of Infectious Diseases. Trends in Microbiology, 14, 125-131. http://dx.doi.org/10.1016/j.tim.2006.01.004
- Eubank, S., Guclu, H., Kumar, V.S.A., Marathe, M.V., Srinivasan, A., Toroczkai, Z. and Wang, N. (2004) Modelling Disease Outbreaks in Realistic Urban Social Networks. Nature, 429, 180-184. http://dx.doi.org/10.1038/nature02541
- Murray, J.D. (2003) Mathematical Biology. II. Spatial Models and Biomedical Applications. Springer, Berlin, 18.
- Ferguson, N.M., Donnelly, C.A. and Anderson, R.M. (2001) The Foot-and-Mouth Epidemic in Great Britain: Pattern of Spread an Impact of Interventions. Science, 292, 1155-1160. http://dx.doi.org/10.1126/science.1061020
- Roche, B., Guégan, J.-F. and Bousquet, F. (2008) Multi-Agent Systems in Epidemiology: A First Step for Computational Biology in the Study of Vector-Borne Disease Transmission. BMC Bioinformatics, 9, 435.
- Kao, R.R. (2003) The Impact of Local Heterogeneity on Alternative Control Strategies for Foot-and-Mouth Disease. Proceedings of the Royal Society B, 270, 2557-2564.
- Bacaer, N. and Guernaoui, S. (2006) The Epidemic Threshold of Vector-Borne Diseases with Seasonality. Journal of Mathematical Biology, 53, 421-436. http://dx.doi.org/10.1007/s00285-006-0015-0
- Diallo, M., Lochouarn, L., Ba, K., et al. (2000) First Isolation of the Rift Valley Fever Virus from Culex poicilipes (Diptera: Culicidae) in Nature. American Journal of Tropical Medicine and Hygiene, 62, 702-704.
- May, R.M. and Lloyd, A.L. (2001) Infection Dynamics on Scale-Free Networks. Physical Review E, 64, Article ID: 066112.
- Moron, V. (1994) Guinean and Sahelian Rainfall Anomaly Indices at Annual and Monthly Scales (1933-1990). International Journal of climatology, 14, 325-341. http://dx.doi.org/10.1002/joc.3370140306
- Nicholson, S.E. (1979) Revised Rainfall Series for the West African Subtropics. Monthly Weather Review, 107, 620-623. http://dx.doi.org/10.1175/1520-0493(1979)107<0620:RRSFTW>2.0.CO;2
- Beck, L.R., Rodriguez, M.H., Dister, S.W., Rodriguez, A.D., Rejmankova, E., Ulloa, A., Meza, R.A., Roberts, D.R., Paris, J.F., Spanner, M.A., et al. (1994) Remote Sensing as a Landscape Epidemiologic Tool to Identify Villages at High Risk for Malaria Transmission. The American Journal of Tropical Medicine and Hygiene, 51, 271-280.
- De La Rocque, S., Michel, J.F., Cuisance, D., De Wispelaere, G., Augusseau, X., Solano, P., Guillobez, S. and Arnaud, M. (2001) Le Risque Trypanosomien: Une Approche Globale pour une Décision Locale. CIRAD, Montpellier, 151.
- Lobitz, B., Beck, L., Huq, A., Wood, B., Fuchs, G., Faruque, A.S. and Colwell, R. (2000) Climate and Infectious disease: Use of Remote Sensing for Detection of Vibrio cholerae by Indirect Measurement. Proceedings of the National Academy of Sciences of the United States of America, 97, 1438-1443.
- Pin Diop, R. (2006) Spatialisation du risque de transmission de la fièvre de la vallée de Rift en milieu agropastoral sahélien du Sénégal septentrional. Thèse Doctorat, Université d’Orléans, Orléans, France.
- Macdonald, G. (1957) The Epidemiology and Control of Malaria. Oxford University Press, London.
- Kao, R.R. (2002) The Role of Mathematical Modelling in the Control of the 2001 FMD Epidemic in the UK. Trends in Microbiology, 10, 279-286.
- Dutertre, J. (1976) Etude d’un modèle épidémiologique appliqué au paludisme. Annales de la Societe Belge de Medecine Tropicale, 56, 127-141.
- Bah, A., Touré, I., Le Page, C., Ickowitz, A. and Diop, A. (2006) An Agent Based Model to Understand the Multiple Uses of Land and Resources around Drillings in Sahel. Mathematical and Computer Modelling, 44, 513-534. http://dx.doi.org/10.1016/j.mcm.2005.02.014
- Demazeau, Y., Durfee, E., Georgeff, M. and Jennings, N. (1998) Preface. In: Demazeau, Y., Ed., Proceedings of the 3rd International Conference on Multi-Agent Systems (ICMAS), Paris, 3-7 July 1998, 13-14.
- Jaton, J.-F. (1982) Contribution à l’étude des relations pluies-débits dans les petits bassins versants ruraux. Thèse de Doctorat en Sciences Techniques, Ecole Polytechnique Fédérale de Lausanne, écublens, 171.
- Bousquet, F., Bakam, I., Proton, H. and Le Page, C. (1998) Cormas: Common-Pool Resources and Multi-Agent Systems. Lecture Notes in Artificial Intelligence, 1416, 826-837.
NOTES

1Unified Modelling Language, by the Object Management Group (OMG).