Journal of Human Resource and Sustainability Studies
Vol.1 No.2(2013), Article ID:33057,7 pages DOI:10.4236/jhrss.2012.12003
The Ecological Footprint Analysis for Assessing Carrying Capacity of Industrial Zone in Semarang
1Programme of Environmental Science, Diponegoro University, Semarang, Indonesia
2Environmental Science, Diponegoro University, Semarang, Indonesia
3Geography, Gadjah Mada University, Yogyakarta, Indonesia
4Chemical Engineering, Diponegoro University, Semarang, Indonesis
Email: *sudantieko@gmail.com
Copyright © 2013 Sudanti Budihardjo et al. This is an open access article distributed under the Creative Commons Attribution License, which permits unrestricted use, distribution, and reproduction in any medium, provided the original work is properly cited.
Received March 6, 2013; revised April 27, 2013; accepted May 4, 2013
Keywords: ecological footprint; carrying capacity; industrial zone; sustainability
ABSTRACT
The industrial sector progress in Central Java has led to many achievements such as increasing regional economic growth, employment and business opportunities. However, industrial activities also led to a variety of negative impacts associated with environmental and social problems that can degrade the quality of the environment and in turn, will reduce the carrying capacity of the environment. This study aims to find the answer if the ecological footprint of Semarang Industrial Zone has surpassed its biocapacity, seen from the aspect of land suitability, the availability of water and energy as well as waste assimilation, and therefore the ecological deficit could be calculated. This study employed positivistic paradigm with quantitative analysis and explanatory research type. The study is conducted in Semarang Industrial zone using survey and case study, which aims to examine the ecological footprint of Semarang industrial zone. Research materials include ecological footprint calculation of Semarang industrial zone, assessing the magnitude of biocapacity and ecological deficit/remainder. The results showed that Semarang industrial zone has exceeded its environmental carrying capacity (overshoot). To support the sustainability of Semarang industrial activity, cleaner production system and ecological friendly industry that led to the development of Eco Industrial Park should be implemented. More of it, it is important to keep on using natural resources and energy efficiently, not producing the type of products which could harm the natural system, not changing the layout of the zone specified on the masterplan, particularly for open space, for water infiltration and greening, and not violating the basic building coefficient determined.
1. Introduction
The impacts of industrialization in Indonesia can be traced through the planning process and from the formulation of objectives to monitoring and impact management [1] . On the other hand, as Budihardjo stated, from the observation can be identified several weaknesses in the implementation of development planning and environmental management in Indonesia, among others are a strong tendencies that spatial planning is too heavily focused on the spatial aspects of the physical and visual senses [2] . The aspects related to the community and resource planning portion are still lack of attention. Instead, the emphasis of urban and regional planning tends to be more in the aspects of built environment and the lack of attention to optimizing the utilization of the natural environment. These weaknessess will cause disruption of carrying capacity of the environment and lead to environmental degradation, giving rise to a question: has Semarang Industrial Zone exceeded the carrying capacity of the environment? Based on those problems, an analysis of the ecological footprint is needed to assess the ecological footprint of Semarang Industrial Zone.
Reference [3] defined the Ecological Footprint or Appropriated Carrying Capacity of an area as an area of land and water needed in a variety of categories exclusively by residents in the area, to: 1) continuously provide all the resources that are consumed; and 2) continuously provide the ability to absorb all the waste generated. The land is now in the face of the earth, although some can be borrowed from the past (e.g. fossil fuels) and partly allocated in the future (i.e. in the form of contamination, impaired growth of trees caused by ultraviolet radiation, and land degradation) [4] . In line with these opinions [5] stated that the ecological footprint and biocapacity are some values, expressed in units that are separate from the area required to provide (or regenerate) ecosystem services each year such as: agricultural land for provision of plant foods and fiber products; land for grazing and animal products; fisheries land (marine and terrestrial); forests for timber and other forest land to accommodate the uptake of anthropogenic carbon dioxide sequestration (carbon footprint), and the built-up area for residentials and other infrastructures.
Ecological Footprint concept has been widely used by researchers outside the country, mainly in order to calculate: 1) regions (state, province, city, campus); 2) individual (private); 3) agriculture; 4) policy decisions (road versus rail, urban planning); 5) purchase decisions, and others (water resources, tourism). Previous studies showed that during this time, the research focus has been on the ecological footprint of agriculture, settlements, urban, tourism, coastal and country. In industrial zone, whose main issue is pertaining to pollution and environmental damage, research using ecological footprint analysis is still rarely conducted. Hence, it is very interesting to conduct a study at a different focus on ecological footprint of industrial zone, so that the study is original and not a modification of the existing research. The study is expected to provide support in determining policy, strategy and implementation of the concept of ecological footprint in the planning and permitting of industrial zone. The concept applied to the calculation of the industrial zone can also be utilized as an evaluation tool. Industry will benefit from an understanding of the implications of corporate policies on ecological footprint. The magnitude of ecological footprint will stimulate a drive to environmental initiatives to reduce ecological footprint generated by each factory/industry.
The Industrial Zone of Semarang is located in Genuk district, administratively is located in the city of Semarang and has 13 villages and it was once a part of Demak regency. The boundary between the district and the city of Semarang is Babon River. By law number 5/1981 of the Master Plan of Semarang Municipality (1975-2000) and by law number 02/1990 [6] , industrial zone in Genuk district which consists of 800 hectares was stipulated, covering five villages namely Terboyo Wetan, Trimulyo, Muktihardjo Lor, Gebangsari and Genuksari village.
The study area (District of Genuk) is one among 16 districts in the city of Semarang. It is located between latitude 60 94'S and latitude 60 97'S, and at longitude 1100 44'E up to longitude 1100 50'E (Figure 1). The overall area of Genuk District is 27.39 square kilometers [7] , and the study site is located in Genuk, which has an area of 800 hectares (29.2% of the total area of Semarang municipality).
2. Carrying Capacity and Ecological Footprint of Industrial Zone
As defined by some biologists, carrying capacity is individual number of a particular species that can be supported in a given habitat without permanently damaging the ecosystem [8] . According to [9] , the carrying capacity of the environment is a population that can be supported by a particular habitat. If the population of the species has exceeded the carrying capacity of the habitat, the resources needed by the species for survival will be depleted, or waste produced will accumulate and poison the members of other species, or both cases will occur, and the population will eventually extinct. Ecological carrying capacity is the maximum load that can be supported continuously by the environment [10] . Furthermore, Vitousek [11] stated that appropriated carrying capacity is land needed to provide resources and absorb waste. Reference [12] indicated that ecological footprint is “a tool for planning toward sustainability” which is the maximum load of natural resources and waste that can be supported permanently, without disrupting productivity and ecosystem function. The concept is based on the assumption that there is “a certain threshold” on the environment and if it is exceeded, it may result in serious environmental damage, which is impossible to be reversed [13] . As per definition, Wada [14] defined ecological footprint/appropriated carrying capacity of agricultural hydroponic greenhouse compared to conventional agricultural mechanization as follows: “The amount of agricultural land use and land equivalent of other agricultural inputs (such as energy, material, etc.), that are needed to produce certain crops unit per year, using certain agricultural technologies”. Kyushik [15] expressed the concept of carrying capacity of the city as the maximum level of human activity such as population growth, land use, and other physical development, which can be supported by the urban environment without causing serious damage and irreversible damage to the natural environment. Carrying capacity will not be sustainable unless it is based on the utilization of resources in a renewable way.
By the various explanation of ecological footprint and carrying capacity that have been defined, the authors define the ecological footprint of industrial zone as follows: “ecological footprint/appropriated carrying capacity of industrial zone is the amount of land required or equivalent to support the activities of the industrial zone, without causing serious or irreversible damage on the natural ecosystem.” Furthermore, the concept of carrying capacity is defined as “the maximum level of industrial activities that can be supported by the environment without causing serious or irreversible damage on the
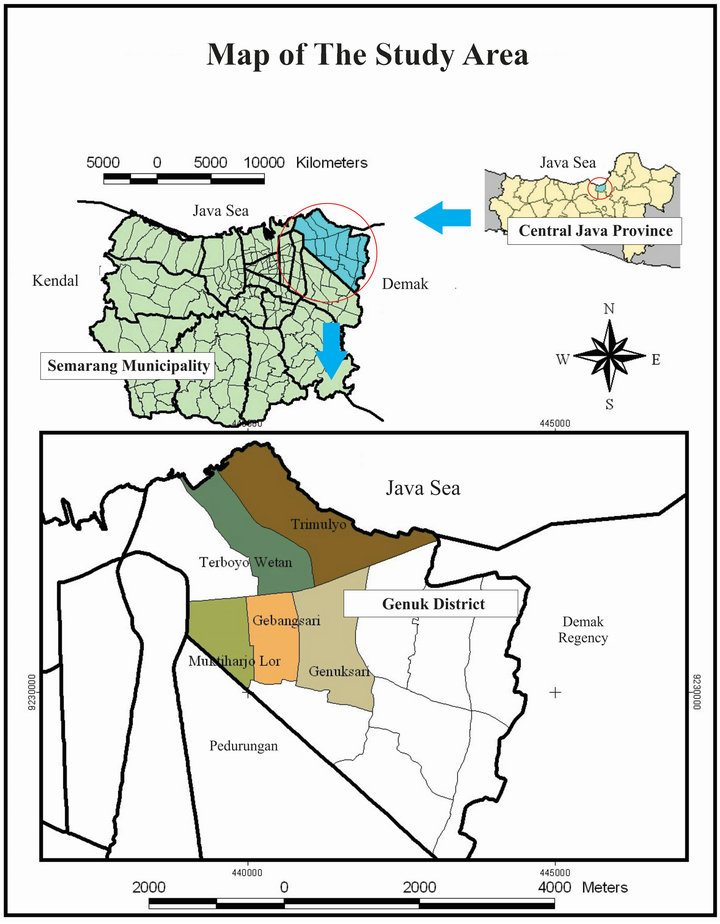
Figure 1. Map of the study area (Semarang industrial zone).
natural ecosystem.” From this explanation, it can be concluded that the concept of carrying capacity is an environmental analysis which is conducted “on-site” the industrial zone (land area, land suitability, natural resources and energy used by industrial activities and waste assimilation), while the concept of ecological footprint is an “off-site” analysis, covering an equivalent area of land required (appropriated) as a result of Industrial activities with the categories of agricultural land, grasslands, forests, built up area, oceans and fossil energy land.
3. Ecological Footprint Analysis as a Tool to Calculate Carrying Capacity
Ecological Footprint is “a tool for planning toward sustainability”. Ecological footprint is an accounting tool which makes it possible for us to estimate the human needs for resource consumption and waste assimilation in a human population or economy, in terms of productive land accordingly [12] . Ecological footprint is a measure of the “load” of a given population to the natural environment. This reflects the area of land required to support the level of resource consumption and waste disposal by population. As a result of advanced technology and world trade, the ecological locations for human population are no longer related to the geographical location. In its current state, the city and the region depend on the productivity of ecological and life support functions of distant places around the world. However, for the entire material flow and energy, there must be the recipient ecosystem and container waste (sinks), and productive land and water resources should be available to support the flow of material and energy. The concept of ecological footprint is an estimate, based on the availability of natural resources in certain areas as well as the flow of services required to support the consumption patterns of the population, the amount of resources used, along with the waste it generates. This concept is a tool to calculate how much the use of natural resources by humans, in order to be conserved. In accordance to ‘Ecological Footprint in Indonesia, 2010’ [16] , ecological footprint calculations are based on the following assumptions: 1) It is possible to trace all of the resources consumed and waste generated; 2) most of the flow of resources and waste can be measured in terms of biological productive area required to sustain resource flows. Resource and waste flows that can not be measured are excluded from the assessment; 3) by weighting each area in proportion of bioproductivity, different types of areas can be converted into a common unit of global hectares (gha) i.e. hectares with an average of world’s bioproductivity; 4) different bioproductive extents can be converted into a single measure, namely global hectares (gha). Each global hectare in one year reflects the same bioproductive and can be summed to obtain an aggregate indicator of the ecological footprint or biocapacity; 5) human demand on natural resources expressed as ecological footprint, can be directly compared with the natural supply and biocapacity, when both are expressed in units of global hectares (gha); 6) the total area required (human demand) may exceed its supply area (nature’s supply), if the demand for an ecosystem exceeds the regenerative capacity of the ecosystem.
4. The Advantages and Disadvantages of Ecological Footprint Analysis
In order to achieve a sustainable future, it is important to understand the meaning of sustainability and how it can be measured [17] . By the various indicators that appear so far in measuring sustainable development, ecological footprint analysis has been widely recognized, that is an analysis estimating resource consumption and waste assimilation in some populations and is defined in the corresponding productive land [12]. As a relatively new analytical instrument, the ecological footprint has some weaknesses that are also recognized by its inventor. Therefore many inputs from the research results by experts around the world were always received, and for this purpose in 2003, Mathis Wackernagel and his team have established a non-profit organization in the form of international think thank, based in Oakland California by the name of the Global Footprint Network (GFN), with branch offices in Geneva (Switzerland) and Brussels (Belgium). Various inputs and corrections of the ecological footprint concept have been improved and updated by GFN that is expected to obtain the maximum formula. In accordance to [18] there are some of the strengths and weaknesses of the ecological footprint analysis.
a) The advantages of ecological footprint method are stated as follows: 1) It is a single unit that allows disaggregation of indicators. 2) It could be widely applied to various programs/activities. 3) It may be top down or bottom up. 4) It is useful as a means of communication policy. 5) The method is constantly being updated and improved by Global Footprint Network. 6) It is able to indicate the nature of limited natural capital. 7) It creates credibility as a policy tool. 8) It has an ability to analyze sustainable development of a vague concept into measurable objectives. 9) It allows for practical applications on the concept of sustainability “think globally and act locally”.
b) The disadvantages in the ecological footprint analysis are stated as follows: 1) Ecological footprint analysis uses hypothetical land, which does not represent the actual land use. 2) It simplifies the use of natural resources, 3) It risks as having double counting. 4) Mostly are a portraits of consumption. 5) It does not provide a clear policy guidance except for the subtraction of consumption. 6) Sometimes, it is based on questionable assumptions.
Regardless of the disadvantages of ecological footprint analysis method, this study employed the method of ecological footprint because the authors assume that among other methods, the ecological footprint is the most appropriate method to analyze the sustainability of Semarang Industrial Zone from a vague into measurable concept as well as credible as a policy tool.
5. The Relationship between Ecological Footprint and Carrying Capacity
Ecological footprint concept is very closely linked to the concept of ecological carrying capacity. Ecological Footprint is expressed in ha/capita, while the ecological carrying capacity is usually expressed in units/ha, thus making the concept as if it were the opposite of each other [19] . Carrying capacity is a technical term that refers to the maximum population of species that can be supported by land or sea. Various species can be easily defined, as well as the need for consistent consumption, so that the carrying capacity for the species is relatively easy to determine and calculate. But for humans, the estimated carrying capacity requires assumptions about future resource consumption per person, the standard of living in the “want it” (in contrast to those in “need it”), as well as the productivity of the biosphere, and technological advances. Carrying capacity for humans thus is speculative and difficult to define.
Ecological footprint analysis answers the questions from a different angle. Ecological footprint can not be expected to be speculative, but rather a calculation of past conditions. Ecological Footprint does not ask how many people could be supported by the earth, instead, it asks in reverse. By taking into account the conditions of the present and the past, the ecological footprint asks how many planets it takes to support all people living on earth at any given time, at a certain standard of living, in particular biological and technological production. Hence ecological footprint analysis is a scientific research and calculations that require a documented analysis and time series data [12] .
6. Ecological Footprint Calculation of Semarang Industrial Zone
The elaborated concept of [12] about the ecological footprint is as follows.
1) Ecological footprint is the maximum load of population or specific economic activity which is able to be safely supported by the environment. 2) It is the average of natural resources and waste generated that is able to be supported permanently without disrupting productivity and specific economic function. 3) The analysis allows us to estimate how much natural resources consumption and waste assimilation required by human population or to a particular economic activity related to productive land.
In this paper, the third concept focusing only on industrial activities is discussed as follows:
a) the consumption of natural resources needed by population and economic activity (by means of industry), and b) waste assimilation necessary for population and economic activity (industry).
The consumption of natural resources for human needs to be examined in this study is land, water and energy. Waste assimilation necessary for Semarang industrial activities is assimilative capacity of Babon River.
If the ecological footprint calculation is applied to an urban area or a country, the population is the people living in the region, while in this research, since the area is industrial zone consisting of 4 industrial estates within the industrial zone, the population is the industries and its activities. The number of processing industries, which were calculated, was 70 industries, while the rest of industries (100 units) were not calculated since they were warehouse, garage and vacant land. The samples were derived from the population by purposive sampling and 21 samples of industry were scrutinized. The resources used by 21 industries were very diverse and derived from various categories of natural resources and production units, respectively, from the furniture industry, plastic, oil, coal, shrimp paste, cardboard, coffee, thinner and wood glue (Table 1).
Ecological Footprint formulas for industrial processes are utilizing modified formula [20] as follows:
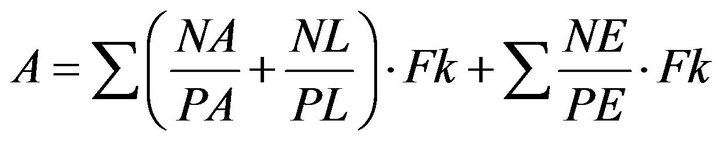 (1)
(1)
A is the area, expressed in hectares (ha), both for the energy (E), resources (N) or waste (L). NA is the original value of each category of resource, namely the effectiveness of PA production, NE is the value of energy, PE is equal to the energy effectiveness and Fk is the equalizing factor. Land categories used in the calculation of the furniture are forest land by an equalizing factor of 1.33, and carbon land sequestration (CO2) with the same equalizing factor of 1.33. Plastic industries utilize fossil energy land by an equalizing factor of 1.33, industrial wood glue, is stated with equalizing factor of 0.50, the coal industry with an equalizing factor of 1.33, cardboard industry (corrugated box) with an equalizing factor of 1.33, cooking oil industry equalizing factor of 2.64. Coffee industry is stated with an equalizing factor of 2.64
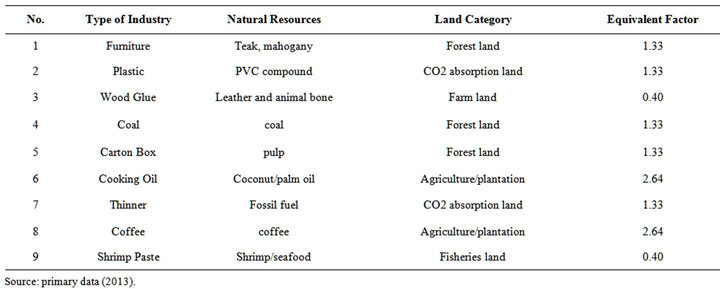
Table 1. Type of industry and natural resources used.
and thinner with an equalizing factor of 1.33, in accordance with [16] .
In the same mathematical calculations, with type of industries and number of samples, the values of the ecological footprint of each type of industry are presented at Table 2.
To calculate the ecological footprint of Industrial Zone (800 hectares), the following calculation was used:
The ecological footprint of Industrial Zone = 800/300 × 70/21 × 422.4 gHa = 3755 gHa. In other words, Semarang Industrial Zone require land appropriation 4.7 times larger than the actual wider land. For a comparison, the ecological footprint refers to the number of Central Java province in 2010, the magnitude of the total ecological footprint of Central Java province amounted to 18,271,834 gHa (Ecological Footprint in Indonesia, 2010). Therefore, the size of ecological footprint of Semarang industrial zone is 2.05% of the ecological footprint of Central Java. Furthermore, in order to see the capacity of ecosystems to generate resources and waste absorption capacity, the magnitude of biocapacity for industrial zones is calculated, with the formula of EF [12] :
 (2)
(2)
BC = Biocapacity.
A = land area of each land category.
YF = yield factor (crop factor).
EqF = Equivalence Factor (factor equivalent to the category of land referred).
By referring to [21] in (Table 3), the amount of Yield Factor for forest land is assumed to be 1 (World average number, 2007), so the magnitude of biocapacity is: BC = 800 × 1 × 1.33 = 1064 gHa.
To find out if an area has exceeded the environmental carrying capacity, it is necessary to obtain the value of residual or ecological deficit. The magnitude of the deficit/ecological remainder is calculated using EF formula [12] as follows:
 (3)
(3)
ED = ecological deficit.
EF total = total ecological footprint.
BC total = total biocapacity.
The magnitude of Ecological deficit (ED) = 3755 gHa − 1064 gHa = 2691 gHa.
From these calculations, it is known that the Industrial zone has undergone ecological deficit amounted to 2691 gha. In other words, the activities of Semarang Industrial Zone has exceeded the carrying capacity of its environment. The Ecological Deficit per hectar is 2691/800 = 3.36. And referring to [22] the Ecological deficit is categorized as ‘very severe deficit region’ (DE > 2.0). According to Ecological Footprint of Indonesia (2010), the overall value of the Indonesian biocapacity is 1.12
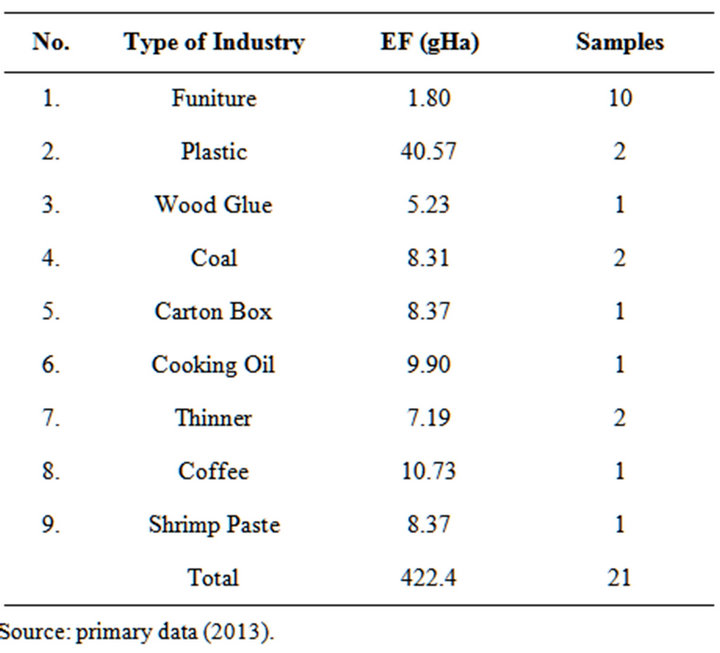
Table 2. Type of industry and the ecological footprint.
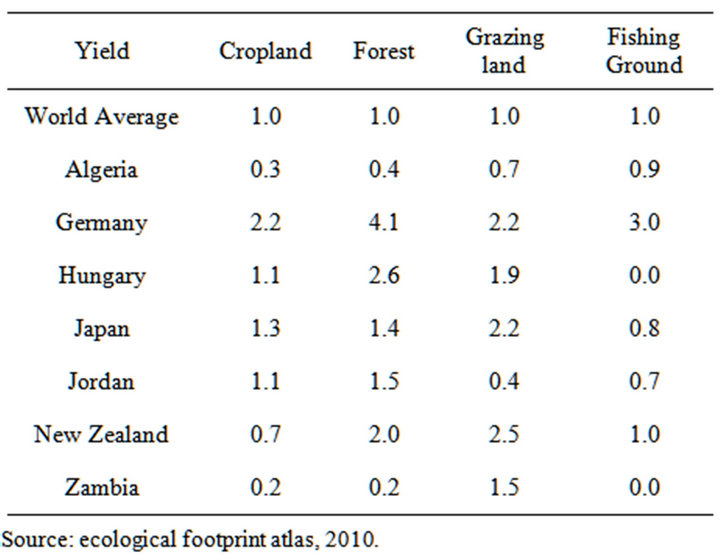
Table 3. Some examples of yield factor in selected countries, 2007.
gha/person, which is still higher than its ecological footprint of 1.07 gha/person. Thus the ecological surplus is not very significant in the amount of 0.05 gHa. The results of these calculations can be a reference for the community, that in order to meet the needs of the people by utilizing the natural resources they should always pay attention to the carrying capacity of each area. Hongkong Ecological Footprint Report 2008 [23] , indicated that Indonesia is a middle-income countries with an ecological footprint slightly larger than it’s biocapacity of 2.6%. Due to the relatively small carbon footprint, the ecological footprint of Indonesia showed patterns of resource consumption that is based more on basic needs such as food, and less on consumer spending. With the adequate forest biocapacity, the market opportunities are now emerging for carbon credits (carbon cap). It is an opportunity for Indonesia to get a revenue increase for the national budget as well as helping to protect the natural resources assets (rainforest, marine, etc.) in Indonesia.
7. Conclusion
To support the sustainability of Semarang industrial zone, an appropriated land area of 4.7 times wider than the industrial zone is required, which means that the biocapacity has been exceeded to support the sustainability of the region and has undergone ecological deficit. Then it is time to apply cleaner production system that leads to the development of Eco Industrial Park by utilizing natural resources and energy efficiently and not producing type of products which will harm the natural system, not changing the layout of the zone specified in the initial masterplan with artifacts/buildings (e.g. mall, street, road) particularly for open space for water infiltration or greenery, and not violating the basic building coefficient determined.
REFERENCES
- S. P. Hadi, “Planning for Industrialization in Central Java, Indonesia: The Process, The Impacts and The Alternatives,” Unpublished Dissertation, School of Community and Regional Planning The University of British Columbia, Vancouver, 1993.
- E. Budihardjo and S. Sudanti, “Environment Concepts in Urban Development,” PT Alumni Publisher, Bandung, 2009.
- W. E. Rees, “Ecological Footprints and Appropriated Carrying Capacity: What Urban Economics Leaves Out,” Environment and Urbanization, Vol. 4, No. 2, 1992, pp. 121-130. doi:10.1177/095624789200400212
- M. Wackernagel and W. Rees, “What Is an Ecological Footprint?” Journals Collection in the Sustainable Urban Development Reader, Stephen M. Wheeler and Timothy Beatley, Elsevier Limited, Oxford, 2006.
- A. Galli, M. Borucke, M. Wackernagel, D. Moore and K. Iha, “Accounting for Demand and Supply of the Biosphere’s Regenerative Capacity: The National Footprint Accounts’ Underlying Methodology and Framework,” Ecological Indicators, Vol. 24, 2013, pp. 518-533.
- Development Planning Agency of Semarang Municipality, “Spatial Plan of Semarang City: 1975-2000,” Semarang, Indonesia, 1975.
- Central Bureau of Statistics of Semarang Municipality, “Semarang City in Figures,” 2012.
- E. P. Odum, “Ecology and Our Endangered Life-Support Systems,” Sinauer, Sunderland, 1989.
- D. H. Meadows, “The Limits to Growth,” Universe Books, New York, 1972.
- W. R. Catton, “Carrying Capacity and the Limits to Freedom,” Paper Prepared for Social Ecology Session 1, Xl World Congress of Sociology, New Delhi, 1986.
- P. M. Vitousek, P. R. Ehrlich, A. H. Ehrlich and P. A. Matson, “Human Appropriation of the Products of Photosynthesis,” BioScience, Vol. 36, No. 6. 1986, pp. 368-373. http://links.jstor.org/sici?sici=00063568%28198606%2936%3A6%3C368%3AHAOTPO%3E2.0.CO%3B2-1
- M. Wackernagel and W. Rees, “Our Ecological Footprint. Reducing Human Impact on The Earth,” New Society Publishers, Canada, 1996.
- J. Kozlowski, “Threshold Approach in Urban Planning, Territory and Environment: Theory and Practice,” Translated by Purbowaseso, B. Publisher University of Indonesia (UI-Press), Jakarta, 1997.
- Y. Wada, “The Appropriated Carrying Capacity of Tomato Production: Comparing the Ecological Footprint of Hydroponic Greenhouse and Mechanized Field Operations,” Unpublished Thesis, School of Community and Regional Planning, The University of British Columbia, Vancouver, 1993.
- O. Kyushik, Y. Jeong, W. Lee and J. Choi, “Determining Development Density Using the Urban Carrying Capacity Assessment System,” Landscape and Urban Planning, Vol. 73, No. 1, 2005, pp. 1-15.
- Directorate General of Spatial Planning, Ministry of Public Works, “Ecological Footprint in Indonesia,” Jakarta, 2010.
- M. Wackernagel and J. D. Yount, “The Ecological Footprint: An Indicator of Progress towards Regional Sustainability,” Environmental Monitoring and Assessment, Vol. 51, No. 1-2, 1998, pp. 511-529. doi:10.1023/A:1006094904277
- J. C. J. M. Van den Bergh and H. Verbruggen, “Spatial Sustainability, Trade and Indicators: An Evaluation of the ‘Ecological Footprint,” Ecological Economics, Vol. 29, No. 1, 1999, pp. 61-72.
- Bicknell, et al., “New Methodology for Ecological Footprint with an Application to the New Zealand Economy,” Ecological Economics, Vol. 27, No. 2, 1998, pp. 149-160. doi:10.1016/S0921-8009(97)00136-5
- M. Herva, A. Franco, S. Ferreiro, A. Alvarez and E. Roca, “An Approach for the Application of the Ecological Footprint as Environmental Indicator in the Textile Sector,” Journal Hazardous Materials, Vol. 156, No. 1-3, 2007, pp. 1-3.
- B. Ewing, S. Goldfinger, M. Wackernagel, J. Kitzes and M. Stechbart, “Ecological Footprint Atlas,” Global Footprint Network, Oakland, 2010, pp. 1-87.
- World Wide Fund on Nature (WWF)—China Council for International Cooperation on Environment and Development (CCICED), “Report on Ecological Footprint in China,” 2006.
- S. Niazi, S. Goldfinger, M. Stechbart, A. Reed, S. Rizk and C. Chu, “Hongkong Ecological Footprint Report: Living Beyond Our Means,” Worl Wide Fund (WWF) and Global Footprint Network, 2008. http://awsassets.panda.org/downloads/china_footprint_report_final.pdf
NOTES
*Corresponding author.