International Journal of Geosciences
Vol.09 No.01(2018), Article ID:81777,25 pages
10.4236/ijg.2018.91002
A Simulation Approach for Screening of EOR Scenarios in Naturally Fractured Reservoirs
Ahmadreza Ejraei Bakyani1*, Azadeh Namdarpoor1, Amir Nematollahi Sarvestani1, Abbas Daili1, Seyed Yaser Ganji1, Feridun Esmaeilzadeh2
1Department of Petroleum Engineering, School of Chemical, Petroleum, and Gas Engineering, Shiraz University, Shiraz, Iran
2Department of Chemical and Petroleum Engineering, School of Chemical, Petroleum, and Gas Engineering, Shiraz University, Shiraz, Iran

Copyright © 2018 by authors and Scientific Research Publishing Inc.
This work is licensed under the Creative Commons Attribution International License (CC BY 4.0).
http://creativecommons.org/licenses/by/4.0/


Received: November 27, 2017; Accepted: January 13, 2018; Published: January 16, 2018
ABSTRACT
Undoubtedly, plenty of hydrocarbon sources are located in carbonate rocks, particularly those which are naturally fractured that is still needed to study their characterization, because of their complex and unconventional behavior. Therefore, applying any processes that cause Enhancing Oil Recovery (EOR) from Naturally Fractured Reservoirs (NFR) seems necessary and useful. However, selecting the best developed scenario is always challenging. Screening criteria would determine the possibility of implementing an EOR process. While, utilizing trade marketing simulators can solve this problem. Moreover, simulation can evaluate other parameters such as water cut and gas-oil ratio. In this research, an aquifer-supported Iranian NFR with two parts that are separated to each other with a shale layer is considered in order to select the best EOR scenario. The fluid model is created using PVTi software. Various production scenarios included natural depletion, water flooding, miscible carbon dioxide injection, water-alternating-gas (WAG) injection, simultaneous water-alternating-gas (SWAG) injection, hybrid injection, and gas recycling are simulated in ECLIPSE Compositional (E300) and their recovery factor recorded as the target parameter. The developed scenarios are designed in a way that gives the optimized results, i.e. higher recovery factor, less water cut as well as the less gas-oil ratio. As a result, SWAG shows better conditions and is recommended for the further studies of the reservoir management plan in the future. Also, the role of the aquifer in the SWAG scenario is positive by creating a natural WAG in addition to the SWAG. Additionally, the average reservoir pressure through fractures reduces less in the SWAG than the other Scenarios, the oil and gas production rate reduce less in the SWAG and SWAG/ miscible gas respectively than the other scenarios. The maximum and the minimum water cut are related to the water flooding and SWAG, respectively. Finally, the simulation approach of EOR screening in NFR is better than other approaches, from the perspective of economic issues as well as the simplicity of the methods.
Keywords:
Naturally Fractured Reservoir, Enhanced Oil Recovery, Compositional Simulation, Reservoir Fluid Model, Water-Alternating-Gas Injection

1. Introduction
Normally, production from an oil reservoir is started with the help of the stored energy in the reservoir, and after a while, depending on reservoir conditions, this energy decreases and will not able to produce and finally goes to the stage that production is not economical. Oil production by this natural mechanism called the primary production and EOR processes begin at this stage. EOR focuses on the process that distinguishes oil production process from the initial oil production process [1] [2] [3] . Undoubtedly, energy demand is growing annually and oil will be the dominant source for next two decades [4] , as a consequence of applying extraction technology is critically significant. Therefore, applying new technologies for improving oil recovery from conventional reservoirs or exploitation of unconventional reservoirs could be an appropriate strategy [5] . Conventional oil reservoirs are easy to access, while, unconventional sources are absolutely challenging. Development of new emerging technologies such as horizontal drilling and hydraulic fracturing is a solution to produce more oil from unconventional reservoirs. In contrast, Improved Oil Recovery (IOR) and Enhanced Oil Recovery (EOR) target the remained oil in conventional reservoirs to increase the recovery factor.
Water flooding and gas injection are two common methods usually called secondary recovery in order to maintain reservoir pressure. Tertiary recovery or EOR is another technique to produce further oil.
EOR is a term corresponded to methods applied for recovering oil from a petroleum reservoir beyond that recoverable by primary and secondary methods [6] . Primary and secondary recovery target the mobile oil through the reservoir, in contrast, EOR targets the immobile oil that is trapped due to the capillary and/or the viscous forces. In another way, the main objective of all EOR methods is the reduction of the residual oil as well as increasing the volumetric (macroscopic) sweep efficiency or improving the displacement (microscopic) efficiency, as compared to an ordinary water flooding. Regarding the first mechanism, the volumetric sweep efficiency is improved by reducing the mobility ratio between the displacing and the displaced fluids (e.g., polymer flooding, water-alternating-gas processes). According to the second mechanism, the oil displacement efficiency gets better by the reducing oil viscosity (e.g., thermal flooding), the capillary force or the interfacial tension (e.g., miscible flooding).
It is important to identify the volume of remaining oil and the drive mechanisms that are essential to improve recovery beforehand implementing an EOR process. In addition, selecting the most proper EOR method is crucial important [7] [8] [9] . Hydrocarbon reservoirs vary in their rock and fluid properties and their development scheme could be different. Utilizing screening criteria is the first part of the analysis and could determine the possibility of any scenario [10] [11] , however, this tool cannot determine the value recovery factor at the end of the project [12] . Therefore, applying simulation methods can solve this problem in order to investigate the possibility of any scenario. From another point of view, hydrocarbon reservoir is not a static phenomenon although its properties will alter during production. Simulation can track the whole changes and state the conditions to be applied for making a decision about future of the field (Figure 1).
Iran possesses lots of conventional oil reserves and will play a significant role in the preparation of fossil fuel resources in near future and should step its
 (a)
(a)
 (b)
(b)
Figure 1. Distribution of proved reserves in the different regions [13] .
production up by means of EOR technologies. At present, many of Iranian oil reservoirs are at their second period of the life-time and their productivity is decreasing. In addition, exploration of new oil reservoirs takes time and expenditure. Therefore, EOR implementation is absolutely essential to exploit more oil from these mature reservoirs. Notice that, at this particular time most of these reservoirs produce by their natural mechanisms (i.e. crude production in these reservoirs is controlled by active aquifer, gas cap, or rock and fluid expansion.) and just a few cases are under immiscible gas injection [14] . Most of these reservoirs have carbonate rock type which is naturally fractured. From another point of view, enormous consideration should be taken into account for implementing EOR in naturally fractured reservoirs (NFR). As mentioned above, EOR screening should be the first step. Unfortunately, the provided screening criteria have less focus on NFR. On the other seeking for a better solution like utilizing simulation can reduce uncertainty [15] .
As literature surveys, Dollarhide field in West Texas under CO2, WAG, and hybrids of both processes was modeled and simulated. Simulation results show that 8.8% of reservoir hydrocarbon volume gas injected. Then WAG with a ratio of 1/1 with 4.42% of volume hydrocarbon reservoir was applied. The ultimate recovery of hybrid shows 2.1% of reservoir oil volume lower than the WAG and 0.7% of reservoir oil volume higher than the gas injection [16] . Water and gas injectivity test was done in the WAG (tertiary level) in the San Andres Formation of Mabee field and was simulated in pilot plants in form of hybrid and compared with experimental results. The results indicate good agreement between models and experimental results. Injectivity of carbon dioxide during the second injection cycle and water injectivity increases in comparison to water flooding before WAG [17] . Water flooding is applied in many oil fields in the North Sea after production is decreased and will soon require improved oil recovery processes (IOR), such as a decrease in pressure, gas injection, and WAG. So, WAG injection process in the hydrophilic micro model was studied after water flooding [18] [19] [20] [21] [22] . Asphaltene precipitation affected by oil production and gas injection during WAG in one of Abu Dhabi’s oil reservoirs was studied with the help of infrared spectral analysis system technology [23] . One of the Kuwait carbonate reservoirs undergoing processes of CO2, WAG, and SWAG (water injection from the upper reservoir layer and gas injection from the lower reservoir layer) was simulated. Finally, economic process for the reservoir, 9 years alternately water injection from the upper reservoir layer and gas injection from the lower reservoir layer and injection of 6% of the pore volume for carbon dioxide injection was offered in five stages [24] . A part of the reservoir in the Jilion oil field (in China) with a reverse nine-point model, the process of WAG (water alternately carbon dioxide) was simulated compositionally. The simulation results and test pilot show that WAG injection after water flooding is an effective method for low permeable reservoirs and causes production reduction and water cut increasing [25] . Weyburn oil field is one of the largest oil fields in the United States that carbon dioxide was injected in September 2000. The injection and production data of last years from various sections of the reservoir were examined by 9 spot model. The production results by the different regions with vertical production and injection wells related to WAG have a good match with the model provided by Kinder Morgan for numerous industrial standard [26] . The carbon dioxide injection thermodynamic criteria were investigated to Ivanic oil field located 35 miles from the capital of Croatia. WAG for EOR has shown the most appropriate process [27] . Finally, the CO2-oil molecular diffusion in the miscible CO2 injection through oil reservoirs was studied based on the adaptive neuro-fuzzy inference system (ANFIS) that was applied to determine the CO2-oil molecular diffusion coefficient in the EOR scenarios such as CO2 miscible injection as well as applying the particle swarm optimization algorithm (PSO) to optimize the ANFIS model parameters [28] .
In this research, EOR screening in a special case of Iranian NFRs which supported with an aquifer will be investigated. First and foremost, the simulation model is briefly discussed. Next, the results of different simulated scenarios including natural depletion (production by vertical, horizontal, and deviated well), water flooding, miscible carbon dioxide injection, water-alternating-carbon dioxide injection, simultaneous-water-gas injection, hybrid injection and gas recycling are discussed. At last by comparing the results of each development scheme the best scenario will be introduced.
2. Methodology
The case study is a carbonate oil reservoir which is located in the southwest of Iran that is no production. Thus, applying various simulation scenarios for the development of the reservoir will be beneficial. Simulation studies were performed in natural production, water and gas flooding, gas recycling, and water-alternating- carbon dioxide injection. In addition, advantages, disadvantages, and efficiency of the abovementioned methods were presented within the work.
Simulation Model: In the provided simulation model, reservoir rock properties including RCAL (permeability, porosity, etc.) and SCAL (oil-water and oil-gas relative permeability) data, aquifer type, reservoir fluid (including oil, water and gas) properties, were investigated in order to gain a better knowledge of the reservoir to obtain the best simulation results.
Reservoir Rock Model: The average height of reservoir rock is 278 meters, and the cross-sectional area is less than 3 hectares. Initial water oil contact (WOC) is at a depth of 2910.7 meters, which is approximately located 4 to 6 meters away from the free water level. Other properties related to the reservoir rock and its initial conditions are given in Table 1.

Table 1. Rock properties of the reservoir and its fluid saturation.
Aquifer Model: Presence of aquifer in various oil bearing reservoirs is likely which can work as a source of energy to pump oil from beneath the earth to surface. As pressure drop occurs in the reservoir, the water flows from the aquifer into the oil layer in order to compensate the pressure reduction. The following factors can control the strength of an aquifer: 1) Expansion of water or any other known or unknown species in the aquifer, 2) Rock expansion, and 3) Artesian flow (the aquifer is located at an elevation higher than the reservoir level).
Based on the reported information, the aquifer below the reservoir has a volume of nearly less than 1.8 million cubic meters. Therefore, Carter-Tracy aquifer model is selected to complete the simulation model. Although Carter-Tracy aquifer is more suitable for radial symmetrical reservoirs, for other models such as the intended one in this research could be applied. The main benefits of this model are simple approximation trend to water flow (constant flow rate) and avoiding superposition laws.
Reservoir Water Model: Even though connate water is identical to oil, it is less affected by temperature, pressure, and the amount of dissolved gas. Water compressibility in some cases helps to produce a considerable amount of oil at the top of the bubble point pressure. Therefore, defining the PVT properties of water is of crucial importance.
Physical properties related to the reservoir water are given in Table 2.
Oil-Water and Oil-Gas Relative Permeability Model: Permeability is a rock characteristic as long as fluid saturation is 100% clear. Rock permeability in the presence of a fluid with less than 100% saturation is called effective permeability and effective permeability per absolute permeability is called relative permeability. Various tests were conducted on the core samples and the required curves of relative permeability and capillary pressure for water-oil and gas-oil systems were obtained.
Reservoir Hydrocarbon Model: The reservoir contains only oil and the gas cap has not been reported in the upper parts. Furthermore, in the upper regions of the reservoir gas saturation is zero. Therefore, the model initially is a single phase oil reservoir. It is worth noting that, the reported initial pressure is higher than the bubble point pressure that caused an under saturated oil reservoir was taken into considerations. Physical properties related to the reservoir fluid are given in Table 3.
Reservoir Fluid Model: In this part reservoir fluid model was created by PVTi which is the PVT module of ECLIPSE software from Schlumberger. A variety of experimental data which are obtained through the PVT tests, conducted in the laboratory with reservoir pressure and temperature, were imported as input into
Table 2. Water properties of the reservoir obtained from PVT tests.
Table 3. Fluid properties of the reservoir.
the software to regress the equation of state. The equation of state used to model the reservoir fluid is Peng-Robinson (PR) EOS.
Fugacity coefficient of component i in a liquid phase of hydrocarbon mixture can be calculated from Equation (1) as below:
(1)
In the same way, fugacity coefficient of component i in the gas phase of hydrocarbon mixture can be calculated from the above-mentioned equation.
Different relationships are provided to calculate the interaction coefficient between different species in PR equation of state which is valid for mixtures containing N2, CO2, and CH4. For hydrocarbon mixture containing CO2, following equations are presented:
(2)
(3)
(4)
. (5)
To correct to pressure, equation (6) can be used as follow:
. (6)
Finally, flash calculations are applied as a part of reservoir fluid model due to the compositional simulation.
Reservoir Gridding: Reservoir pore volume is equivalent to 6.12 MMSCM and the 3-dimensional view is as Figure 2(a) and Figure 2(b). This model has discretized 22 × 22 × 100 grids in x, y and z direction respectively. Thirteen lower grids in the z-direction are in the aquifer and layer 11 is an impermeable shale that divides the reservoir into two parts. The upper part of the reservoir is low permeable and the production of oil from the producing wells in this area are low. Permeability in the z-direction is considered as 0.1 of horizontal permeability. Distribution of porosity and permeability changes widely in different regions as well as the fluids saturation and oil-water contact which is leading to an incredible uncertainty in the study of reservoir rocks, fluids and the amount of oil in place. It is worth noting that, the basic reservoir model has 12,100 blocks which have risen to four times higher to achieve high accuracy calculation. Although this process increases the runtime but will bring more accurate results. In total, about 1500 blocks of 48,400 blocks of reservoir rock model are related to the aquifer.
 (a)
(a) (b)
(b)
Figure 2. Schematic of the gridded system of the reservoir.
Drilling path and perforation locations were selected in a manner to gain the optimum value of oil production. Despite low permeability, aquifer acted in a way that prevents the release of gas in the system. It is critically important to note that, the release of gas below the critical gas saturation in the system leads to the reduction in residual oil saturation which finally contributes to further oil recovery. This possibility only will occur in completed vertical wells with the high flow rate in the porous layers 14 - 19 and 29. Due to the reservoir heterogeneity in this area aquifer did not have the ability to respond quickly to pressure. However, saturation in these areas quickly reaches to critical gas saturation and gas flows freely through the wells (i.e. GOR increases).
Production Scenarios Simulation: Different simulation scenarios of primary, secondary, and tertiary recovery have been carried out with ECLIPSE compositional (E300) software.
3. Results and Discussion
First and foremost, the obtained results of static and reservoir fluid models are investigated then simulated production scenarios and their results are taken into account.
Reservoir Rock, Water, Relative Permeability, and Hydrocarbon Models Results
With the help of required physical properties, PTH, which is the critical threshold pressure for penetration of water flow into the reservoir, is calculated as 1.18 Bara. In accordance to oil wet reservoir rock, residual oil saturation is approximately high and non-wetting phase (water) is drained by wetting phase (oil) and there is a drainage process which critical threshold pressure for starting of this that is around 1.18 Bara. The holes uniformity coefficient, λ, which shows pore size distribution, is calculated as 0.875. It is crystal clear that the pore size distribution is absolutely high and there is a wide range of pore sizes. Owing to high pore size distribution, low λ, there is high capillary pressure within the reservoir which requires huge forces for displacing oil phase.
With the help of water viscosibility, Cµw, which is calculated as 1.0152 × 10⁻⁴ 1/Bara, can be showed water viscosity variation with the pressure. However, the calculated water density of reservoir conditions is reported as 1095 kg per cubic meter, (SGwat = 1.1) respectively. However, formation water density has been reported 1120 kg per cubic meter at standard conditions (SGwat = 1.12). So, this shows that decreasing density due to temperature increasing impact is dominant in comparison to increasing density due to the pressure increasing impact.
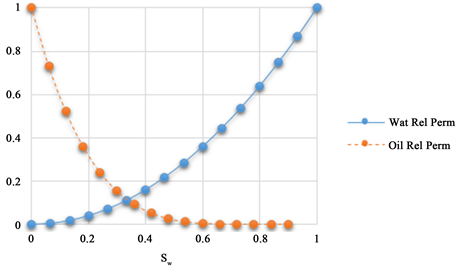
Tests conducted on the reservoir rock sample and Figure 3(a) and Figure 3(b) show the rock dynamic data for water-oil and gas-oil system. The fitting method of the relative permeability curves is the linear regression technique.
Also, the components percentage ternary diagram and the phase diagram of crude oil show the hydrocarbon phase is an ordinary black oil with the critical temperature and pressure 556.19 K and 96.05 Bar, respectively, while, bubble point pressure is 138 bar.
When injecting carbon dioxide into the oil sample, although the injection pressure is less than First Contact Miscibility (FCM) pressure, Multi Contact Miscibility (MCM) could be accounted for low pressures. Software calculations show that evaporation multi stage miscible injection at pressure 208.6 Bara and the composition of the mixture in the final stage as well as its properties are provided in Table 4.
Table 4. The composition of the mixture in the final stage of MCM process and its properties.
 (a)
(a) (b)
(b)
Figure 3. Relative permeabilities curves.
Simulation Scenarios Results
Primary Recovery: Natural Depletion
First Scenario: Natural Production with Vertical Wells
In the simulation of the natural production process of the reservoir, two production wells were completed at the corners of the reservoir (P1, P2), which produced at a specific bottom hole pressure and same flow rate (100 m3/Day) for 40 years. As production is initiated, pressure declines, therefore, aquifer water invasion rate into the oil zone increases and water cut rises as well. Oil production rate decreases due to energy drop of the reservoir, however, oil production rate of production well number 1 is higher in contrast to well number 2 that is due to the fact that well number 1 penetrates a high permeable zone. All in all, selecting the proper zone for drilling a production well is crucially important which can vitally impact on oil production rate, pressure decline and finally water invasion rate into the oil zone for compensation of pressure drop. Natural production recovery factor is obtained 30.62% till the end of simulation time. Due to the high volume of results, the Figure of this section has been ignored.
Second Scenario: Natural Production with Horizontal and Deviated Wells
Due to several reasons like low vertical permeability, layers with different permeability, and close location of productive layers to the aquifer or under the shale layer in this study, the possibility of horizontal wells drilling was uncertain and drilling deviated well as well as horizontal well could be a logical scenario. The deviated well was completed in the more permeable part of the reservoir, the blocks around the block (1, 1) and the 300 meters in length horizontal well was completed in the block (22, 22) both in the permeable layer 72. Oil production rate in both cases decrease because of pressure decline, however, oil production rate for deviated well is higher than horizontal well. It is because of high drainage radius of deviated well in many productive layers in comparison to one productive layer which horizontal wells will cross. Although water cut in both cases rises as oil production rate decreases, water cut increment for the horizontal well is higher than deviated well owing to the fact that its drainage radius is close to the aquifer (to 98%). Due to the high volume of results, the Figure of this section has been ignored.
Secondary Recovery: Water Flooding
The presence of the aquifer is vitally significant where as it can supply requires pressure for water penetration into an oil bearing layer by means of hydrostatic head of water. Water injection rate of 200 SCM/Day requires a large value of pressure in order to flow water into the oil zone (almost 550 Bara in early simulation time) in which leads to migration of injected water and oil into the aquifer that limits aquifer rate into the oil layer (water injection rate is higher than WOC pressure). In contrast, water injection rate of 100 SCM/Day is too low and causes no water injection, whereas oil spread into the aquifer that contributes to water coning. Therefore, by examining different water injection rates the optimize value of 113 SCM/Day was determined. At this oil exploitation rate, the aquifer can feed into the oil zone. Water cut of this process is obtained around 40% and oil production rate changes from 190 SCM/Day to 48 SCM/Day at the end of simulation time. Furthermore, after 25 years aquifer rate into the oil zone decreases. By the way, although the aquifer is limited, water flooding could be absolutely a good candidate for pressure maintenance. Water flooding recovery factor is obtained 44.25% till the end of simulation time. Due to the high volume of results, the Figures of this section have been ignored.
Tertiary Recovery: Miscible Carbon Dioxide Injection
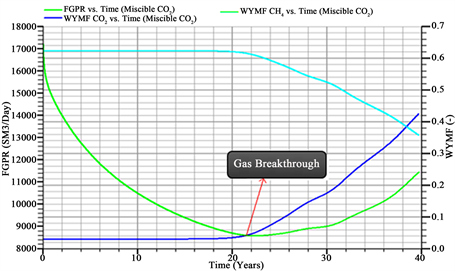
Injecting CO2 at a rate of 20,000 SCM/Day can supply a pressure difference in which at this pressure and reservoir temperature CO2 changes to the liquid. Moreover, high CO2 injection rate causes gas to reach the production wells in early time. It is critically important to note that, the presence of a high percentage of CO2 in the extracted fluid can bring enormous damages in surface facilities or oil-gas separation systems like corrosion, as well as reducing gas heating value. To add, it is clear that low CO2 injection rate leads to the small amount of recovered oil in comparison to high injection case. Therefore, based on try and error an optimized value of injection rate at 12,000 SCM/Day can provide the required circumstance such as suitable aquifer injection rate, CO2 injection pressure, gas front velocity, and oil production rate. The important point that should be taken into account is that the value of produced gas is identical to that is injected i.e. 12,000 SCM/Day.
CO2 injection conducted in 100 meters below and 10 meters above the shale layer and this layer permeability heterogeneity causes a low gas rise in the gas front. So, in order to gas penetrate into the low permeable zone, high amount of penetration exist in the contact between this layers and injection well and low penetration in the contact between high permeable layer and injection well. So, the CO2 injection rate is considered lowly. The same as other miscible gas EOR methods, CO2 can increase bubble point pressure due to the solubility of the gas in the oil. By this, the enriched oil moves towards the production well. Because of pressure depletion below the bubble point in the vicinity of the production well gas is liberated from oil and production gas oil ratio (GOR) increases. Gas injectivity is always an important factor through EOR operation that depends on rock and fluid properties, reservoir and injection pressure difference as well as injection rate. At the beginning of simulation, gas injectivity increases, while production GOR increment is low. Therefore, miscible CO2 injection in high volume is not afforded to maintain the reservoir pressure. Furthermore, methane mole fraction in produced gas decreases from 62% to 36% and heptane plus component mole fraction in produced oil decreased from 48% to 35% which is showing high CO2 mole percent in produced gas and oil. At last, noting that miscible CO2 injection recovery factor is obtained 48.74% till the end of simulation time.
These mentioned explanations are obvious in Figures 4-6.
Tertiary Recovery: Water-Alternating-Carbon Dioxide Injection (WAG)
In this process, the bulk of oil-carbon dioxide that has a good mobility (k/μ), is displaced by injected water. The mobility ratio which is created between injected fluid and reservoir oil assists to create a stable movement of the two fronts. Injection rate was applied as the main injection control agent, which the optimum rate of continuous carbon dioxide gas injection was used. The various ratio of water to gas injection including 1, 2 and 4 which are equivalent to water injection rates of 28.25 SCM/Day, 56.5 SCM/Day, and 113 SCM/Day respectively were simulated. By the way, water to gas injection ratio of 4 yields the highest recovery factor. While the gas injection rate is 12,000 SCM/Day for one year then water injection rate is 113 SCM/Day for one year and this will be repeated on a period for 5 cycles (10 years). Cycles more than 5, due to the thickness of the formation causes gas carry over in higher parts, while, cycles less than 5 contributes to high water cut in the wells. In the last thirty years simulation time, with water flooding will be continued with a constant flow rate of 113 SCM/Day.
 (a)
(a) (b)
(b)
Figure 4. (a) Injection well bottom hole pressure and carbon dioxide mole fraction in produced gas; (b) Total aquifer water volume into the oil zone and GOR vs. time under three miscible carbon dioxide injection scenarios.

Figure 5. Injection well bottom hole pressure, well injectivity, and production well gas oil ratio vs. time under optimum miscible carbon dioxide injection scenario.
 (a)
(a) (b)
(b)
Figure 6. (a) Gas production rate and carbon dioxide and methane mole fraction in produced gas; (b) Total gas production, heptane plus component mole fraction in produced oil and total well water cut vs. time under optimum miscible carbon dioxide injection scenario.
Moreover, the solution gas-oil ratio rise compared to the other alternating injections is minimal. Most remarkable point in the three intended scenarios is that water production rate in the last twenty years of the simulation is close to each other. In contrast, water cut in the early years of the simulation is not identical since water injection was carried out in the low permeable layers. Finally, the ratio of water to gas injection was selected as 4 for an optimum process. It is worth noting that, higher injection rates, limits the influence of aquifer rate invading into the oil zone, while, water injection pressure is high enough. In different scenarios of WAG, gas failures and GOR began to increase in periods occurred near the same time. The rate of GOR increment in different scenarios is very slow, for instance, in water to gas injection ratio of 4, GOR from 98.2 SCMg/SCMo reaches to 100.2 SCMg/SCMo.
By reducing reservoir pressure during production injection pressure will decrease. Water injection in comparison to gas injection decreases the aquifer rate into the oil zone, due to the fact that water has a higher pressure against the aquifer. In the first three cycles, aquifer rate into the oil zone increases in water injection as well as the gas injection, while, in the next cycles, aquifer rate into the oil zone decreases, however, this decline rate is so little. At last, recovery factor is obtained 46.74% till the end of simulation time which is the better result in comparison to miscible CO2 injection and it is because of less gas requirement.
These mentioned explanations are obvious in Figure 7 and Figure 8.
Tertiary Recovery: Simultaneous-Water-Gas Injection (SWAG)
In this process called SWAG water injection from high part and gas injection from the low part of the horizontal well is done. The main purpose of this method is pushing a high volume of reservoir oil by using of density property of the fluid is injected into the reservoir. To compare this scenario to other scenarios injection rate was selected as the half capacity of WAG (56.5 SCM/Day for oil and 6000 SCM/Day for gas). Injection water tends to move towards the bottom of the reservoir, and a movement in the vertical and horizontal directions (due to pressure drop in the productive layer), while gas is injected from the bottom tend to move upward movement in the direction of its injection. In the case of this particular reservoir which permeability changes in the different layers, in practice when water is injected into the reservoir due to low permeability to Z direction may move towards the bottom very poorly. If in these conditions don’t be produced from the upper layers, the pressure required to inject water is higher than the average reservoir pressure. While the aquifer rate into the oil reservoir in the area near the gas injection is better than water injection and pressure required to inject gas into the reservoir at a lower point is approximately 60 Bara

Figure 7. Effect on water to gas ratio on oil in place, GOR, and water production rate in WAG.
 (a)
(a) (b)
(b)
Figure 8. (a) Total water cut, carbon dioxide mole fraction in produced gas, and oil production rate; (b) Water injection rate, aquifer rate into the oil zone, and injection well bottom hole pressure in 5 cycles vs. time under WAG ratio 4 scenario.
lower than water injection. When injected gas reaches to the production well, aquifer water reaches and causes water coning which causes gas production rate. Gas production rate in this process is higher than the process of miscible CO2 injection at the end of simulation time. The main reason is high-pressure areas under water injection which injected gas stops carry over. SWAG recovery factor is obtained 48.84% till the end of simulation time which is the better result in comparison to WAG and miscible CO2 injection.
These mentioned explanations are obvious in Figure 9(a) and Figure 9(b).
Hybrid Injection
Hybrid processes could be a choice to combine different processes in order to examine innovative scenarios. Since the reservoir rock is oil-wet, gas injection at
 (a)
(a) (b)
(b)
Figure 9. (a) Water and gas injection well bottom hole pressure and aquifer rate into the oil zone; (b) Gas production rate and total water cut, and heptane plus component mole fraction in produced oil vs. time under SWAG scenario.
the first stage is capable of reducing the viscosity and surface tension and consequently increase the capillary number and reduction of residual oil saturation. At this stage, CO2 is injected at a rate of 12,000 SCM/Day for approximately 22 years, then WAG injection is started with the same gas and water injection rate. The combination of miscible CO2 and WAG injection as a hybrid process has a recovery factor of 48.27% till the end of simulation time which reveals a better result in comparison to WAG due to long time simulation of miscible gas injection.
These mentioned explanations are obvious in Figure 10(a) and Figure 10(b).
 (a)
(a) (b)
(b)
Figure 10. (a) Water injection rate, aquifer rate into the oil zone, and GOR; (b) Total water cut, carbon dioxide mole fraction in produced gas, and injection well bottom hole pressure vs. time under hybrid scenario (first miscible carbon dioxide injection then WAG injection).
Tertiary Recovery: Gas Recycling
Without a shadow of a doubt, burning associated gas produced from the oil reservoirs is a major problem in Iran’s oil industry, while, this is the sources of injection to reservoirs for EOR purpose. Gas recycling into the reservoir is vitally precious due to the presence of available and cheap injection source. The gas production rate of the intended reservoir is less than 2000 SCM/DAY in early time. Due to the fact that high percentage of produced gas is methane and ethane, the required pressure for injection of this volume of gas does not change the gas into the liquid. In addition, gas recycling does not impact on aquifer performance and oil production rate is higher than natural production as well. In the first twenty years, gas production rate decreases because of oil production rate as well as reservoir pressure drawdown. Then, gas injection rate starts to increase as gas front reaches to the production well as a consequence gas production rate increases. Produced gas composition is constant since methane mole fraction is constant, while, produced fluid composition is not constant because of increasing methane mole fraction and heptane plus reduction. Gas recycling recovery factor is obtained 46.261% till the end of simulation time which is better result in comparison to natural production, however, it is 2.1% less than miscible CO2 injection, while, does not associate with corrosion, gas-oil separation problem, and gas condensation in high-pressure injection in comparison to miscible CO2 injection.
The whole mentioned explanations are obvious in Figure 11 and Figure 12.
 (a)
(a) (b)
(b)
Figure 11. (a) Injection well bottom hole pressure, gas injection rate, and GOR; (b) Total well water cut, oil production rate, and aquifer rate into the oil zone of gas vs. time under gas recycling scenario.
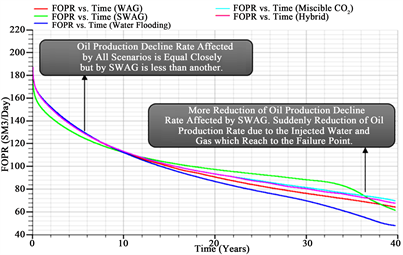
Simulated Processes Comparison
Some comparisons have been conducted between simulated processes and are shown as Figures 13-15.
Note that, selected conditions in different scenarios for injected fluids are as Table 5.

Figure 12. Methane mole fraction in produced gas and fluid and heptane plus mole fraction in produced fluid vs. time under gas recycling scenario.
 (a)
(a) (b)
(b)
Figure 13. Effect of different scenarios on the average reservoir pressure and the total water cut.
 (a)
(a) (b)
(b)
Figure 14. Effect of different scenarios on the oil and gas production rate.
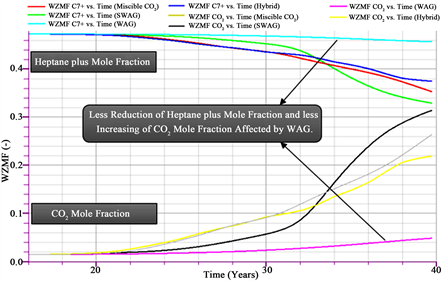
Figure 15. Effect of different scenarios on heptane plus and carbon dioxide mole fraction.
Table 5. Selected condition for injected fluids in different scenarios.
4. Conclusions
The studied reservoir has been divided into two parts by the shale layer which effects on the pressure and fluid communication between two parts. The required data regarding the two parts were assigned to obtain the accurate results through the simulation study.
There is a wide range of porosity and permeability in the reservoir, i.e. the reservoir has high heterogeneity. In addition, the fluids saturation and the oil-water contact vary in different regions which lead to an enormous uncertainty.
Consequently, horizontal well has a minor impact on the reservoir performance since the majority of layers have little permeability, while, deviated well can increase the productivity by creating high surfaces with formations.
Also, considering an injection rate equivalent to the produced gas can compensate the pressure drop by the aquifer that can enhance the recovery factor up to 10%.
Moreover, during the natural depletion from the reservoir, oil production is reduced due to the pressure decline. It is clear that, while the reservoir pressure is above the bubble point pressure, the solution GOR remains constant and the gas production rate is a function of the oil production rate.
In the cases which CO2 is utilized as an injectant, the increment of gas production is owing to the fact that the injected gas front reaches to the production well.
In WAG process, the water-gas injection ratios of 1, 2, and 4 were examined and the interesting point in the simulated results is that, the identical water flow rate at the end of each scenario. The water-gas ratio of 4 was selected as the most suitable case and its injection flow rate was taken from the optimum processes of water and carbon dioxide flooding.
Recovery of the defined hybrid process is more than WAG because of its longer duration of miscible gas injection. This method has relatively the higher water cut and the slower solution GOR growth in comparison with the carbon dioxide injection.
Based on the simulation results, it was seen that SWAG process has more efficiency than others and reduces the rate of the pressure decline. Even, in the bottom parts of the reservoir, if a shortage of gas injection is faced and the injection flow rate is cut off, the water influx creates a natural WAG.
Eventually, the recycling into the reservoir can increase recovery factor around 16% more than the natural depletion. It is worth noting that, the produced gas is injected into the lowest point of the injection well.
Acknowledgements
The acknowledgments are for the Shiraz University for supporting this research.
Cite this paper
Ejraei Bakyani, A., Namdarpoor, A., Sarvestani, A.N., Daili, A., Ganji, S.Y. and Esmaeilzadeh, F. (2018) A Simulation Approach for Screening of EOR Scenarios in Naturally Fractured Reservoirs. International Journal of Geosciences, 9, 19-43. https://doi.org/10.4236/ijg.2018.91002
References
- 1. Carcoana, A. (1992) Applied Enhanced Oil Recovery. Prentice Hall, Upper Saddle River.
- 2. Lindblom, G.P. and Ortfild, D.G. (1999) Enhanced Oil Recovery. Mc Grow Hill, New York.
- 3. Ahmed, T. (2010) Reservoir Engineering Handbook. 4th Edition, Gulf Professional Publishing, Houston.
- 4. Leena, K. (2008) Worldwide EOR Survey. Oil and Gas Journal, 106, 47-59.
- 5. Owen, N.A., Inderwildi, O.R. and King, D.A. (2010) The Status of Conventional World Oil Reserves-Hype or Cause for Concern. Energy Policy, 38, 4743-4749. https://doi.org/10.1016/j.enpol.2010.02.026
- 6. Green, D.W. and Willhite, G.P. (1998) Enhanced Oil Recovery. 3rd Edition, Society of Petroleum Engineers, The Woodlands.
- 7. Geffen, T.M. (1973) Improved Oil Recovery Could Help Ease Energy Shortage. World Oil, 177, 84-88.
- 8. Geffen, T.M. (1973) Oil Production to Expect from Known Technology. [Tertiary Recovery]. Oil Gas Journal, 71, 19.
- 9. Taber, J.J. (1983) Technical Screening Guides for the Enhanced Recovery of Oil. SPE Annual Technical Conference and Exhibition, San Francisco, 5-8 October 1983, SPE-12069-MS. https://doi.org/10.2118/12069-MS
- 10. Taber, J.J., Martin, F. and Seright, R. (1997) EOR Screening Criteria Revisited—Part 1: Introduction to Screening Criteria and Enhanced Recovery Field Projects. SPE Reservoir Engineering, 12, 189-198. https://doi.org/10.2118/35385-PA
- 11. Taber, J.J., Martin, F. and Seright, R. (1997) EOR Screening Criteria Revisited—Part 2: Applications and Impact of Oil Prices. SPE Reservoir Engineering, 12, 199-206. https://doi.org/10.2118/39234-PA
- 12. Vladimir, A. and Eduardo, M. (2010) Enhanced Oil Recovery: Field Planning and Development Strategies. Gulf Professional Publishing, Burlington.
- 13. Dudley, B. (2015) BP Statistical Review of World Energy. British Petroleum. https://www.bp.com/content/dam/bp/pdf/energy-economics/statistical-review-2015/bp-statistical-review-of-world-energy-2015-full-report.pdf
- 14. Saidi, A.M. (1996) Twenty Years of Gas Injection History into Well-Fractured Haft Kel Field (Iran). International Petroleum Conference and Exhibition of Mexico, Villahernosa, 5-7 March 1996, 123-133. https://doi.org/10.2118/35309-MS
- 15. Alavian, S.A. and Whitson, C.H. (2010) CO2 EOR Potential in Naturally-Fractured Haft Kel Field, Iran. SPE Reservoir Evaluation & Engineering, 13, 720-729. https://doi.org/10.2118/139528-PA
- 16. Lin, E.C. and Poole, E.S. (1991) Numerical Evaluation of Single-Slug, WAG, and Hybrid CO2 Injection Processes, Dollarhide Devonian Unit, Andrews County, Texas. SPE Reservoir Engineering, 6, 415-420. https://doi.org/10.2118/20098-PA
- 17. Roper Jr, M.K., Cheng, C.T., Varnon, J.E., Pope, G.A. and Sepehrnoori, K. (1992) Interpretation of a CO2 WAG Injectivity Test in the San Andres Formation using a Compositional Simulator. SPE/DOE Enhanced Oil Recovery Symposium, Tulsa, 22-24 April 1992, SPE-24163-MS. https://doi.org/10.2118/24163-MS
- 18. Tehrani, D.H., Sohrabi, M., Henderson, G.D. and Danesh, A. (1999) Water Alternating Gas (WAG) Injection Micromodel Studies. In: Improved Oil Recovery Research Dissemination Seminar, The UK Department of Trade and Industry, London, Vol. 18.
- 19. Sohrabi, M., Henderson, G.D., Tehrani, D.H. and Danesh, A. (2000) Visualization of Oil Recovery by Water Alternating Gas (WAG) Injection using High-Pressure Micromodels-Water-Wet System. SPE Annual Technical Conference and Exhibition, Dallas, 1-4 October 2000, SPE Paper 63000. https://doi.org/10.2118/63000-MS
- 20. Sohrabi, M., Tehrani, D.H., Danesh, A. and Henderson, G.D. (2001) Visualization of Oil Recovery by Water Alternating Gas (WAG) Injection using High-Pressure Micromodels-Oil-Wet & Mixed-Wet Systems. SPE Annual Technical Conference and Exhibition, New Orleans, 30 September-3 October 2001, 1429-1435. https://doi.org/10.2118/71494-MS
- 21. Sohrabi, M., Tehrani, D.H., Danesh, A. and Henderson, G.D. (2004) Visualization of Oil Recovery by Water-Alternating-Gas Injection using High-Pressure Micromodels. SPE Journal, 9, 290-301. https://doi.org/10.2118/89000-PA
- 22. Sohrabi, M., Danesh, A. and Jamiolahmady, M. (2008) Visualization of Residual Oil Recovery by Near-Miscible Gas and SWAG Injection using High-Pressure Micromodels. Transport in Porous Media, 74, 239-257. https://doi.org/10.1007/s11242-007-9193-5
- 23. Negahban, S., Joshi, N., Jamaluddin, A.K.M. and Nighswander, J. (2003) A Systematic Approach for the Experimental Study of Asphaltene Deposition for an Abu Dhabi Reservoir under WAG Development Plan. International Symposium on Oilfield Chemistry, Houston, 5-7 February 2003, SPE-80261-MS. https://doi.org/10.2118/80261-MS
- 24. Gharbi, R.B. (2003) Integrated Reservoir Simulation Studies to Optimize Recovery from a Carbonate Reservoir. SPE Asia Pacific Oil and Gas Conference and Exhibition, Jakarta, 15-17 April 2003, SPE-80437-MS. https://doi.org/10.2118/80437-MS
- 25. Guo, X., Du, Z., Sun, L., Huang, W. and Zhang, C. (2006) Optimization of the Tertiary Water-Alternate-CO2 Flood in Jilin Oil Field of China: Laboratory and Simulation Studies. SPE/DOE Symposium on Improved Oil Recovery, Tulsa, 22-26 April 2006, SPE-99616-MS. https://doi.org/10.2118/99616-MS
- 26. Ghomian, Y., Pope, G.A. and Sepehrnoori, K. (2008) Hysteresis and Field-Scale Optimization of WAG Injection for Coupled CO2-EOR and Sequestration. SPE Symposium on Improved Oil Recovery, Tulsa, 20-23 April 2008, SPE-110639-MS. https://doi.org/10.2118/110639-MS
- 27. Novosel, D. (2009) Thermodynamic Criteria and Final Results of WAG CO2 Injection in a Pilot Project in Croatia. SPE Middle East Oil and Gas Show and Conference, Manama, 15-18 March 2009, SPE-119747-MS. https://doi.org/10.2118/119747-MS
- 28. Ejraei Bakyani, A., Sahebi, H., Ghiasi, M.M., Mirjordavi, N., Esmaeilzadeh, F., Lee, M. and Bahadori, A. (2016) Prediction of CO2-Oil Molecular Diffusion Using Adaptive Neuro-Fuzzy Inference System and Particle Swarm Optimization Technique. Fuel, 181, 178-187.