International Journal of Geosciences
Vol. 3 No. 4A (2012) , Article ID: 23206 , 13 pages DOI:10.4236/ijg.2012.324082
Evaluation of Long-Period Detectability of Teleseismic Events at Syowa Station, Antarctica
1National Institute of Polar Research, Research Organization of Information and Systems, Tokyo, Japan
2International Seismological Centre, Thatcham, Berkshire, UK
Email: *kanao@nipr.ac.jp, dmitry@isc.ac.uk, ben@isc.ac.uk
Received July 30, 2012; revised August 30, 2012; accepted September 8, 2012
Keywords: Teleseismic Events; Detectability; Syowa Station; Antarctica; Global Network
ABSTRACT
Phase identification procedures for teleseismic events at Syowa Station (69.0˚S, 39.6˚E; SYO), East Antarctica have been carried out since 1967 after the International Geophysical Year (IGY; 1957-1958). Since the development of INTELSAT telecommunication link, digital waveform data have been transmitted to the National Institute of Polar Research (NIPR) for the utilization of phase identification. Arrival times of teleseismic phases, P, PKP, PP, S, SKS have been detected manually and reported to the International Seismological Centre (ISC), and published by “JARE Data Reports” from NIPR. In this paper, hypocentral distribution and time variations for detected earthquakes are demonstrated over the last four decades in 1967-2010. Characteristics of detected events, magnitude dependency, spatial distributions, seasonal variations, together with classification by focal depth are investigated. Besides the natural increase in the occurrence of teleseismic events on the globe, a technical advance in the observing system and station infrastructure, as well as the improvement of procedures for reading seismic phases, could all combine to produce the increase in detection of events in last few decades. Variations in teleseismic detectability for longer terms may be possible by association with the meteorological environment and sea-ice spreading area around the Antarctic continent. Recorded teleseismic and local seismic signals have sufficient quality for many analyses on dynamics and structure of the Earth as viewed from Antarctica. The continuously recorded data are applied not only to lithospheric studies but also to the Earth’s deep interiors, as a significant contribution to the Federation of Digital Seismological Networks (FDSN) from high southern latitude.
1. Introduction
In order to contribute to the global seismic network, teleseismic phase identification at Syowa Station in Antarctica (69.0˚S, 39.6˚E; SYO; Figure 1) has been carried out since 1967 [1] after the International Geophysical Year (IGY). By using continuous records of shortand long-period seismographs, teleseismic phase identification work continued until 2005 mainly by wintering members of the geophysics section in the Japanese Antarctic Research Expedition (JARE).
After returning the data to Japan by the ice-breaker ship, the identified teleseismic events were accurately rescaled at the National Institute of Polar Research (NIPR). Internet connection between SYO and outside Antarctica significantly improved after the INTELSAT telecommunication system was established [2] in 2004. Since then the teleseismic phase identification procedure has been conducted only at NIPR by an expert staff of Polar Data Center (PDC) in NIPR.
All information on arrival times of the detected phases has been reported to the International Seismological Centre (ISC) and the United States Geological Survey (USGS), and published as the “JARE Data Reports (Seismology)” for every year [3-5]. By using both the travel-times and waveforms of detected teleseismic events at SYO (Figure 2), a number of remarkable studies have been conducted; heterogeneous structure and dynamics of the Antarctic continent [6-8], the surrounding oceanic plate [9, 10], local and regional seismic activities [11-13], structure and dynamics of the Earth’s deep interiors [14-18].
In this paper, variations in teleseismic detection characteristics for two decades are presented on the basis of a recent report [19]. Moreover, significant information on detected teleseismic events, such as spatial distributions, long-term temporal variations after IGY and magnitude dependency are demonstrated in comparison with global data compiled at ISC. Statistics of travel-times reported to ISC are also demonstrated for SYO and other Antarctic stations belonging to the global network for comparison.
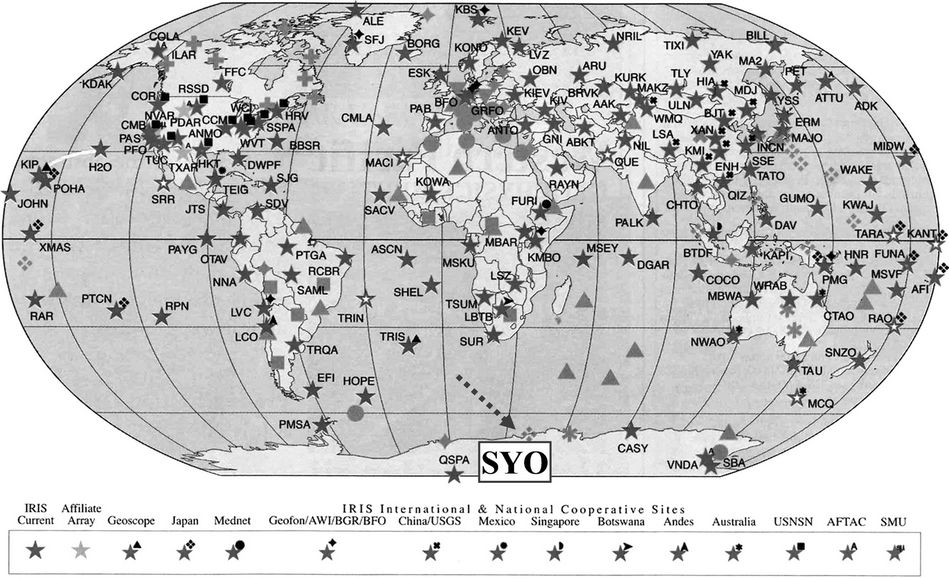
Figure 1. Global map showing the Federation of Digital Seismological Networks (FDSN) (modified after Butler and Anderson, 2008). Several regional networks developed by involved nations are indicated; e.g., IRIS, Geoscope, Geophone, Japan, etc. Syowa Station (SYO) in East Antarctica is pointed out by red broken arrow.
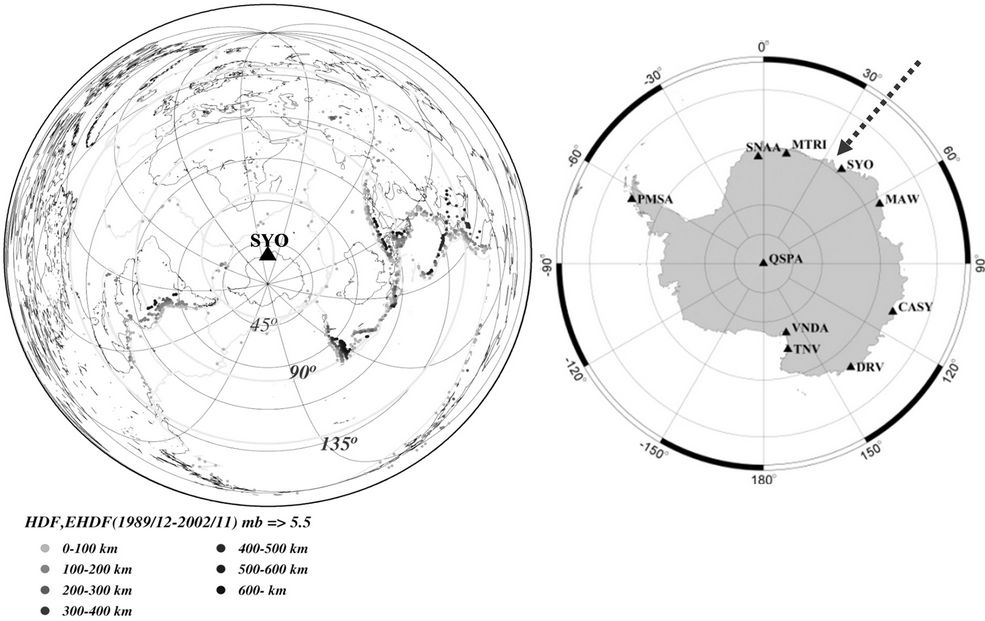
Figure 2. (Left) Global maps of hypocenters in different depth range, with its center at SYO, Antarctica. (Right) Distribution of FDSN stations in Antarctica, including SYO (by red broken arrow).
2. Observation Systems
The current working observation system at SYO was started in 1997 [4]. A block diagram of the observation system is illustrated in Figure 3(a). Details of the historical transition in seismic observation system for last two decades are referred to [2,20,21]. Recently published Data Reports, moreover, describe minor changes in the system. In this section, we briefly introduce the observation systems.
Seismic observations at SYO have been carried out by
 (a)
(a)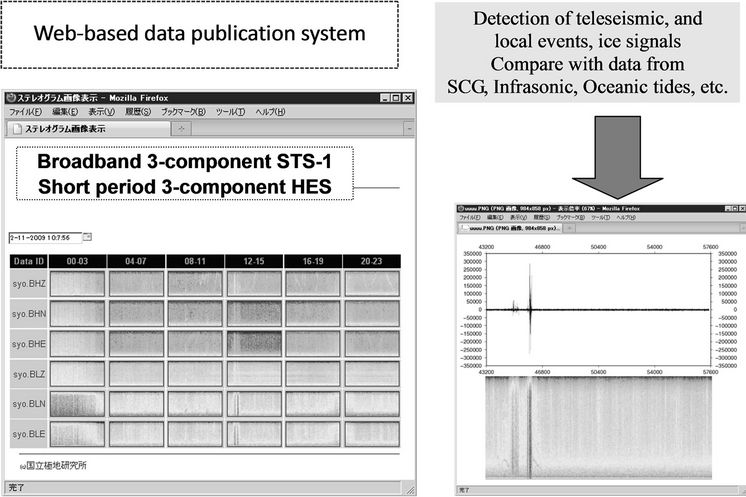 (b)
(b)
Figure 3. (a) Block diagram of a recording system for the broadband (STS-1) and the short-period (HES) seismographs at SYO. (Left) Seismographic room, (Right) Earth Science Laboratory; (b) Illustration of the continuous monitoring system for seismic waves and spectrum recorded at SYO. Both the data of three-component broadband (STS-1) and short-period (HES) seismographs are available on the web. Several kinds of signals for teleseismic and local tectonic events, as well as the ice-related signals are recordable.
two types of seismographs. One is a short-period seismograph (HES; [22]) with 1.0 Hz eigenfrequency of pendulum used since 1967 [23]. The other is a three-component broadband seismograph (Streckeisen STS-1; [24]) with a digital recording system used since 1990 [25]. The seismic hut was re-constructed in 1996 and all sensors were moved inside it in 1997 (69˚00'24.0"S, 39˚35'06.0"E and elevation 20 m above mean sea level). Seismic signals of HES and STS-1 are transmitted to the Earth Science Laboratory (ESL) via analogue cables 600 m in length.
Three-component analogue outputs by HES is digitized at 200 Hz sampling by a 24-bit A/D converter, generating triggered signals of 80 and 1 Hz re-sampled and 20 Hz continuous outputs. Signals of a three-component STS-1 are also digitized to produce triggered output of 80 Hz and continuous outputs of 20, 1, 0.1 and 0.01 Hz, respectively. All waveform data are formatted to a Mini_ SEED volume, as a standard format in global seismology. Digital data have been transmitted via INMARSAT telecommunication link from SYO to NIPR since 1993. The data transmission was greatly improved by using the INTELSAT link since 2004. During a whole season, continuous data of both the sensors with 20 Hz sampling have been automatically transmitted via UUCP protocol from acquisition workstation to NIPR server.
A web-based monitoring system for waveform data was developed in 2012 (Figure 3(b)). The three-component data for both STS-1 and HES are available. In addition to teleseismic events, characteristic local events are identified; those may be associated with cryoseismic environmental changes near the stations (Figure 4). Figure 5 presents original waveforms and corresponding Power Spectral Densities (PSDs) of the vertical component of STS-1V, for two significantly disastrous teleseismic events (NE Japan Eq., M 9.0, March 11, 2011; Christchurch Eq., M 6.3, February 22, 2011).
3. Identifying Teleseismic Events
The detailed procedure for conducting phase identification of the teleseismic events is as follows. The initial phases of individual targeted events are carefully pickedup on analog or digital records mainly by the vertical component of HES. Earthquake events corresponding to these scaled phases are identified by comparing the estimated arrival-times calculated by the IASPEI-91 global Earth velocity model [26] with the observed (scaled) arrival-times. Hypocentral information including origin times are referred to the Preliminary Determination of Epicenters (PDE) or the Quick Earthquake Determination (QED), offered by the National Earthquake Information Center (NEIC) of USGS.
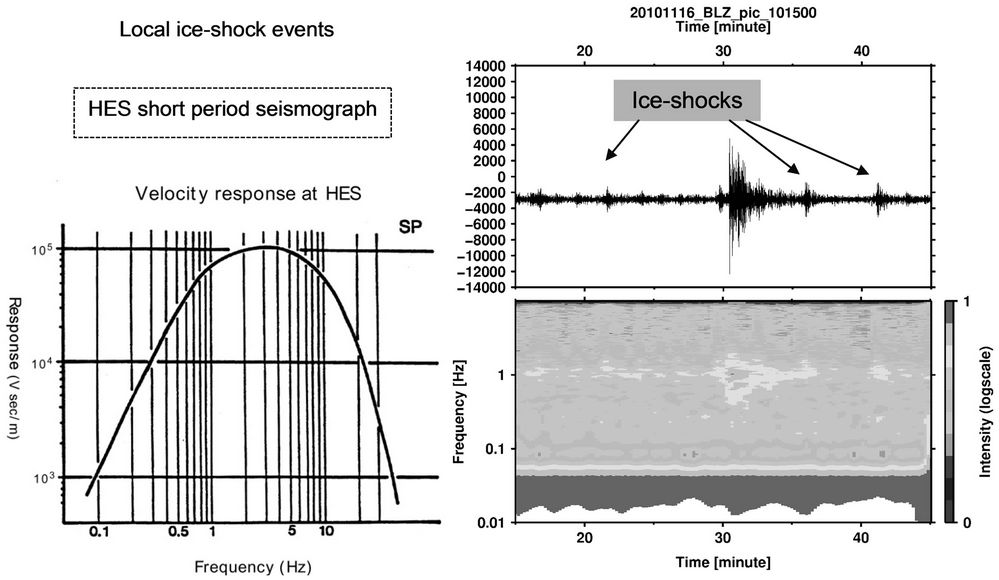
Figure 4. (Right) Power spectral densities (PSD) of the short-period seismograph (HES, vertical component) at SYO on November 16, 2010. Several ice-shock signals are identified on the seismogram. (Left) Frequency responses of the HES seismographs (modified after Hagiwara, 1958).
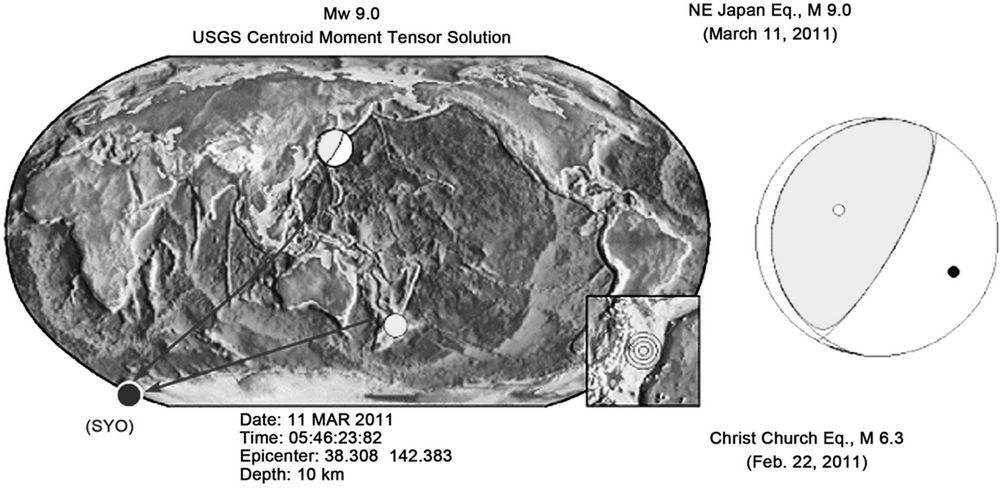
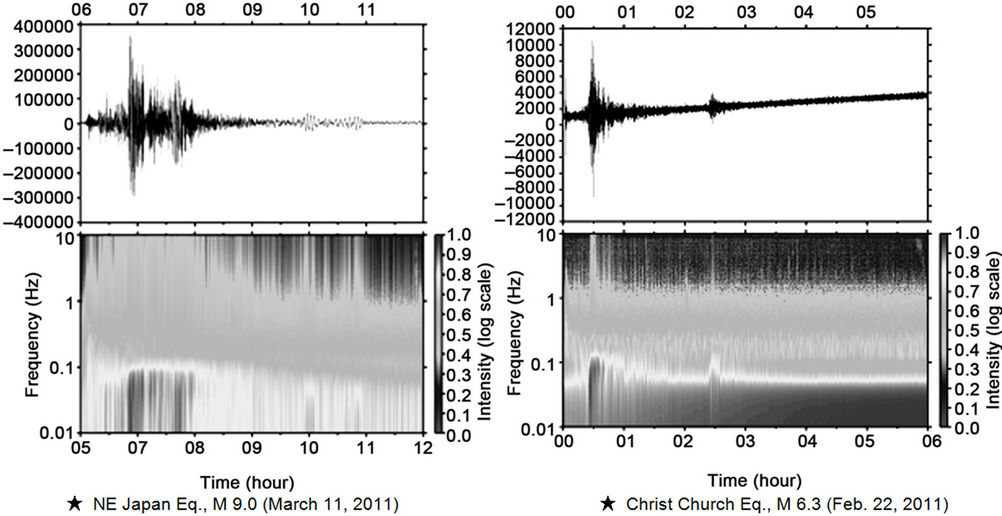
Figure 5. Original waveforms and their PSDs for the vertical component of broadband seismograph (STS-1V) at SYO, for two remarkable teleseismic events. (Left) NE Japan Eq., M 9.0 (March 11, 2011; delta = 130, 6 hours data). (Right) Christchurch Eq., M 6.3 (Feb. 22, 2011; delta = 62, 6 hours data).
Onsets of seismic phases are carefully selected within the discrepancy limit of 3.0 s by comparing the calculated travel-times from the IASPEI-91 model with the observed ones. The arrival times of initial phases as well as several other predominant phases such as PKP, PP, S, and SKS are distinguished; a degree of detection on later phases depends on the noise level of records. st seismic phases are scaled on a vertical-compone seismogram; however, several clear phases are determined on horizontal components. The time accuracy of arrival times is estimated to be ±0.2 s, caused by human scaling and clock errors in the phase identification procedure.
The number of detected teleseismic events in 1987- 2007 ranges of 400 - 1700 for every year, with a total of 19,145. The annually averaged number is more than 900 for the 21-year period. The number of teleseismic events for plotting hypocentral parameters in figures is limited to 19,039, because body-wave magnitude (Mb) could not be determined for 196 events. The hypocentalistribution in 1987-2007 is shown in Figure 6. A small number of local earthquakes with magnitude smaller than 3.0 were observed, with their hypocenters distributed around the Lützow-Holm Bay [11], where the SYO is located. In this paper, however, we did not study these local events in detail, instead we summarize the characteristics of relatively large hypocentral distance events which are reported to ISC.
4. Spatial and Time Distribution of Hypocenters
In this section, spatial and time distribution of hypocenters for teleseismic events are investigated with regard to various hypocentral distances and focal depths. In order to check the dependence of hypocenters on focal depths, the hypocentral distribution is classified into three different depth groups. Figure 7 presents hypocentral distribution for the events with focal depths shallower than 50 km (a), with depths ranging from 50 km to 300 km (b), and with depths greater than 300 km (c), respectively. Earthquakes deeper than 300 km in focal depth are distributed mainly in the azimuthual range in 70˚ - 90˚ (Indonesia region), 130˚ - 150˚ (Tonga and Fiji Island regions) and around 250˚ (South America).
A relationship between hypocentral distance and Mb for 19,039 events in 1987-2007 is shown in the upper part of Figure 8. The detectable magnitude threshold has minimum values of about 3.5 from 60˚ to 90˚, where 80 per cent of the events occurred. On the other hand, the detectable number rapidly decreases particularly at Mb of 5.0, in the shadow zone distance range from 103˚ to 143˚. A relationship between hypocentral distance and focal depth represents a maximum number of events at distances from 65˚ to 95˚. Since hypocentral distances from 103˚ to 143˚ are in the shadow zone for seismic bodywaves, relatively few initial phases can be identified. At distances over 140˚, PKP phases are principally observed initially as arrival phases. Teleseismic earthquakes with a distance range of more than 150˚ are located in the areas of high northern latitude such as Alaska, Aleutian Islands, Kamchatka Peninsula and Svalbard Islands.
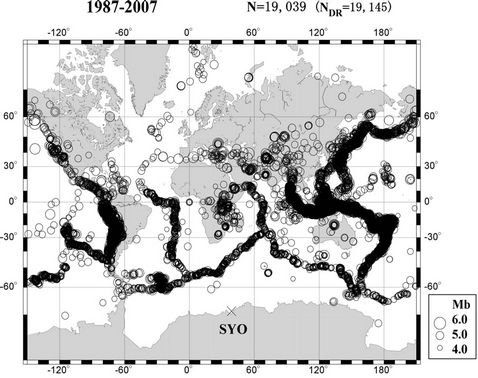
Figure 6. Epicentral distribution of the teleseismic events detected at SYO in 1987-2007 (modified after Kanao, 2010). Size of the epicentral circle is proportional to the body-wave magnitude (Mb) determined by USGS. The total number of events (NDR) reported in the published as JARE Data Reports is up to 19,145. The actual number of teleseismic events plotted on the map is 19,039, because of the existence of undetermined Mb for 196 events. Teleseismic events of Mb > 4 are detectable in the southern hemisphere; in contrast, events of Mb > 5 are detectable in northern hemisphere.
 (a) (b) (c)
Figure 7. Hypocentral distribution in 1987-2007 by the Equi-azimuthal and Equi-distant projection of its center at SYO (modified after Kanao, 2010). Size of the epicentral circle is proportional to the body-wave magnitude (Mb) determined by USGS. (a) Events with depths shallower than 50 km (N = 11,092); (b) Events with depths ranging from 50 km to 300 km (N = 5748); (c) Events with depths greater than 300 km (N = 2199).
The lower panel of Figure 8 represents time variations of Mb in 1987-2007. The detectable magnitude range varies from 6.5 to 7.0 maximum, to 4.0 to 4.5 minimum. Time variations with period longer than one year are not so clearly identified, possibly because the earthquake detection level has not drastically changed throughout the observation period. When focused on seasonal variations, austral summers have less teleseismic detectability than winters, because of the high noise level in summer due to both natural environmental factors and human activity in the vicinity of the station. The minimum threshold for detectable magnitude also has a few years of variation ranging from 4.0 to 5.0, which suggests the existence of a relationship between detection capability and other natural parameters (e.g., meteorology, sea-ice spreading area [27], and other geophysical environmental parameters). More detailed studies on the correlation between the variations in Mb and those in environmental parameters are to be conducted in the future.
5. Magnitude Dependency
In this section, magnitude dependency against focal depths is investigated. For different focal depth groups, a cumulative number of detected events in 1987-2007 against Mb are illustrated in the left panel of Figure 9. The number of events in each depth group is marked with an increment of 0.1 Mb. Among the teleseismic events detected at SYO, 58 percent are “shallow” events with focal depths smaller than 50 km (N = 11,156). In contrast, the “intermediate (50 km < depths ≤ 300 km)” and the “deep (depths larger than 300 km)” events occupy 30 percent (N = 5776) and 12 percent (N = 2204), respectively.

Figure 8. (Upper) A relationship between hypocentral distance (deg) and body-wave magnitude (Mb) for the total 19,039 events in 1987-2007. The detectable magnitude threshold has minimum values about 3.5, corresponding to the location of the maximum number of events in the hypocentral distance in 60˚ - 90˚. The shadow zone with hypocentral distance in 103˚ - 143˚ is indicated. (Lower) Time variation of the body-wave magnitude (Mb) in 1987-2007. A minimum threshold for the detectable magnitude appears to have a seasonal variation ranging in 4.0 - 5.0. These figures are modified after Kanao (2010).
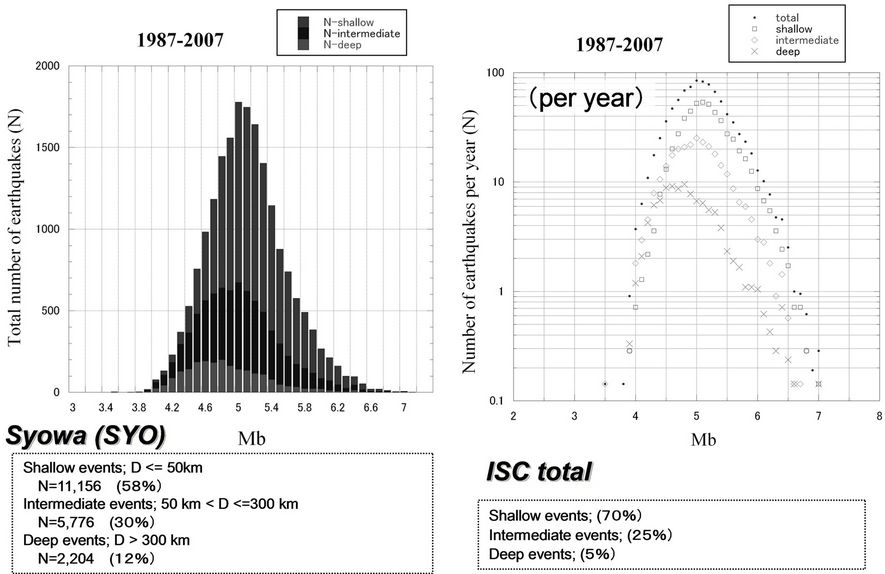
Figure 9. (Left) Total cumulative number of detected teleseismic events (N) in 1987-2007 against Mb. The number of events in each group is marked with an increment of 0.1 Mb (black columns; shallow events of focal depth shallower than 50 km, hatched columns; intermediate events of focal depth from 50 km to 300 km, white columns; deep events of focal depth larger than 300 km). (Right) Annual mean number of detected teleseismic events (N) in 1987-2007 against Mb. The number of events in each group is marked with an increment of 0.1 Mb (solid circle, total 19,039 events; open square, shallow events of focal depth shallower than 50 km; open diamond, intermediate events of focal depth from 50 km to 300 km; cross, deep events of focal depth larger than 300 km). These figures are modified after Kanao (2010). (Lower) Comparison of the ratio in each depth groups for shallow, intermediate and deep events both for SYO and ISC data.
A ratio of depth groups derived from the global data reported to ISC [28] indicates that “shallow” events occupy 70 percent, “intermediate” events 25 percent, and “deep” events have 5 percent, respectively. This implies the depth’s grouping ratio at SYO is relatively high for “deep” events compared with the global average. Moreover, the total of events reported to USGS/NEIC are 350,838 “shallow events”, 95,122 “intermediate events” and 14,982 “deep events”; which give detection ratios at SYO of 3.2 percent, 6.0 percent and 14.7 percent.
The maximum number of detected events at SYO are located around Mb = 5.0 for three depth groups, “shallow”, “intermediate” and “total”. On the contrary, the maximum number of events occurred around Mb = 4.6 in the “deep” depth group. This is because the peak position in detected numbers occurs at relatively smaller Mb in the “deep” depth group, as compared with the other groups. It means that the detection capability for “deep” group is better at SYO for the magnitude range of Mb ~ 4.0. The relatively high rate of 12 per cent for “deep” events at SYO compared with the global average also indicates the detection capability for “deep” group is high.
In order to discuss the annual mean detection capability, the averaged values per year are calculated for all events in 1987-2007 (right of Figure 9). The peak number of events against magnitude occurred around 5.0 - 5.1 for three depth groups except for “deep” group. The “deep” group takes peak annual mean values at smaller magnitude at 4.5 - 4.8. The maximum values for the annual mean for the “total” group (an example of maximum number group) and the “deep” group (an example of minimum number group) are 85 and 10.
6. Statistics of Arrival-Times
In this section, statistics of the travel-times reported to ISC for longer period in 1967-2010 are presented. These data contain all the periods since reporting to ISC began, after the IGY era. Time variations in last few decades are identified in the number of travel-time residuals from the picked events. Statistics for the arrival-time picks of teleseismic events reported to ISC in 1962-2010 are shown in Figure 10. The number of arrival-times by hypocentral distance (upper panel of Figure 10) represents a similar characteristic with Figure 8, having the maximum number of events in the distance range between 60˚ and 90˚.
Secondly, the number of arrival-time picks per month in 1967-2010 are shown in the lower panel of Figure 10. Accordingly with the progress in last few decades, the number of events reported to ISC have been successfully increased, with a significant advance in the numbers in last decade. In particular, after introducing the INTELSAT telecommunication link in 2004, the detected teleseismic events have held the maximum number of reporting phases. Along with the natural increase in the occurrence of the teleseismic events within global seismicity, an advance in the station infrastructure and the improvement of procedure for reading seismic phases at SYO could also contribute to the increase in numbers for the last decade.
Time variations in travel-time residuals and reported numbers of P-waves at SYO in 1967-2010 (totally 18,021 observations) are shown in Figure 11. On the graph, each dot represents the median residual for one month of data. The green line is the overall median; the orange line shows the standard deviation based on the median absolute deviation, whilst the red line shows twice the standard deviation. Slight variations with time have been identified in travel-time residuals within +/–1 second. The reported number of P-waves (lower panel) represents a similar result with Figure 10. The time variations in travel-time residuals and reported numbers for S-waves at SYO in the same period in 1967-2010 (in total 316 observations) are presented in Figure 12. The accumulated number is not enough for detailed discussion of S-waves, however, the increase in number of reported events in the last two decades is identical.


Figure 10. Statistics of the arrival-time picks for teleseismic events reported from SYO to ISC. (Upper) Number of arrival-time by hypocentral distance. The picks are based on the event distance by two degree bins. (Lower) Number of arrival-time picks per month in 1967-2010.
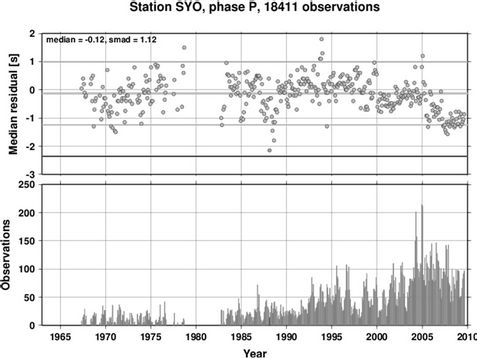
Figure 11. (Upper) Time variations in travel-time residuals for P-waves at SYO (in totally 18,021 observations). Each dot represents the median residual for one month of data. The green line is the overall median; the orange line shows the standard deviation based on the median absolute deviation, whilst the red line shows twice the standard deviation. (Lower) Reported number of teleseismic events at SYO in 1967-2010 to ISC.

Figure 12. (Upper) Time variations in travel-time residuals for S-waves at SYO (in totall 316 observations). Each dot represents the median residual for one month of data. The green line is the overall median; the orange line shows the standard deviation based on the median absolute deviation, whilst the red line shows twice the standard deviation. (Lower) Reported number of teleseismic events at SYO in 1967-2010 to ISC.
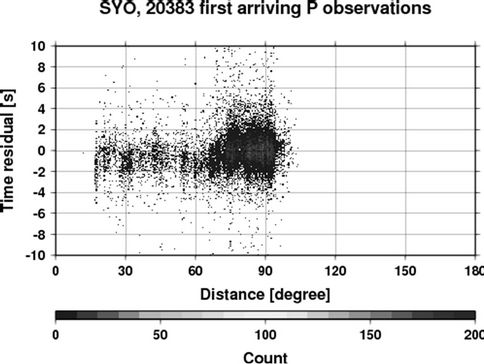
Arrival-time residuals for P-waves at SYO against hypocentral distance are represented in Figure 13(a). There is a variation in the residuals within a few seconds over all the hypocentral distances. On the basis of the distribution map of the arrival-times for first P-waves at SYO (Figure 13(b)), arrival-time residuals are presumably caused by the specific seismic-high areas, such as the subduction zones around West Pacific Ocean and West Coast of South America. A difference in their focal depths could be the most explicable reason for the residual distribution.
In order to compare the other FDSN stations in Antarctica, time variations in travel-time residuals and reported numbers for P-waves at Mawson Station for the same period in 1963-2010 (MAW; totally 57,163 observations) are shown in Figure 14. The general tendency of time variations reported to ISC appears to be the same as in Figure 11. The travel-time residuals for P-waves have a range within +/–0.5 seconds, which is almost half degree as compared with those at SYO by the upper panel in Figure 11. The reported numbers of teleseismic events demonstrate a quite similar time-trend in last half century after IGY to those at SYO (lower panel of Figure 11). Both the time variations in global seismicity, together with the advance in observation infrastructure at MAW, could be the chief reasons for an increase in the number of reported events in last few decades.
 (a)
(a)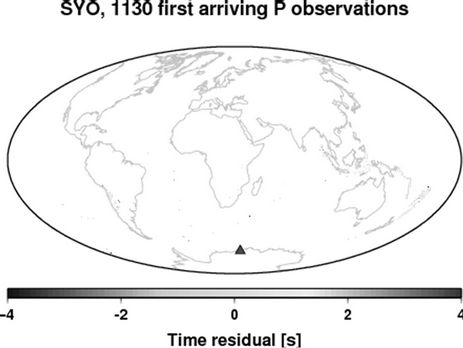 (b)
(b)
Figure 13. (a) Arrival-time residuals for P-waves against hypocentral distance at SYO; (b) Arrival-time residual map for the first arriving P-waves at SYO, based on the event azimuth and distance. The residuals are binned in a 1 × 1 degree grid.
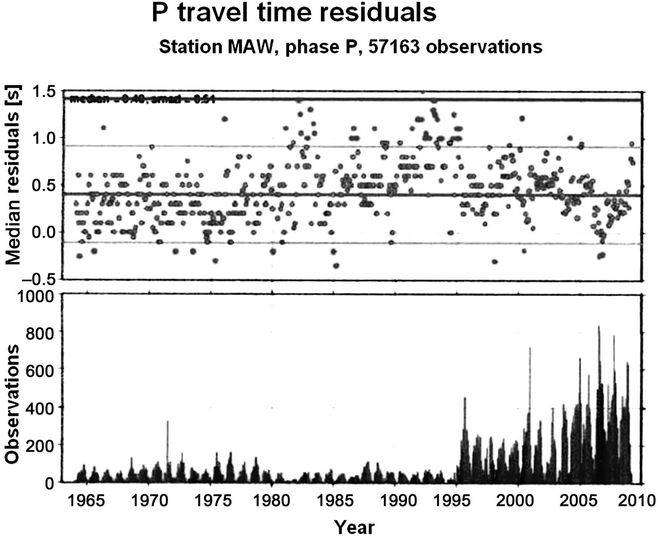
Figure 14. (Upper) Time variations in travel-time residuals for P-waves at MAW (in totally 57,163 observations). Each dot represents the median residual for one month of data. The green line is the overall median; the orange line shows the standard deviation based on the median absolute deviation, whilst the red line shows twice the standard deviation. (Lower) Reported number of teleseismic events at MAW in 1963-2010 to ISC.
7. Discussion
Though Antarctica was known as aseismic around the IGY era, several large earthquakes occurred both on the continent and in the surrounding oceans [29]. In spite of the permanent stations in Antarctica having been in operation as a part of global networks such as FDSN since 1980s, no detailed investigations for mapping local events had been carried out until recently [30,31]. Around SYO, for instance, about 20 local earthquakes with magnitude smaller than 3.0 was detected by regional array stations in the Lützow-Holm Bay [11,32].
In addition, several kinds of characteristic seismic signals have been recorded, particularly involving ice-related phenomena. These events are so-called “ice-quakes” for smaller ones and “glacial earthquakes” for larger ones. These events are very frequently generated by glacially related mass movements of ice-sheets, sea-ice, tidecracks and icebergs [33-36]. In spite of the development of local seismic networks in last two decades in several regions of Antarctica it is rather difficult to distinguish between the waveforms generated by tectonic earthquakes and ice-related phenomena [37,38].
The detection capability of teleseismic events at SYO was first investigated in 1960s at the early stage of JARE [1,39]. The winter season had higher detection capability, about 5 percent, than the summer season, which indicates the same pattern in seasonal variations reported by this study. Subsequently, teleseismic detectability in 1987- 1993 was investigated [40]. The main features in spatial distribution of hypocenters and focal depths represent almost the same signature as done by this study. A longer period for two decades in 1987-2007 was achieved [19], and the results are introduced in this report. Time variations in hypocentral parameters, the focal depths and the body-wave magnitude have several years of variations, as discussed in previously.
The Amundsen-Scott South Pole Station (QSPA), for instance, has the highest detection capability among Antarctic stations. QSPA is located at the center of Antarctic continent, the most remote seismic station from the ocean. Its seismic noise amplitudes caused by oceanic-loading are smaller than at stations along the continental margin. Continuous winter observations at QSPA may contribute to global science communities, such as natural earthquakes, tsunamis and the Comprehensive Nuclear Test-Ban Treaty Organization (CTBTO) [41]. Although there are several broadband seismic stations in southern hemisphere that belong to FDSN, such as GEOSCOPE [42] and PACIFIC21 [43], the detection capability of regional and local earthquakes could be improved by increasing the number of stations, particularly on the Antarctic continent and its surrounding oceans.
The global detection capability of teleseismic events was evaluated using ISC data, reported from 115 regional networks globally distributed from 1971 to 1980 [28]. The magnitude threshold of earthquake detection increases gradually with increasing southern latitude. The bias problem of network magnitude determination is significant at small and intermediate magnitudes, particularly at southern high latitude around Antarctica. The 90 percent incremental body-wave magnitude threshold was demonstrated in ranges from 4.2 to 4.8 in the southern hemisphere. It is also suggested the existence of undetected earthquakes in the ISC Bulletin in the southern hemisphere by critically checking the GEOSCOPE data [44].
Several kinds of archived data (arrival-times, hypocenters, waveforms both in analogue and digital, and related documents, and reports) from observations at SYO are available from the data library of NIPR (POLARIS, http://polaris.isc.nipr.ac.jp/~pseis/syowa). Archived data that have passed two years since the observation period are stored and freely available from both NIPR ftp site and from PACIFIC21 data center of the Japan Marine Science and Technology Agency. Then the waveform data are offered to world seismology data centers, such as Incorporated Research Institute of Seismology/Data Management System (IRIS/DMS).
8. Conclusion
Teleseismic phase identifying procedure at SYO, Antarctica have been carried out since 1967. Arrival times of teleseismic phases have been reported to ISC, and published as JARE Data Reports. The teleseismic events reported to ISC for more than forty years are presented by their spatial and time variations in detection capability. Recent data listed in JARE Data Reports in 1987-2007 are compared in terms of magnitude dependency, spatial distributions, seasonal variations, together with classification by focal depth. Variations in teleseismic detection capability over longer observation terms (seasonal change and a few years of drift) have a possibility to be associated with environmental data such as weather, sea-ice spreading area, and other geophysical parameters. Statistics of the travel-time data reported to ISC represent the similar time trending both for SYO and MAW, as well as the other stations in Antarctica. A significant increase in the number of travel-time residuals for the picked events with time during the last four decades are clearly identified. The obtained teleseismic data in the Antarctic can be applied not only to lithospheric studies but also to Earth’s deep interiors, as one of the important contributions to the global network.
9. Acknowledgements
The authors express their sincere thankfulness to Ms. A. Ibaraki of PDC of NIPR, for her great efforts in re-scal ing the SYO data in last two decades. The authors also appreciate to Profs. K. Kaminuma, K. Shibuya, K. Doi, Y. Nogi and Y. Aoyama of NIPR for their valuable advice and discussions for manuscript. The authors would express their sincere appreciation to Dr. M. Aspinwall of ISC, for her careful reading and checking the manuscript for improvement.
REFERENCES
- K. Kaminuma, “Earthquake Detection Capability of Syowa Station, Antarctica,” Antarctic Record, Vol. 33, 1968, pp. 71-80.
- M. Kanao, K. Doi, S. Sakanaka, T. Uemura, T. Sawagaki and K. Chida, “Replacement of the Seismic Monitoring System at Syowa Station, Corresponding to the INTERSAT Link,” Antarctic Record, Vol. 50, 2006, pp. 287- 303.
- M. Kanao, “Seismological Bulletin of Syowa Station, Antarctica, 1992,” JARE Data Reports, Vol. 192 (Seismology 27), 1994, pp. 1-69.
- M. Kanao, “Seismological Bulletin of Syowa Station, Antarctica, 1997,” JARE Data Reports, Vol. 236 (Seismology 33), 1999, pp. 1-65.
- Y. Aoyama and M. Kanao, “Seismological Bulletin of Syowa Station, Antarctica, 2008,” JARE Data Reports, Vol. 317 (Seismology 44), 2010, pp. 1-85.
- M. Kanao, A. Kubo, T. Shibutani, H. Negishi and Y. Tono, “Crustal Structure around the Antarctic Margin by Teleseismic Receiver Function Analyses,” In: J. A. Gamble, D. N. B. Skinner and S. Henrys, Eds., Antarctica at the Close of a Millennium, Royal Society of New Zealand Bulletin, Vol. 35, 2002, pp. 485-491.
- K. Kuge and Y. Fukao, “High-Velocity Lid of East Antarctica: Evidence of a Depleted Continental Lithosphere,” Journal of Geophysical Research, Vol. 110, 2005, Article ID: B06309. doi:10.1029/2004JB003382
- M. Kanao, Y. Usui, T. Inoue and A. Yamada, “Broadband Seismic Deployments for Imaging the Upper Mantle Structure in the Lützow-Holm Bay Region, East Antarctica,” International Journal of Geophysics, Vol. 2011, 2011, pp. 1-15. doi:10.1155/2011/272646
- R. Kobayashi and D. Zhao, “Rayleigh-Wave Group Velocity Distribution in the Antarctic Region,” Physics of the Earth and Planetary Interiors, Vol. 141, No. 3, 2004, pp. 167-181. doi:10.1016/j.pepi.2003.11.011
- K. Nawa, N. Suda, K. Satake, T. Sato, K. Doi, M. Kanao and K. Shibuya, “Loading and Gravitational Effects of the 2004 Indian Ocean Tsunami at Syowa Station, Antarctica,” Bulletin of the Seismological Society of America, Vol. 97, No. 1A, 2007, pp. S271-S278.
- M. Kanao and K. Kaminuma, “Seismic Activity Associated with Surface Environmental Changes of the Earth System, around Syowa Station, East Antarctica,” In: D. K. Futterer, D. Damaske, G. Kleinschmidt, H. Miller and F. Tessensohn, Eds., Antarctica: Contributions to Global Earth Sciences, Springer-Verlag, New York, 2006, pp. 361-368.
- M. Kanao, Y. Nogi and S. Tsuboi, “Spacial Distribution and Time Variation in Seismicity around Antarctic Plate— Indian Ocean Region,” Polar Geoscience, Vol. 19, 2006, pp. 202-223.
- T. Himeno, M. Kanao and Y. Ogata, “Statistical Analysis of Seismicity in a Wide Region around the 1998 Mw 8.1 Balleny Islands Earthquake in the Antarctic Plate,” Polar Science, Vol. 5, No. 4, 2011, pp. 421-431, doi:10.1016/j.polar.2011.08.002
- U. Usui, Y. Hiramatsu, M. Furumoto and M. Kanao, “Thick and Anisotropic D" Layer Beneath Antarctic Ocean,” Geophysical Research Letters, Vol. 32, 2005, Aricle ID: L13311. doi:10.1029/2005GL022622
- Y. Usui, M. Kanao, A. Kubo, Y. Hiramatsu and H. Negishi, “Upper Mantle Anisotropy from Teleseismic SKS Splitting Beneath Lützow-Holm Bay Region, East Antarctica,” US Geological Survey and the National Academies, 2007.
- Y. Usui, Y. Hiramatsu, M. Furumoto and M. Kanao, “Evidence of Seismic Anisotropy and a Lower Temperature Condition in the D" layer beneath Pacific Antarctic Ridge in the Antarctic Ocean,” Physics of the Earth and Planetary Interiors, Vol. 167, No. 3-4, 2008, pp. 205-216. doi:10.1016/j.pepi.2008.04.006.
- T. Isse and I. Nakanishi, “Inner-Core Anisotropy Benearth Australia and Differential Rotation,” Geophysical Journal International, Vol. 151, No. 1, 2001, pp. 255-263. doi:10.1046/j.1365-246X.2002.01780.x
- G. Toyokuni, H. Takenaka, M. Kanao, D. A. Wiens and A. A. Nyblade, “Comparison of Global Synthetic Seismograms Calculated Using the Spherical 2.5-D Finite Difference Method with Observed Long-Period WaveForms Including Data from the Intra-Antarctic Region,” Polar Science, Vol. 6, No. 2, 2012, pp. 155-164. doi:10.1016/j.polar.2012.06.001
- M. Kanao, “Detection Capability of Teleseismic Events Recorded at Syowa Station, Antarctica 1987-2007,” Antarctic Record, Vol. 54, 2010, pp. 11-31.
- M. Kanao and K. Kaminuma, “Broad-Band and Wide Dynamic-Range Seismic Observations with a Streckeisen Seismometer (STS) at Syowa Station, East Antarctica,” Antarctic Record, Vol. 37, 1993, pp. 291-318.
- M. Kanao, K. Kaminuma, K. Shibuya, Y. Nogi, H. Negishi, Y. Tono and T. Higashi, “New Seismic Monitoring Observation System and Data Accessibility at Syowa Station,” Antarctic Record, Vol. 43, No. 1, 1999, pp. 16-44.
- T. Hagiwara, “A Note on the Theory of the Electromagnetic Seismograph,” Bulletin of the Earthquake Research Institute, Vol. 36, 1958, pp. 139-164.
- K. Kaminuma, T. Eto and M. Yoshida, “Seismological Observation at Syowa Station, Antarctica,” Antarctic Record, Vol. 33, 1968, pp. 65-70.
- G. Streckeisen and A. G. Messegeraete, “Very-Broad-Band Feedback Seismometers STS-1V/VBB and STS-1H/VBB Manual,” 1987, pp. 34-35.
- K. Nagasaka, K. Kaminuma and K. Shibuya, “Seismological Observations by a Three-Component Broadband Digital Seismograph at Syowa Station, Antarctica,” In: Y. Yoshida, K. Kaminuma and K. Shiraishi, Eds., Recent Progress in Antarctic Earth Science, Terra Scientific Publishing, Tokyo, 1992, pp. 595-601.
- B. L. N. Kennett, “IASPEI 1991 Seismological Tables,” Terra Nova, Vol. 3, No. 2, 1991, p. 122.
- S. Ushio, “Frequent Sea-Ice Breakup in the Lützow-Holmbukta, Antarctica, Based on Analysis of Ice Condition from 1980 to 2003,” Antarctic Record, Vol. 47, No. 3, 2003, pp. 338-348.
- F. Ringdal, “Study of Magnitudes, Seismicity and Earthquake Detectability Using a Global Network,” Bulletin of the Seismological Society of America, Vol. 76, No. 6, 1986, pp. 1641-1659.
- S. Tsuboi, M. Kikuchi, Y. Yamanaka and M. Kanao, “The March 25, 1998 Antarctic Earthquake: Great Earthquake Caused by Postglacial Rebound,” Earth Planets Space, Vol. 52, No. 2, 2000, pp. 133-136.
- K. Kaminuma, “A Revaluation of the Seismicity in the Antarcitc,” Polar Geoscience, Vol. 13, 2000, pp. 145- 157.
- A. M. Reading, “On Seismic Strain-Release within the Antarctic Plate,” In: D. K. Futterer, D. Damaske, G. Kleinschmidt, H. Miller and F. Tessensohn, Eds., Antarctica: Contributions to Global Earth Sciences, Springer-Verlag, New York, 2006, pp. 351-356.
- K. Kaminuma and J. Akamatsu, “Intermittent MicroSeismic Activity in the Vicinity of Syowa Station, East Antarctica,” In: Y. Yoshida, K. Kaminuma and K. Shiraishi, Eds., Recent Progress in Antarctic Earth Science, Terra Scientific Publishing, Tokyo, 1992, pp. 493-497.
- S. Anandakrishnan and R. B. Alley, “Tidal Forcing of Basal Seismicity of Ice Stream C, West Antarctica, Observed Far Inland,” Journal of Geophysical Research, Vol. 102, No. B7, 1997, pp. 15183-15196. doi:10.1029/97JB01073
- G. Ekström, M. Nettles and V. C. Tsai, “Seasonality and Increasing Frequency of Greenland Glacial Earthquakes,” Science, Vol. 311, No. 5768, 2006, pp. 1756-1758. doi:10.1126/science.1122112
- M. Nettles and G. Ekström, “Glacial Earthquakes in Greenland and Antarctica,” Annual Review of Earth and Planetary Sciences, Vol. 38, 2010, pp. 467-491. doi:10.1146/annurev-earth-040809-152414
- X. Chen, P. M. Shearer and F. Walter, “Seventeen Antarctic Seismic Events Detected by Global Surface Waves and a Possible Link to Calving Events from Satellite Images,” Journal of Geophysical Research, Vol. 116, 2011, Article ID: B06311. doi:10.1029/2011JB008262
- A. Yamada, M. Kanao and M. Yamashita, “Features of Seismic Waves Recorded by Seismic Exploration in 2002: Responses from Valley Structure of the Bedrock Beneath Mizuho Plateau,” Polar Geoscience, Vol. 17, 2004, pp. 139-155.
- M. Kanao, A. Maggi, Y. Ishihara, M.-Y. Yamamoto, K. Nawa, A. Yamada, T. Wilson, T. Himeno, G. Toyokuni, S. Tsuboi, Y. Tono and K. Anderson, “Interaction on Seismic Waves between Atmosphere-Ocean-Cryosphere and Geosphere in Polar Region,” In: M. Kanao, H. Takenaka, Y. Murai, J. Matsushima and G. Toyokuni, Eds., Seismic Waves—Research and Analysis, Intech Publishing, Rijeka, 2012, pp. 1-20.
- K. Kaminuma and H. Chiba, “The New Seismographic Vault and the Detection Capability of Syowa Station, Antarctica,” Antarctic Record, Vol. 46, 1973, pp. 67-82.
- M. Kanao and K. Kaminuma, “Detection Capability of Earthquakes Recorded at Syowa Station, Antarctica, from 1987 to 1993,” Antarctic Record, Vol. 39, 1995, pp. 156- 169.
- R. Butler and K. Anderson, “Global Seismographic Network (GSN),” IRIS Annual Report, 2008, pp. 6-7.
- B. Romanowicz, J. F. Karczewski, M. Cara, P. Bernard, J. Borsenberger, J. M. Cantin, B. Dole, D. Fouassier, J. K. Koenig, M. Morand, R. Pillet and D. Rouland, “The Geoscope Program: Present Status and Perspectives,” Bulletin of the Seismological Society of America, Vol. 81, No. 1, 1991, pp. 243-264.
- S. Tsuboi, “Poseidon (PACIFIC21),” IRIS Newsletter, Arlington, 1995, pp. 8-9.
- D. Rouland, C. Condis, C. Parmentier and A. Souriau, “Previously Undetected Earthquakes in the Southern Hemisphere Located Using Long-Period Geoscope Data,” Bulletin of the Seismological Society of America, Vol. 82, No. 6, 1992, pp. 2448-2463.
NOTES
*Corresponding author.