Open Journal of Earthquake Research
Vol.2 No.1(2013), Article ID:28386,5 pages DOI:10.4236/ojer.2013.21002
Estimating the Recurrence Periods of Earthquake Data in Turkey
Department of Statistics, Hacettepe University, Ankara, Turkey
Email: handekonsuk@gmail.com, spxl@hacettepe.edu.tr
Received December 13, 2012; revised January 16, 2013; accepted February 8, 2013
Keywords: Earthquake; Recurrence Estimation; Gutenberg-Richter Relation
ABSTRACT
In this paper, the 231 earthquake data of magnitude 5 and higher, between north (39.00˚ - 42.00˚) and east (26.00˚ - 45.00˚) coordinates in Turkey from July 12, 1900 to October 23, 2011 are statistically analyzed. The probability density function and cumulative function of the magnitude are derived. It is shown that magnitude random variable is distributed as the exponential distribution. The recurrence periods is also calculated. Recurrence period is estimated approximately two times a year for an earthquake having magnitude 5.2. Using the Gutenberg-Richter function, the relation between magnitude and frequency is represented.
1. Introduction
One of the most frightening and destructive disaster of nature is a severe earthquake and its destroying effects. If the earthquake occurs in a populated area, it may cause many deaths and injuries and extensive property damage regions [1]. Many studies have been presented to develop reliable estimates, given the large uncertainties in the pattern of earthquake occurrence. Abe and Suzuki [2] analyzed the seismic data from the viewpoint of science of complexity. These are power laws and represent the scale-free nature of the earthquake phenomenon. One of the main goals of seismology is to predict when and where the next main shock will occur after an earlier main shock.
Turkey is located on one of the important earthquake belt and, is a seismically active region. A large number of great historical earthquakes have been appeared in Turkey.
Particularly, over the past two decades Turkey faced several moderate and large earthquakes that resulted in significant loss of life and property. Since 1992, many massive earthquakes have hit the populated areas in Turkey. One of the most important earthquake, whose magnitude (M) is estimated to be about 7.4, occurred in August 17, 1998 in Marmara region.
Following the Marmara Earthquake, an earthquake having a magnitude 7.2 occurred in Düzce-Bolu region in November 12, 1999. The last massive earthquake hit Van province in October 23, 2011. All of these earth-quakes caused destructive damage and more than 16,000 people were died.
When considering the earthquake, we have to answer the four questions: Where? How often? How big? and When? The goal of the earthquake prediction is to give warning of potentially damaging earthquakes early enough to allow appropriate response to the disaster, enabling people to minimize loss of life and property [1]. The rate of recurrence of earthquakes on a seismic source can be represented with the Gutenberg-Richter relation [3].
As indicated by Figure 1, the 92% region of Turkey is on the seismic active region, therefore there have been a lot of studies on earthquake topic. Kasap and Gürlen [4] studied the return periods of earthquakes. Ogata [5] investigated the statistical models for earthquake occurrences. Utsu [6] applied gamma, log-normal, Weibull and exponential distributions to describe the probability distribution of interoccurrence time of large earthquakes in Japan. Aktaş et al. [7], used Poisson distribution to describe the recurrence times, and estimated the expected value and variance computed for the loss of life and damaged buildings after the change point using the compound Poisson process.
Bayrak et al. [8] evaluated the seismicity and earthquake hazard parameters of Turkey based on maximum regional magnitude. Authors divided Turkey into 24 seismic regions and used data between 1900 and 2005.
Öztürk et al. [9] estimated the mean return periods, the most probable magnitude in a time period of t-years, and the probability of earthquake occurrence for a given magnitude during a time span of t-years, they also
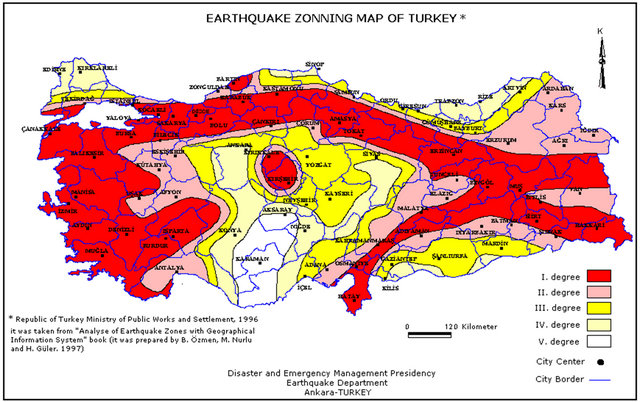
Figure 1. Seismic map of Turkey (Source: http://www.deprem.gov.tr/depbolge/).
showed that in the specific region, the most probable earthquake magnitude in the next 100 years would be over 7.5.
Bayrak et al. [10] calculated the seismicity parameters for the 24 seismic regions of Turkey according to Gumbel and Gutenberg-Richter methods and concluded that b-values obtained from the maximum likelihood approach gives better results for the tectonics of the examined area.
In this study, to find the probability distribution of magnitude is attempted and the statistical models are taken to interpret the observed frequency distribution. The statistical tools and methodologies used in the study are summarized and then the appropriate statistical models are developed.
Earthquake prediction can be considered into two types. First is the statistical prediction which is based on previous events; Data are collected from the records. Second is deterministic prediction which is made from the earthquake signs. In this study, 231 earthquake data of magnitude 5 and higher, between north (39.00˚ - 42.00˚) and east (26.00˚ - 45.00˚) coordinates in Turkey from July 12, 1900 to July 25, 2011 are analyzed. We study the records from the Turkish General Directorate of Disaster Affairs Earthquake Research Department [11].
The earthquake zones determined by using the acceleration contour map of Turkey is illustrated in Figure 1.
2. The Distribution of Magnitude
The distribution of magnitude has an important matter. Magnitude is defined as a continuous random variable having lower bound q, but it has no defined theoretical upper bound. The probability density function of magnitude random variable is defined as an exponential function,
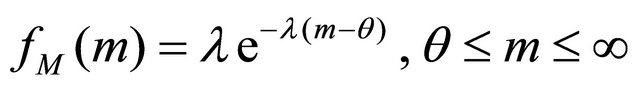 (1)
(1)
where l is calculated as,
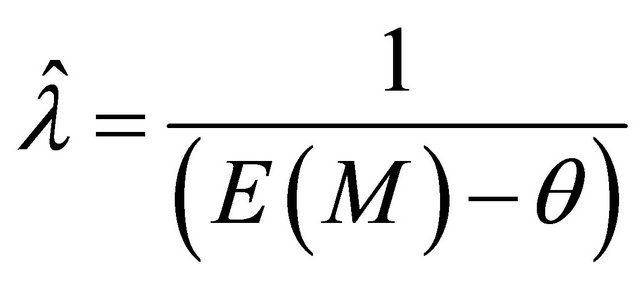 . (2)
. (2)
where, E(M) is the expected value of M.
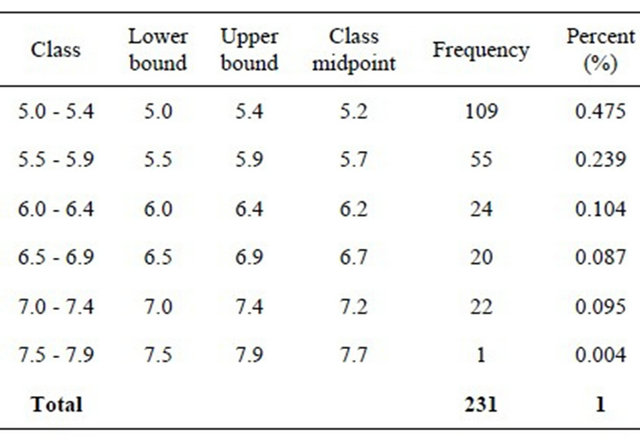
Frequency distribution of data is displayed in Table 1.
From the frequencies, it is noted that during the last century, total 231 earthquakes for magnitude 5 and higher occurred in Turkey.
The mean value of m can be used as an expected. Number of 231 earthquakes of magnitude 5 and higher ( ) data is investigated and average magnitude
Table 1. Total earthquake frequencies by magnitude.
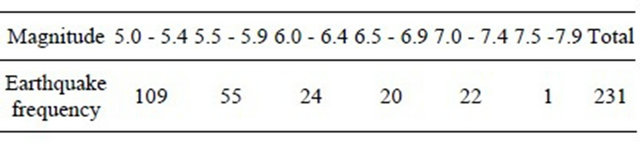
Table 2. The frequency distribution of earthquakes.
 is calculated.
  is the lower bound of the first class. Then,
  is calculated using the Equation (2),
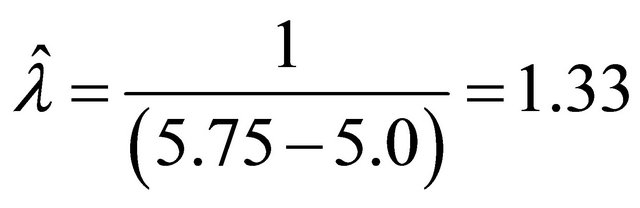 .
.
Therefore, the density function can be defined as,
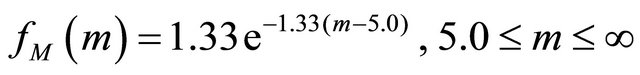 (3)
(3)
By integrating the Equation (1), the probability density function of random variable M is obtained as,
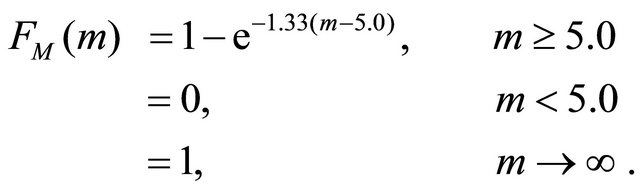 (4)
(4)
The frequency distribution of earthquakes which occurred between the dates July 12, 1900 and October 23, 2011 with respect to the magnitude is given in Table 2. Data are classified into six categories.
The goodness of fit test is performed to compare the observed frequency distribution with the theoretical exponential distribution of earthquake data using the chisquare distribution. Observed frequencies were calculated with summing the percent values as cumulative. Expected frequencies are calculated from the Equation (1) by integrating the probability density function between  and the upper bounds of every class.
The following null hypothesis is tested against the alternative hypothesisHo: There is no difference between experimental distribution and theoretical exponential distribution;
HA: There is difference between experimental distribution and theoretical exponential distribution.
Table 3. The values which are related to experimental and theoretical distribution.
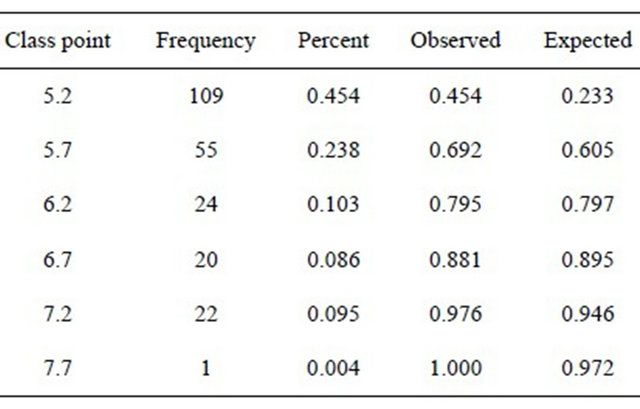
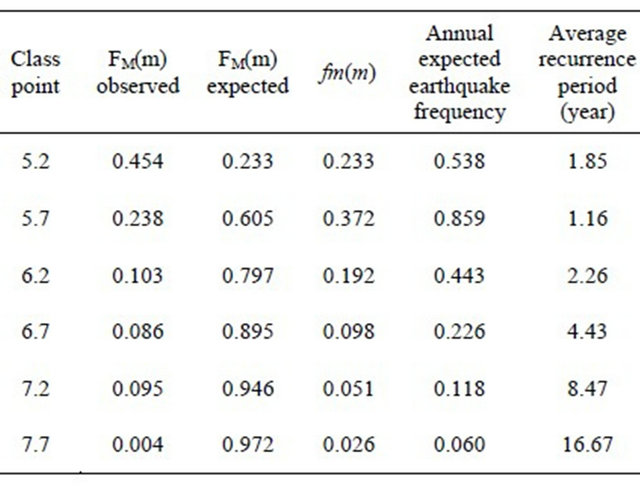
Table 4. The estimation of recurrence periods for certain earthquakes.
The expected and observed probabilities are displayed in Table 3.
Chi-square value is calculated as 0.222.
(P > 0.05). Therefore, the null hypothesis is not rejected at the level of significance 0.05. Magnitude random variable is distributed as the exponential distribution.
3. Estimation the Recurrence Periods of Earthquakes
Recurrence time is widely used for hazard assessment in seismology.
In this section, the recurrence periods of earthquakes are estimated as annually. The average recurrence time of an earthquake is usually defined as the number of years between occurrences of an earthquake of a given magnitude in a particular area. The estimations are given in Table 4.
Column  shows the occurrence probabilities of earthquakes for certain magnitudes. Fourth column of Table 4 shows that annual expected earthquake frequencies which are obtained by multiplying probability at column
  by annual average observed earthquake frequencies whose magnitude
 . Last column of Table 4 shows that recurrence periods of earthquakes for certain magnitudes.
The recurrence interval is defined as the average time span between earthquake occurrences on a fault or in a source zone. The frequency or probability distributions of intercurrence times of earthquakes are of interest as well [12].
Recurrence year can be calculated using the following formula
For example, recurrence period is estimated approximately 1.85 times a year for an earthquake having magnitude 5.2. Similarly, the recurrence period of a 7.2 magnitude earthquake is estimated as 8.47 years.
4. Modeling Approach
Although seismicity is characterized by complex incident that makes it difficult to develop coherent explanation and prediction of earthquakes, there are some wellknown empirical laws. Omori law for temporal pattern of aftershocks and the Gutenberg-Richter law for frequency and magnitude are the examples.
The rate of recurrence of earthquakes on a seismic source is assumed to follow the Gutenberg-Richter relation [3,13],
 . (5)
. (5)
whereN: number of earthquakes in magnitude range;
M: earthquake magnitude;
b0: intercept;
b1: slope.
There is a tendency for the b-value to decrease for smaller magnitude events and there is systematic decrease in b-value with increasing depth of earthquake.
In Gutenberg-Richter function, that the number of earthquakes greater than magnitude 6 that would occur in a given area over, say, 10 years, is proportional to the number of earthquakes greater than magnitude 5 in that area, which is proportional to the number greater than magnitude 4.
The relation between magnitude and frequency can be represented by the linear function as
 .
.
Model has R2 = 77% and is statistically significant with the p value = 0.0221. A big value of intercept represents the lower magnitude earthquakes.
For instance, for M = 7.5, N is predicted as 4.14.
5. Results
Geological and Statistical surveys conduct and support research on the likelihood of future earthquakes. Earthquake researches mostly include field, laboratory, and theoretical investigations of earthquake facts. A primary goal of earthquake research is to increase the reliability of earthquake probability estimates. With a greater understanding of the causes and effects of earthquakes, we may be able to reduce damage and loss of life from this destructive event. Statistics help us to predict the future events based on previous events. The significance of the results to the problem of statistical prediction of earthquakes if of interest. In this paper, the magnitude is considered as a continuous random variable and the density function of magnitude random variable is defined as an exponential function. It is shown thatmagnitude random variable of Turkish earthquake data is distributed as the exponential distribution. The estimations of recurrence periods of earthquakes for some magnitudes are estimated. The number of earthquakes having magnitude in the Richter scale greater than or equal to M, is observed to decrease with M exponentially. For instance, the recurrence period of a 7.2 magnitude earthquake is estimated as 8.47 years. The relation between magnitude and frequency can be represented by the linear function as . This model gives a linear relation between magnitude and earthquake frequency.
Consequently, earthquake is an unavoidable natural disaster for Turkey. Hence, to take precautions for the future by utilizing the past experiences are very substantial.
We might conclude from these results about the distribution of earthquakes and statistical models. Models can be extended into the future research to make forecasts or predictions of the future seismicity.
REFERENCES
- D. R. Brillinger, “Earthquake Risk and Insurance,” Environmetrics, Vol. 4, No. 1, 1993, pp. 1-21. doi:10.1002/env.3170040102
- S. Abe and N. Suzuki, “Scale-Free Statistics of Time Interval between Successive Earthquakes,” Physica A: Statistical Mechanics and Its Applications, Vol. 350, No. 2-4, 2005, pp. 588-596.
- R. Gutenberg and C. F. Richter,“Frequencies of Earthquakes in California,” Bulletin of the Seismological Society of America, Vol. 34, No. 4, 1944, pp. 185-188 .
- R. Kasap and Ü. Gürlen, “Deprem Magnitüdleri Için Tekrarlanma Yıllarının Elde Edilmesi: Marmara Bölgesi Örneği,” Doğuş Üniversitesi Dergisi, Vol. 4, No. 2, 2003, pp. 157-166.
- Y. Ogata,“Statistical Models for Earthquake Occurrences and Residual Analysis for Point Processes,” Journal of the American Statistical Association, Vol. 83, No. 401, 1988, pp. 9-27. doi:10.1080/01621459.1988.10478560
- T. Utsu, “Estimation of Parameters for Recurrence Models of Earthquakes,” Bulletin of the Earthquake Research Institute, Vol. 59, 1984, pp. 53-66.
- S. Aktaş, H. Konşuk and A. Yiğiter, “Estimation of Change Point and Compound Poisson Process Parameters for the Earthquake Data in Turkey,” Environmetrics, Vol. 20, No. 4, 2009, pp. 416-427. doi:10.1002/env.937
- Y. Bayrak, S. Öztürk, H Cinar, D. Kalafat, T. M. Tsapano, G. Ch. Koravos and G. A. Leventakis, “Estimating Earthquake Hazard Parameters from İnstrumental Data for Different Regions in and around Turkey,” Engineering Geology, Vol. 105, No. 3-4, 2009, pp. 200-210. doi:10.1016/j.enggeo.2009.02.004
- S. Öztürk, Y. Bayrak, G. Ch. Koravos and T. M. Tsapanos, “A Quantitative Appraisal of Earthquake Hazard Parameters Computed from Gumbel I Method for Different Regions in and around Turkey,” Natural Hazards, Vol. 47, No. 3, 2008, pp. 471-495. doi:10.1007/s11069-008-9234-6
- Y. Bayrak, S. Öztürk, G. Ch.Koravo, G. A. Leventakis and T. M. Tsapanos, “Seismicity Assessment for the Different Regions in and around Tyrkey Based on İnstrumental Data: Gumbel First Asymptotic Distribution and Gutenberg-Richter Cumulative Frequency Law,” NHESS, Vol. 8, 2008, pp. 1090-1122.
- http://sismo.deprem.gov.tr
- J. H. Wang and C. H. Kuo,“On the Frequency Distribution of Interoccurence Times of Earthquakes” Journal of Seismology, Vol. 2, No. 4, 1988, pp. 351-358. doi:10.1023/A:1009774819512
- http://en.wikipedia.org/wiki/Gutenberg%E2%80%93Richter_law