Open Journal of Optimization
Vol.03 No.04(2014), Article ID:52375,8 pages
10.4236/ojop.2014.34006
Fingerprint Database Optimization Using Watershed Transformation Algorithm
Owoeye Kolade, Ajayi Adedoyin Olayinka, Ukorigho Ovie
Department of Mathematical Sciences, Ekiti State University, Ado Ekiti, Nigeria
Email: kolade_owoeye@yahoo.com, dedoyyin@gmail.com, ovi.uko@gmail.com
Copyright © 2014 by authors and Scientific Research Publishing Inc.
This work is licensed under the Creative Commons Attribution International License (CC BY).
http://creativecommons.org/licenses/by/4.0/


Received 5 October 2014; revised 21 November 2014; accepted 2 December 2014
ABSTRACT
Fingerprints are a unique feature for identification and verification of humans. The need to optimise several databases for storing the images of fingerprints is a major concerning issue. Several segmentation algorithms have been used in the time past but there are still several challenges facing some current segmentation algorithms like computational efficiency. Another challenge is that segmentation procedure can be impractically slow, or requires extremely large amounts of memory. This paper addresses the challenges by employing watershed flooding algorithm on the fingerprint images so as to optimize the sizes of the databases. A pre-processing plug-in that implements this segmentation process is developed using Java. We showed its effectiveness by testing it on fingerprint image dataset and the entropy showed that the segmented images sizes were reduced.
Keywords:
Watershed, Transformation, Fingerprint, Segmentation, Entrophy

1. Introduction
Image Segmentation is a fundamental step in analysing and understanding images. It is a process of partitioning the image into multiple segments [1] [2] . It is the first important step in many image processing applications like image analysis, image description and recognition, image visualization and object based image compression. Image segmentation means assigning a label to each pixel in the image such that pixels with same labels share common visual characteristics.
For more than a century, fingerprints were considered to be the identifying mark for the human beings. Fingerprint is a protected human organ and an effective biometric approach to human or personal identification. It acts like living passwords for humans as its texture is stable throughout the human life. Fingerprints are an impression left by the friction ridges of human finger.
For several reasons, we need to store these fingerprints in a database and among them one of the main reasons is they are used for analysis of forensic evidence worldwide. For storing several fingerprint impressions a huge database is needed, where the size of the database is also a matter of consideration. A huge database needs a huge amount of memory space. If we can reduce the size of the data then we can store more number of data in the same memory space.
Watershed transformation can be applied to human fingerprints segmentation by taking the idea from friction ridges of human finger and also with an effective storage capacity for the segmented images. Watershed algorithm depends on ridges to perform a proper segmentation, a property that is often fulfilled in contour detection where the boundaries of the objects are expressed as ridges.
In grey scale mathematical morphology the watershed transform, which was originally proposed by [3] and later improved by [4] , was the method of choice for image segmentation [5] . When simulating the watershed transform for image segmentation, two approaches may be used: either one first finds basins, then watersheds by taking a set complement; or one computes a complete partition of the image into basins, and subsequently finds the watersheds by boundary detection.
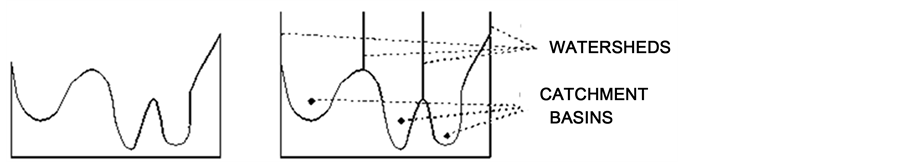
The basic idea behind watershed algorithm by immersion comes from Geography. It requires that one think of an image as a surface; that bright areas are “high” surfaces and dark areas are “low” surfaces. With surfaces, it is natural to think in terms of catchment basins and watershed lines. Basins, also called catchment basins (Figure 1), will fill up with water starting at these local minima, and, at points where water coming from different basins would meet, dams are built.
When the water level has reached the highest peak in the landscape, the process is stopped. As a result, the landscape is partitioned into regions or basins separated by dams, called watershed lines or watersheds.
Finally, this paper is organized in sections. Section 2 explained the related work. Watershed algorithmic definitions were discussed in Section 3. While the implementation process in Section 4. Lastly, summary and conclusion is in Section 5.
2. Related Work
Although the research by [5] is the most related to our research, comprehensive reviews of early segmentation techniques can be found in [7] and [8] . Some classes of segmentation methods are considered below: Gray level thresholding, and region growing/merging techniques.
Gray level thresholding is a generalization of binary thresholding [9] . Binary thresholding works by determining the gray level value that separates pixels in the foreground from pixels in the background, and generating a “threshold image” where pixels are assigned one of two possible values corresponding to “foreground” and “background” depending on whether their gray level is above or below the selected threshold.
The work of Beveridge et al. [10] offers a good example of a procedure that integrates both gray level thresholding and region merging. In their paper, an input image (which can be either grayscale or colour) is divided into sectors of fixed size and fixed location. An intensity histogram is calculated for each sector (and on colour images, for each colour channel), and used to produce a local segmentation. For every sector, information from its neighbors is used to detect clusters for which there may not be enough local support due to the artificially induced partition of the image. After the local segmentations are complete, the sector boundaries are removed by merging together similar regions in neighboring sectors.
 (a) (b)
Figure 1. One dimensional example of watershed segmentation. (a) Gray level profile of Image data; (b) Watershed segmentation―local minima of gray level (altitude) yield catchment basins; local maxima define the watershed lines (Source: [6] ).
The above measure is computed for both the complete regions, and a band that is within a fixed, small distance on both sides of the boundary. Two regions are merged if the merge score is below a specified threshold for both the global and local measure.
The last step in the segmentation is region merging; this step uses a merge score composed of a pairwise comparison of several region features. Since the algorithm can only merge regions, the thresholds used during the local, threshold based segmentation stage are selected so that they’ll yield a significantly over-segmented image; the merging step is then relied upon to turn the un-segmented image into a reasonable segmentation. Results presented in [10] show that this algorithm produces good segmentations in parts of the image that are reasonably homogeneous, and over-segmented regions when there is texture, significant intensity gradients, or objects with non-uniform coloring. The algorithm is not without problems, as there are several thresholds that must be chosen carefully depending on the image, and the region boundaries themselves have slight artifacts introduced by the sector-based initial segmentation. Even so, the algorithm illustrates what can be achieved with thresholding merging schemes.
The works in the literature showed that many current algorithms are able to produce reasonable results on images of moderate complexity; several of these algorithms are efficient enough that they can be used as a pre- processing stage for higher level vision tasks such as recognition and tracking.
However, there are still several challenges facing some current segmentation algorithms. Computational efficiency is still a concern issue when the processing of large affinity matrices is a part of the segmentation process, ultimately, a segmentation procedure can become impractically slow, or require extremely large amounts of memory. These have limited the size of the images that can be processed using many recent algorithms. However, we expect that the constant increase in computational power and storage capacity of modern computers should progressively reduce these limitations. The definition of a good similarity measure for general images remains an open issue. There is a general consensus that a robust image segmentation algorithm should combine multiple image cues and estimate similarity based on this combination, but so far there are few algorithms that use more than a single cue as a similarity measure, and only recently has a significant effort been dedicated to designing similarity measures based on the statistics of natural images, and human-generated segmentations.
The design of a good similarity measure is tied to the robustness of the segmentation algorithm in dealing with surface markings, lighting artifacts, and image texture. Evaluating the output of segmentation algorithms is still problematic. Therefore, watershed algorithm is adopted in this paper.
3. Watershed Algorithmic Definition
The diagrammatic descriptions of watershed lines and catchment basins have been presented in Figure 1. An algorithmic definition of the watershed transform by simulated immersion was given by [2] . Consider a digital grey value image,  with minimum value
  and maximum value
  of
of . We plunge this surface into a lake with a constant vertical speed, with water entering through the holes and flood the surface. Define a recursion with the grey level
 ![]() increasing from
increasing from ![]() to
to![]() , in which the basins associated with the minima of
, in which the basins associated with the minima of ![]() are successively expanded. Let
are successively expanded. Let ![]() denote the union of the set of basins computed at level
denote the union of the set of basins computed at level![]() . A connected component of the threshold set
. A connected component of the threshold set ![]() at level
at level ![]() can be either a new minimum, or an extension of a basin in
can be either a new minimum, or an extension of a basin in![]() : in the latter case one computes the geodesic influence zone of
: in the latter case one computes the geodesic influence zone of ![]() within
within , resulting in an update
 .
.
Let  denote the union of all regional minima at altitude
 .
.
Definition (Watershed Transform): Let  have a minima
  for some index set
 . The catchment basin
  of a minimum
  is defines as the set of points
  which are topographically closer to
  than to any other regional minimum
 .
.

The watershed of  is the set of points which do not belong to any catchment basins:

Let  be some label,
 . The watershed transform of
  is a mapping
 , such that
 , if
, if , and
, and  if
if .
.
So the watershed transform of  assigns labels to the points of
 , such that i) different catchment basins are uniquely labeled, and ii) a special label
  is assigned to all points of the watershed of
 .
.
We assume, from [11] , a geodesic distance  between
  and
and  within
  for
for , with
  where
where  is the minimum path length among all paths within
  from
from  to
to  (in the con- tinuous case, read “infimum” instead of “minimum”). If
  is a subset of
 , define
 .
.
Let  be partitioned in
  connected components
 ,
, . The geodesic influence zone of the set
  within
  is defined as:

Let , The set
  is the union of the geodesic influence zones of the connected components of
  [12] , i.e.,

The definition of  is used in the construction of a watershed algorithm by immersion.
Definition (watershed by immersion):

The watershed  of
of  is the complement of
  in
in :
:

4. The Implementation Process
A pre-processing plug-in that implements this segmentation process is developed using Java PL. This plug-in would be compatible with an application called Image J [12] , a general purpose image-processing and image- analysis package. Image J is of choice because it has a public domain licence, it runs on several operating system platforms. This application would apply the watershed flooding algorithm which can be interrupted to a user-specified level. Each particle should have a local maximum (or local minimum when the objects are dark) to define a catchment basin.
The Watershed algorithm by immersion is presented in Table 1.
The SKIZ (skeleton by influence zones) function is the complement of the set  (defined in Section 3) within
 , and is defined as:

So the SKIZ consists of all points which are equidistant (in the sense of the geodesic distance) to at least two nearest connected components. For a binary image  with domain
 , the SKIZ can be defined by identifying
  with the set of foreground pixels [11] .
This approach is being implemented on different fingers, where the segmented results are very clear. Figures 2-6 presents the application of the approach on the little finger, the ring finger, the middle finger, grooming finger and thumb finger respectively. In the figures presented, (a) is the original image, (b) is the grey scale image of the original one, (c) shows the overlaid basins of the grey scale image, (d) shows the catchment basins, (e) shows the composite image and finally one gets the segmented image (f) after applying watershed algorithm.
From Table 2, the entropy for original images with their segmented results has been measured.
Entropy is defined as:

where  is the probability that
  is in the state
  and
and  is defined as 0 if
 . The joint en-

Table 1. Watershed algorithm by immersion.
Table 2. The entropy for original images with segmented results.
 (a) (b) (c) (d) (e) (f)
Figure 2. Application of this approach on the little finger.
 (a) (b) (c) (d) (e) (f)
Figure 3. Application of this approach on the ring finger.
 (a) (b) (c) (d) (e) (f)
Figure 4. Application of this approach on the middle finger.
 (a) (b) (c) (d) (e) (f)
Figure 5. Application of this approach on the grooming finger.
 (a) (b) (c) (d) (e) (f)
Figure 6. Application of the approach on the thumb finger.
tropy of variable ![]() is defined by:
is defined by:
![]()
The performance of segmentation algorithm can be measured with the help of entropy and as in term of visual quality of the original image and the resulted image. The image entropy can provide a good level of information to describe a given image.
Low entropy images have very little contrast and large runs of pixels with the same values. An image that is perfectly flat will have entropy of zero. Consequently, they can be compressed to a relatively small size. On the other hand, high entropy images such as an image of heavily cratered areas on the moon have a great deal of contrast from one pixel to the next and consequently cannot be compressed as much as low entropy images.
Comparison with Related Works
As depicted earlier, the research by [5] is a good threshold to adjudge the efficiency of our algorithm. In the end, the case study images selected is random and entropies also become random. However, the images selected by [5] have almost similar entropies to our images and so the percentage of reduction of their original images to segmented images is presented in Table 3.
The difference comparison is shown in Table 4.
As shown, we can see that the implementation of watershed algorithm in our scheme offers better computation (and hence, better storage reduction) capacity.
5. Summary and Conclusions
This approach has provided an easy method of the segmentation of the human fingerprints based on watershed
Table 3. The entropy for original images with segmented results [5] .
Table 4. Comparing our scheme and [5] .
transformation. The concept of watershed algorithm has been used for segmentation purpose. In practical applications, fingerprints are unique feature for identification and verification of humans, and as well as we need to maintain several databases for storing the images of fingerprints and the sizes of the databases are a major concerned issue. We can store the segmented images of fingerprints instead of the original images to reduce the size of the databases. The final result of segmentation depends upon the quality of scanner and the inkpad which we use.
Thus method is therefore recommended in achieving the aim of optimizing the size of image database.
References
- Das, S. Lecture Notes. IIT Madras, India. http://vplab.iitm.ac.in/courses/CV_DIP/PDF/lect-Segmen.pdf
- Vincent, L. and Soille, P. (1991) Watersheds in Digital Spaces: An Efficient Algorithm Based on Immersion Simulations. IEEE Transactions on Pattern Analysis and Machine Intelligence, 13, 583-598. http://dx.doi.org/10.1109/34.87344
- Digabel, H. and Lantuejoul, C. (1978) Iterative Algorithms. Proceedings of the 2nd European Symposium Quantitative Analysis of Microstructures in Material Science, Biology and Medicine, 85-89.
- Beucher, S. and Meyer, F. (1993) The Morphological Approach to Segmentation: The Watershed Transformation, Mathematical Morphology in Image Processing. Marcel Dekker Inc., New York, 433-481.
- Acharjya, P.P. and Ghoshal, D. (2012) An Effective Human Fingerprint Segmentation Method Using Watershed Algorithm. International Journal of Computer Applications, 53. http://dx.doi.org/10.5120/8482-2422
- Ulbsibiu, R. (2014) Watershed Segmentation. http://remus.ulbsibiu.ro/teaching/courses/docs/acs/Watershed%20Segmentation.doc
- Haralick, R.M. and Shapiro, L.G. (1985) Image Segmentation Techniques. Computer Vision, Graphics and Image Pro- cessing, 29, 100-132. http://dx.doi.org/10.1016/s0734-189x(85)90153-7
- Pal, N.R. and Pal, S.K. (1993) A Review on Image Segmentation Techniques. Pattern Recognition, 26, 1277-1294. http://dx.doi.org/10.1007/978-3-662-21817-4_10
- Berthold, K. and Horn, P. (1986) Robot Vision. MIT Press, Cambridge.
- Ross Beveridge, J., Griffith, J., Kohler, R.R., Hanson, A.R. and Rise-Man, E.M. (1989) Segmenting Images Using Localized Histograms and Region Merging. International Journal of Computer Vision, 2, 311-347. http://dx.doi.org/10.1007/bf00158168
- Roerdink, J.B.T.M. and Meijster, A. (2001) The Watershed Transform: Definitions, Algorithms and Parallelization Strategies. Fundamenta Informaticae, 41, 187-228.
- http://imagej.nih.gov/ij/