Journal of Minerals and Materials Characterization and Engineering
Vol.2 No.1(2014), Article ID:41831,7 pages DOI:10.4236/jmmce.2014.21002
Comparative Spectroscopic Studies on Pure, 10 and 50 mol% Glycine Mixed L-Valinium Picrate Crystals
1St. Joseph’s College of Engineering & Technology, Thanjavur, India
2TBML College, Porayar, India
3Government Arts College (Autonomous), Kumbakonam, India
Email: *crrajaphy@gmail.com
Copyright © 2014 Antony A. Joseph et al. This is an open access article distributed under the Creative Commons Attribution License, which permits unrestricted use, distribution, and reproduction in any medium, provided the original work is properly cited. In accordance of the Creative Commons Attribution License all Copyrights © 2014 are reserved for SCIRP and the owner of the intellectual property Antony A. Joseph et al. All Copyright © 2014 are guarded by law and by SCIRP as a guardian.
Received September 12, 2013; revised October 22, 2013; accepted November 3, 2013
KEYWORDS
Crystal Growth; L-Valinium Picrate; FT-IR; Nuclear Magnetic Resonance; SHG; NLO
ABSTRACT
Nonlinear optical crystals of pure, 10 and 50 mol% glycine mixed L-valinium picrate have been grown from saturated aqueous solution by slow evaporation method at a temperature of 36˚C using a constant temperature bath of accuracy of ±0.01˚C. The synthesized organic optical material has been purified by repeated recrystallization. The cell parameters were calculated using single crystal X-ray diffraction technique which confirmed the crystal system. Optical behavior was examined by UV-Vis-NIR spectrometer in the range from 190 nm to 1100 nm, which revealed the absence of absorption in the entire visible region. Functional groups and modes of vibration were identified by FT-IR spectrometer in the range between 400 cm−1 and 4000 cm−1. The 1Hand 13C NMR spectra of grown crystals were recorded using D2O as solvent on a Bruker 300 MHz (Ultrashield) TM instrument at 23˚C (300 MHz for 1H NMR and 75 MHz for 13C NMR) to confirm the molecular structure. The second harmonic generation conversion efficiency was investigated by Kurtz powder method using Nd: YAG laser as a source to explore the NLO characteristics.
1. Introduction
To satisfy the modern society’s demand for photonics and telecommunication, extensive search of new nonlinear optical (NLO) materials is very essential [1]. The investigations on new nonlinear optical crystals with high second harmonic generation efficiency are more attractive because of their application in the field of telecommunication, optical computing and optical storage [2,3]. Organic nonlinear optical crystals are more resourceful materials for NLO applications compared to inorganic materials due to their large electro-optic coefficient with low frequency dispersion and high nonlinearity [4]. Due to chiral symmetry and noncentro symmetric properties, complex of amino acid with organic acid is promising materials for NLO applications [5]. Hence, lots of researches are being carried out to synthesize new organic NLO materials. In our laboratory, we engaged in finding new NLO materials and some of the results were reported recently [6-8]. Growth and characterization on nonlinear optical crystal L-valinium picrate were carried out and reported earlier [9-12]. Growth and characterization on L-valinium picrate and 10 mol% of glycine mixed L-valinium picrate were reported by other authors [13, 14]. In the present investigation, the synthesis and growth of pure, 10 and 50 mol% glycine mixed L-valinium picrate crystals from its aqueous solution by slow evaporation have been reported. The cell parameters were calculated using single crystal X-ray diffraction studies. Using UV-Vis-NIR spectrum, transmission properties were reported. Functional groups were identified by FT-IR analysis. The chemical structure was discussed using FT-NMR technique and SHG test was also performed to confirm the NLO property.
2. Crystal Growth
Analar grade samples of glycine, valine and picric acid were employed for the synthesis of L-valinium picrate (LVP). 10 mol% glycine mixed L-valinium picrate (10 GVP) and 50 mol% glycine mixed L-valinium picrate (50 GVP). LVP was synthesized by the reaction between picric acid and the amino acid, L-valine taken in equimolar ratio. 10 GVP has been grown from glycine, valine and picric acid taken in the ratio of 0.1:0.9:1 (Glycine: Valine: Picric Acid) in the deionized water. Same procedure was carried out to obtain 50 GVP in the ratio of 0.5:0.5:1 (Glycine: Valine: Picric Acid). The purity of the synthesized materials was increased by successive recrystallization. The chemical reaction involved in growth of L-valinium picrate may be written as follows.
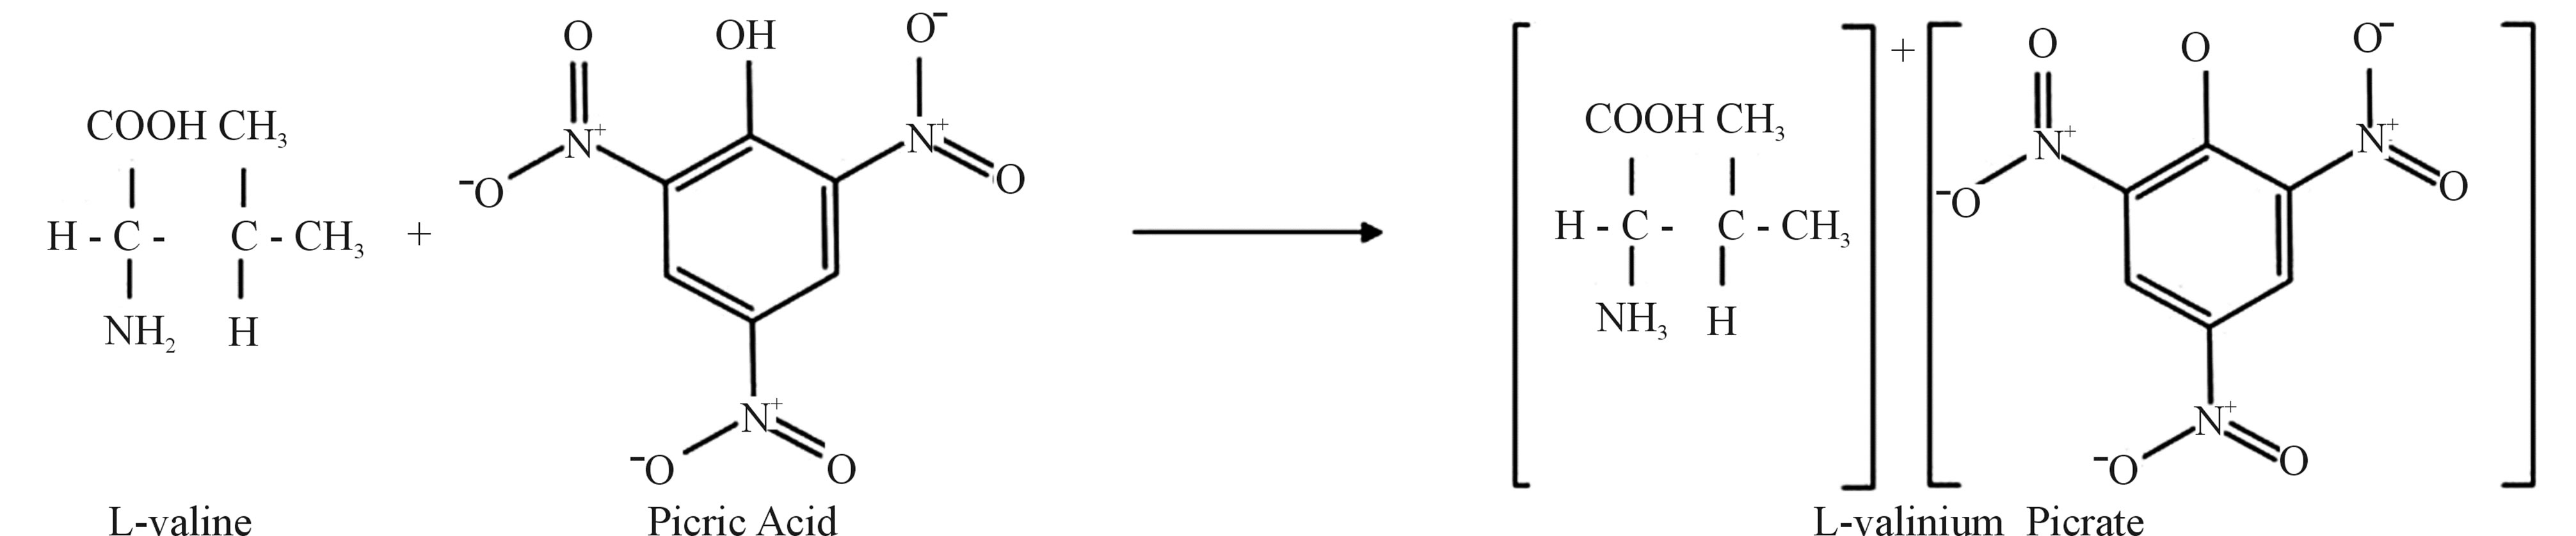
The purified powder of LVP, 10 GVP and 50 GVP were dissolved thoroughly in double distilled water at 30˚C to form saturated solution. The solutions were heated to remove any undissolved substance and filtered to remove the dust particles. Then the solutions were kept aside undisturbed for the growth of single crystal. After two weeks, good quality transparent crystals were harvested.
3. Result and Discussion
3.1. XRD Technique
The single crystal diffraction analysis of LVP, 10 GVP and 50 GVP were carried out using ENRAF NONIUS CAD-4 single X-ray diffractometer with MoK α (λ = 0.71073 Å) radiation. From the XRD data, it was observed that 10 GVP crystallizes in orthorhombic crystal system and LVP, 50 GVP crystallizes in monoclinic system. The observed cell parameters are tabulated in the Table 1.
3.2. UV-Vis-NIR Analysis
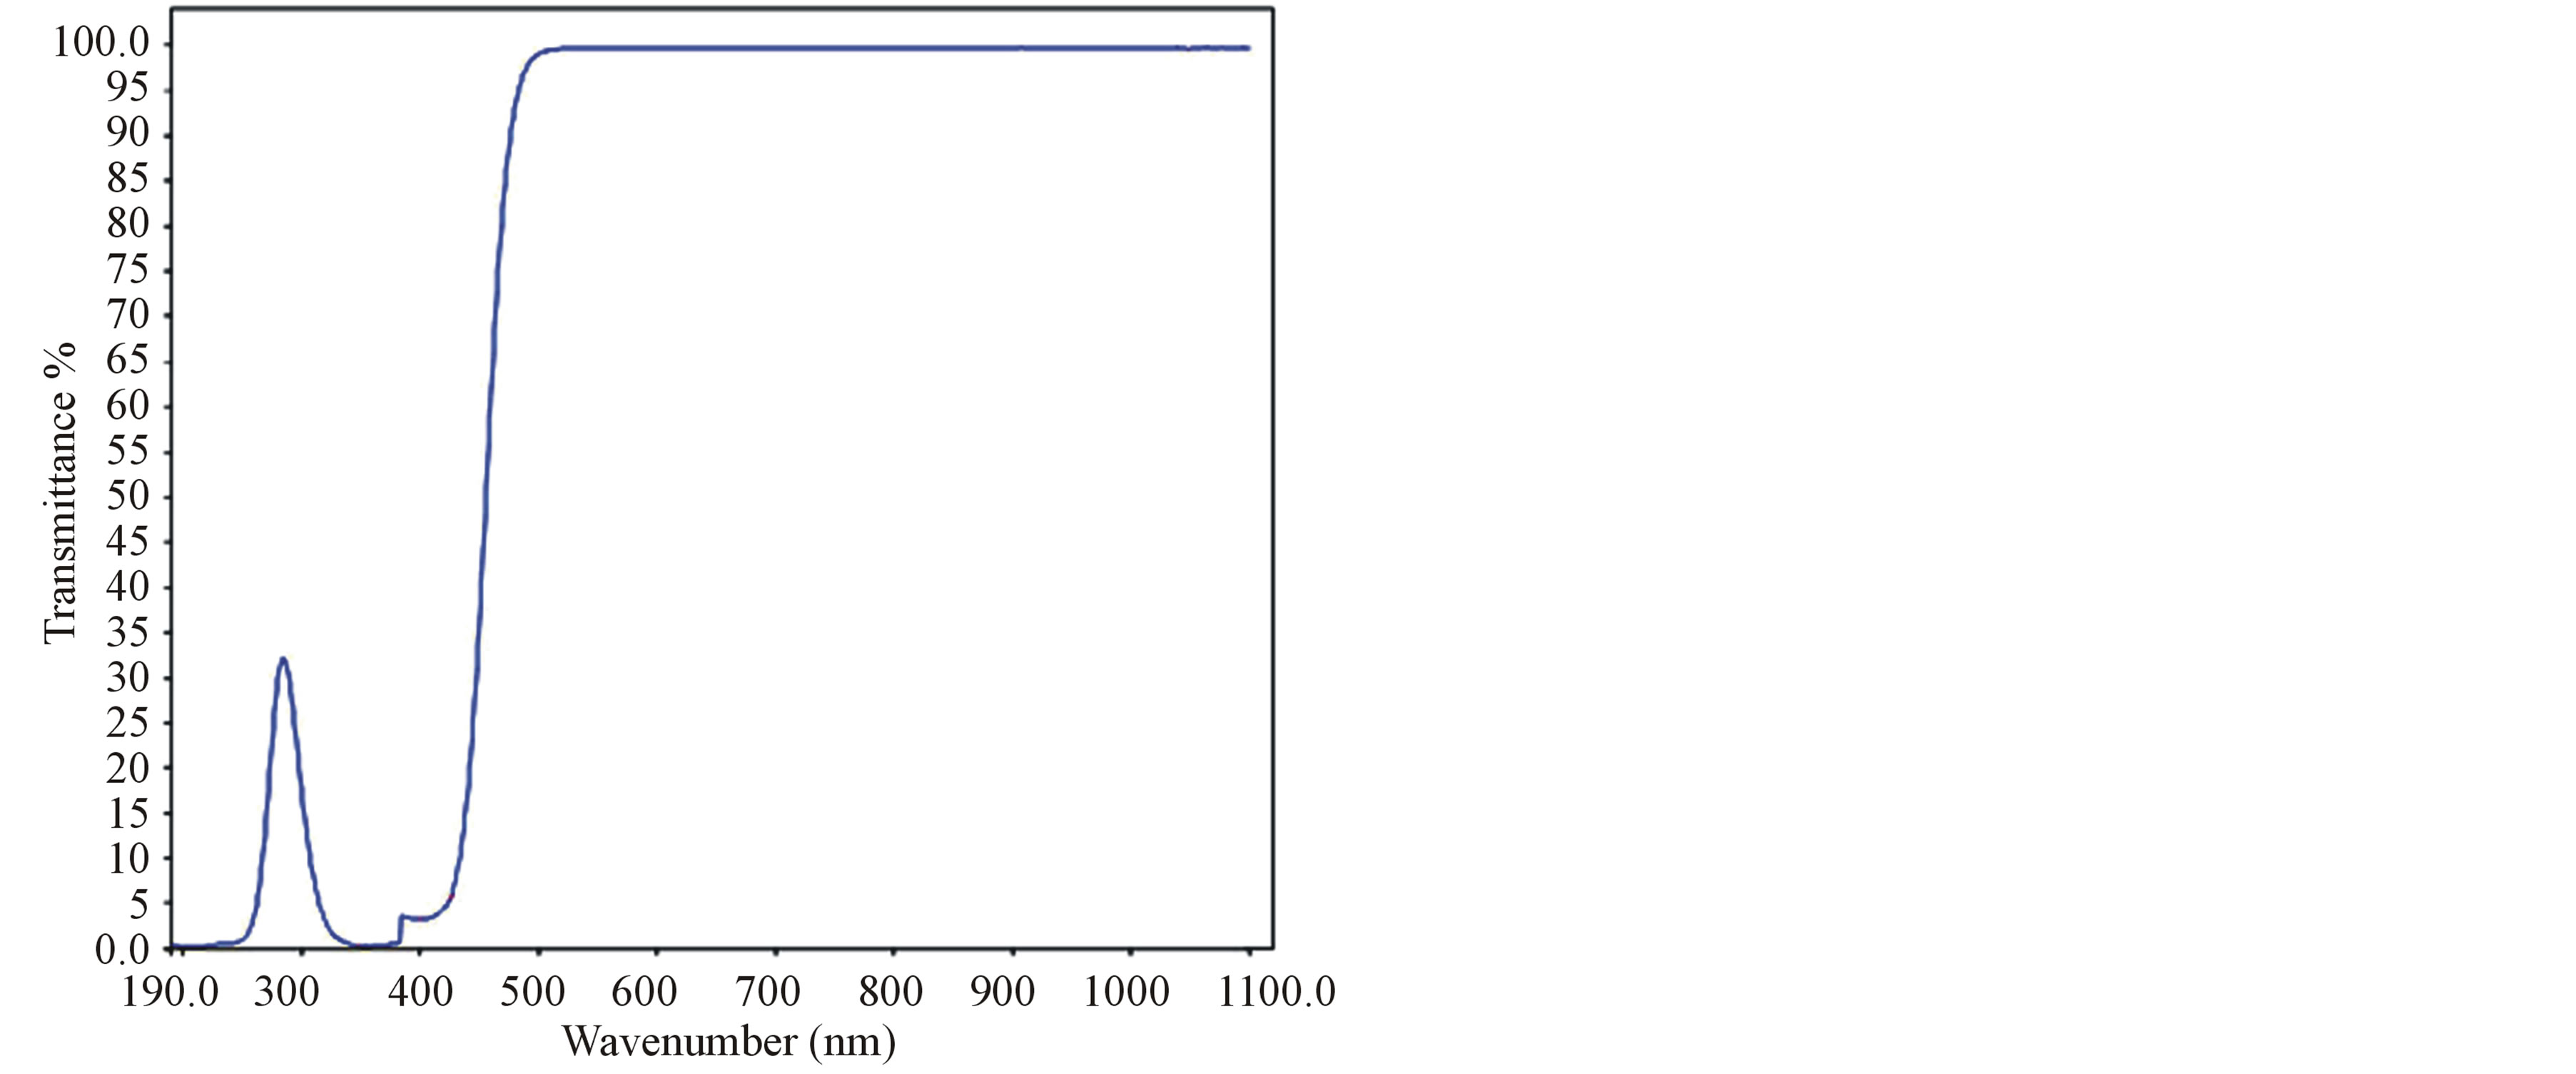
The UV-Vis-NIR spectrum of grown crystals were recorded using Lambda 35 double beam spectrometer in the range at 190 nm to 1100 nm and it is shown in Figure 1. From the transmission spectrum, it was observed that the grown crystal has transparency from 425 nm to 1100 nm. UV cut-off wavelength of L-valinium picrate (LVP), 10 mol% glycine mixed L-valinium picrate (10 GVP) and 50 mol% glycine mixed L-valinium picrate (50 GVP) are 425 nm, 460 nm and 450 nm respectively. The transparency above the 460 nm satisfies the requirement for frequency doubling of Nd: YAG laser. The observed peaks in the range between 200 nm to 360 nm, were due to transition from n to P* transitions of carbonyl group [15].
3.3. FT-IR Analysis
The FT-IR spectrum of grown crystals were recorded in the KBr phase in the frequency region of 400 - 4000 cm−1 using Perkin-Elmer FT-IR spectrometer (model SPECTRUMRX1) and shown in Figure 2. The recorded spectrum was compared with the available literature [16]. The observed vibrational frequencies and their tentative assignments are given in the Table 2.
The stretching vibration of  of amino acid was observed at 3088, 3080 and 3081 cm−1 in LVP, 10 GVP, 50 GVP respectively which was found due to superimposed of OH and
  stretching bands. A broad absorption occurred around 3446 cm−1 (LVP) 3428 cm−1 (10 GVP), 3432 cm−1 (50 GVP) due to OH stretching band. The absorptions around 1720 cm−1 and 1480 cm−1 of all the three spectrums are due to stretching of COO− bands. The rocking vibration of NH3 and CH2 was
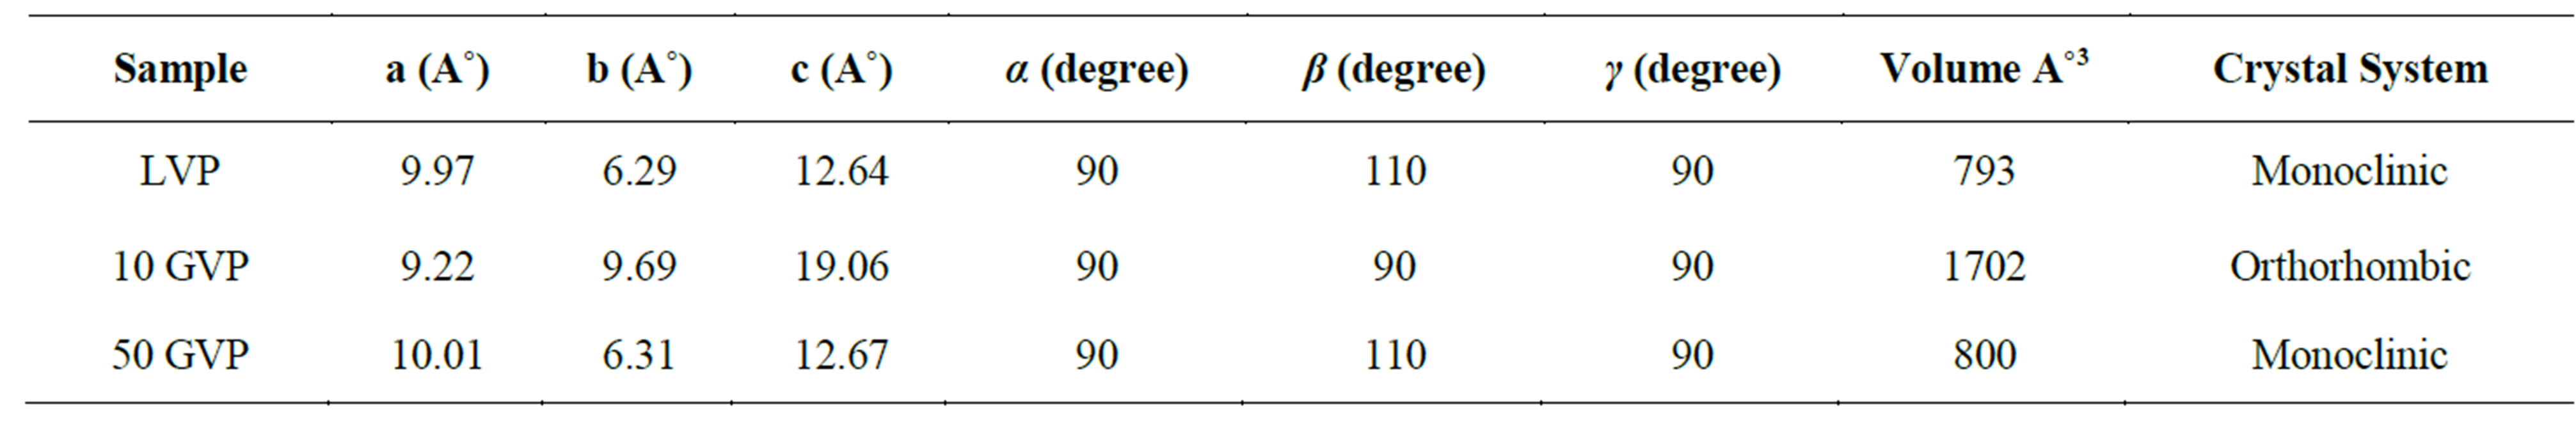
Table 1. Lattice parameter values of grown crystals.
 (a)
(a)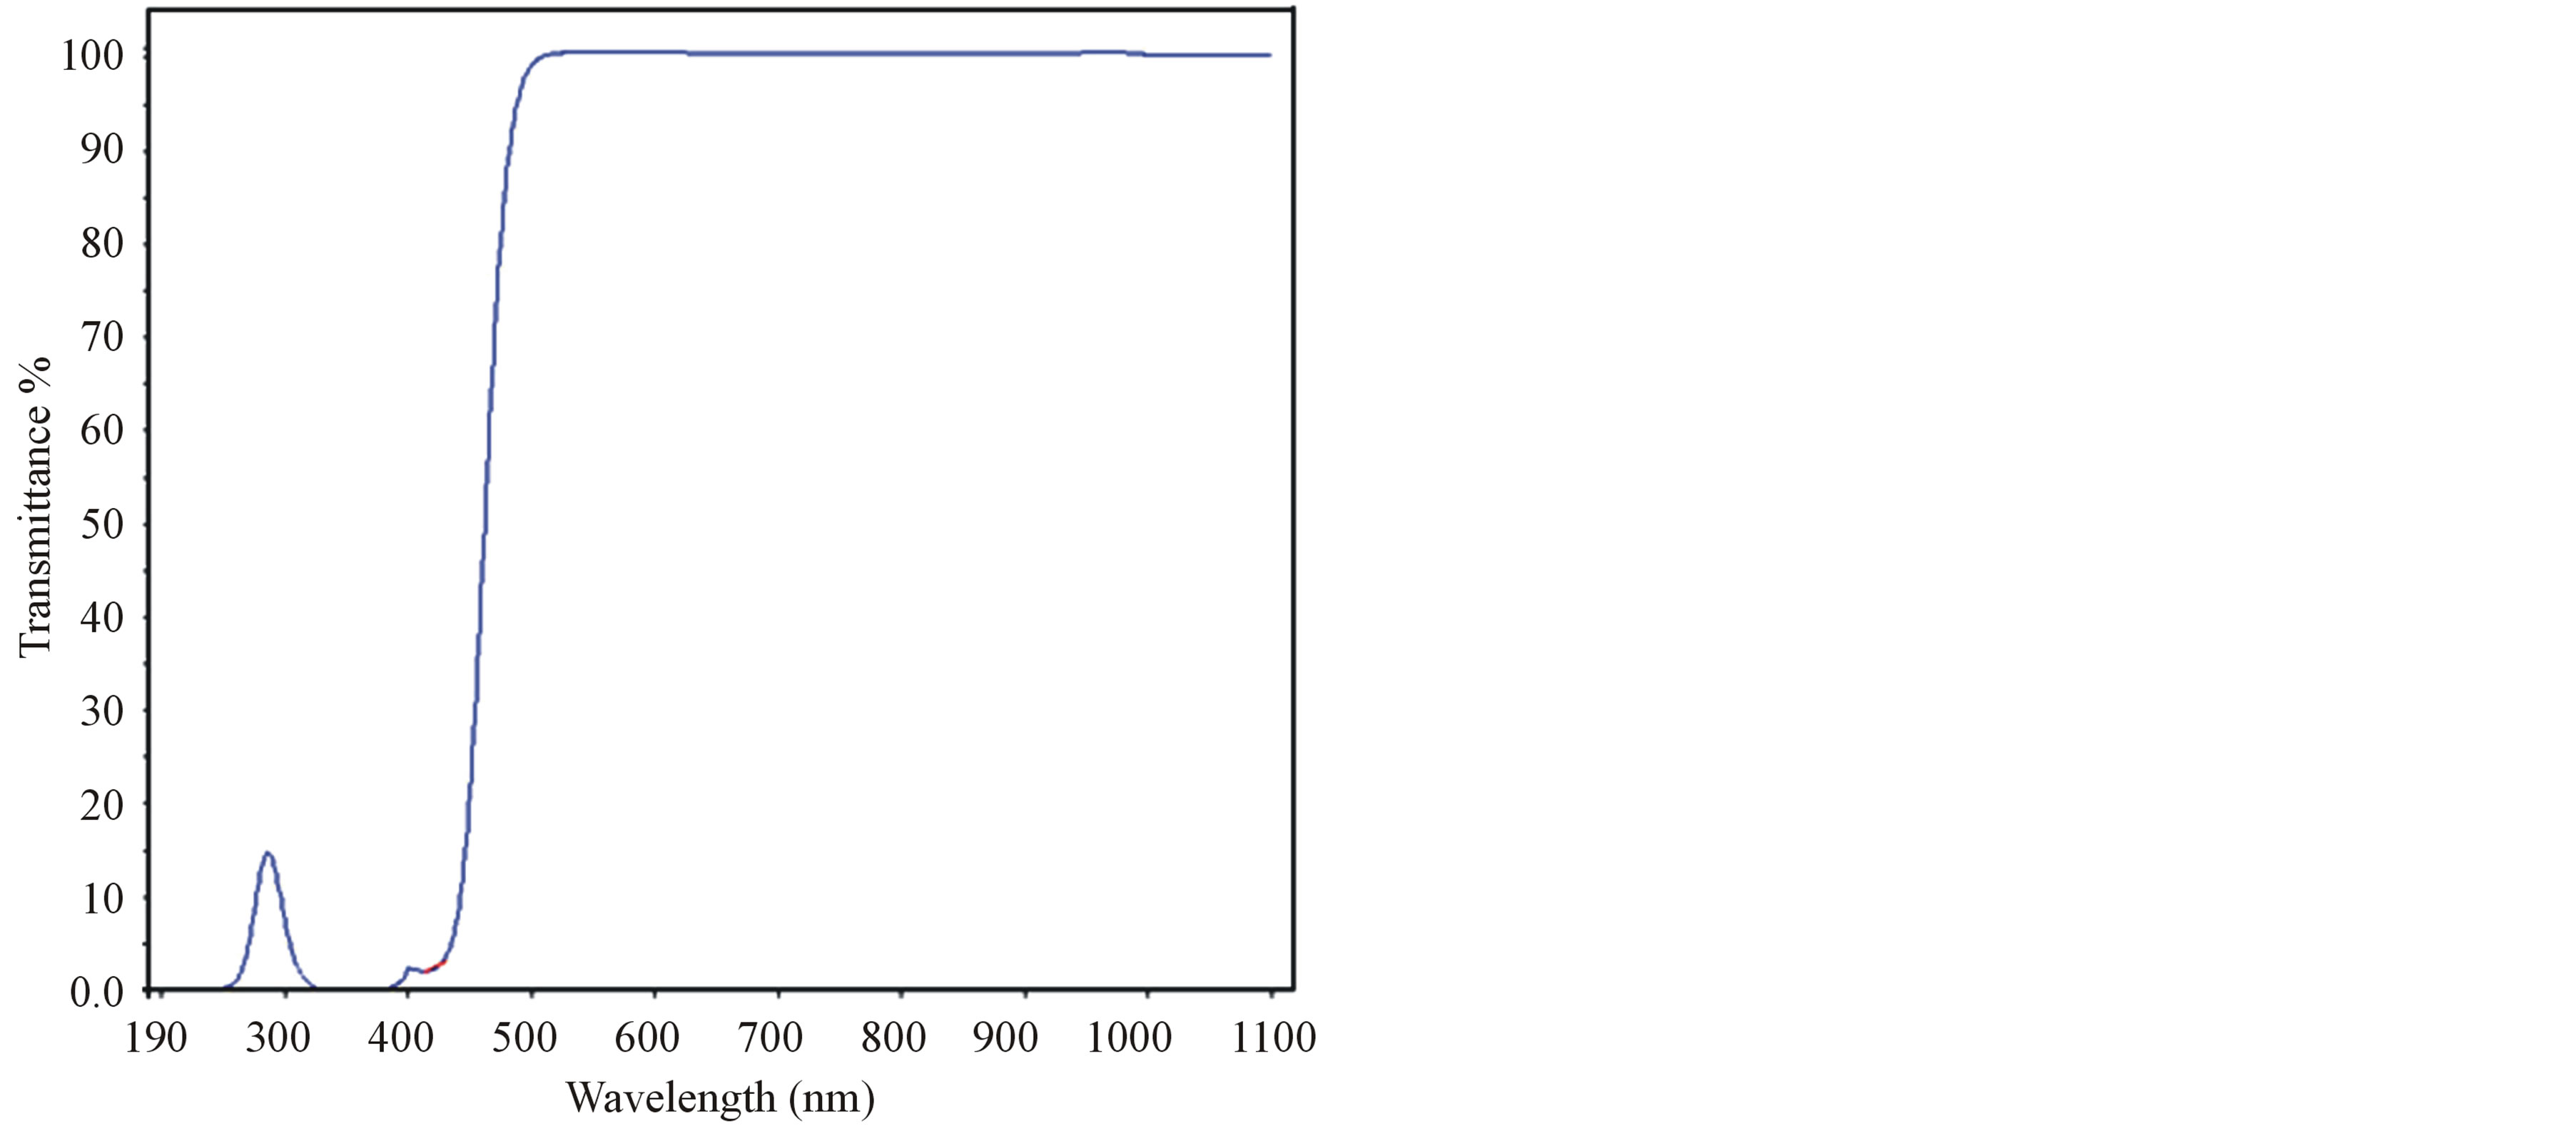 (b)
(b)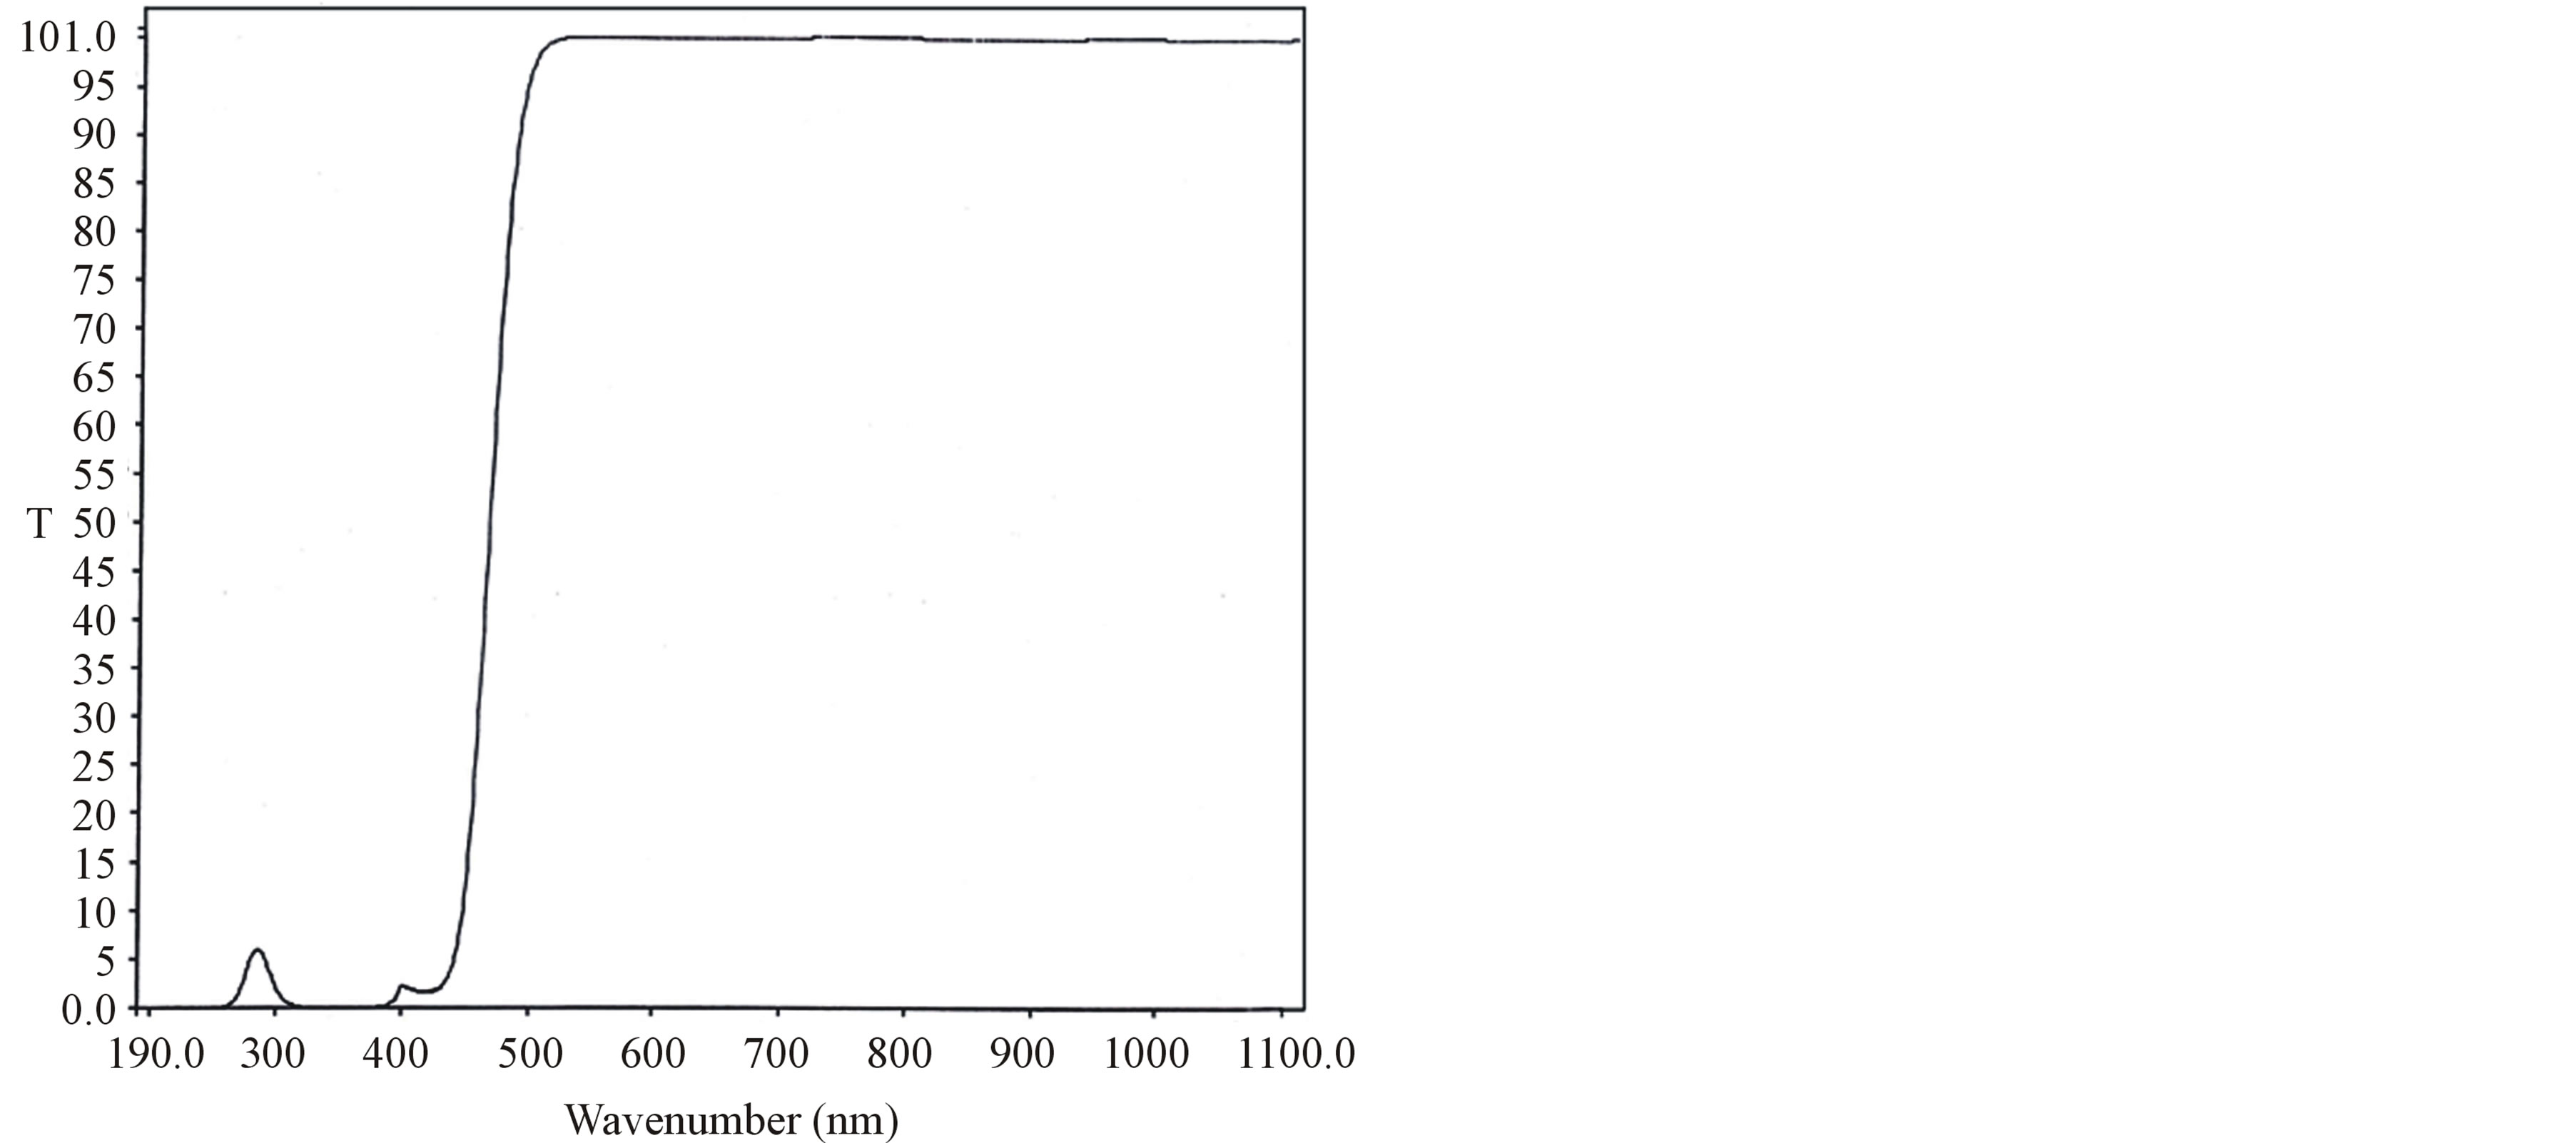 (c)
(c)
Figure 1. (a) Transmission spectrum of LVP; (b) Transmission spectrum of 10 GVP; (c) Transmission spectrum of 50 GVP.
 (a)
(a)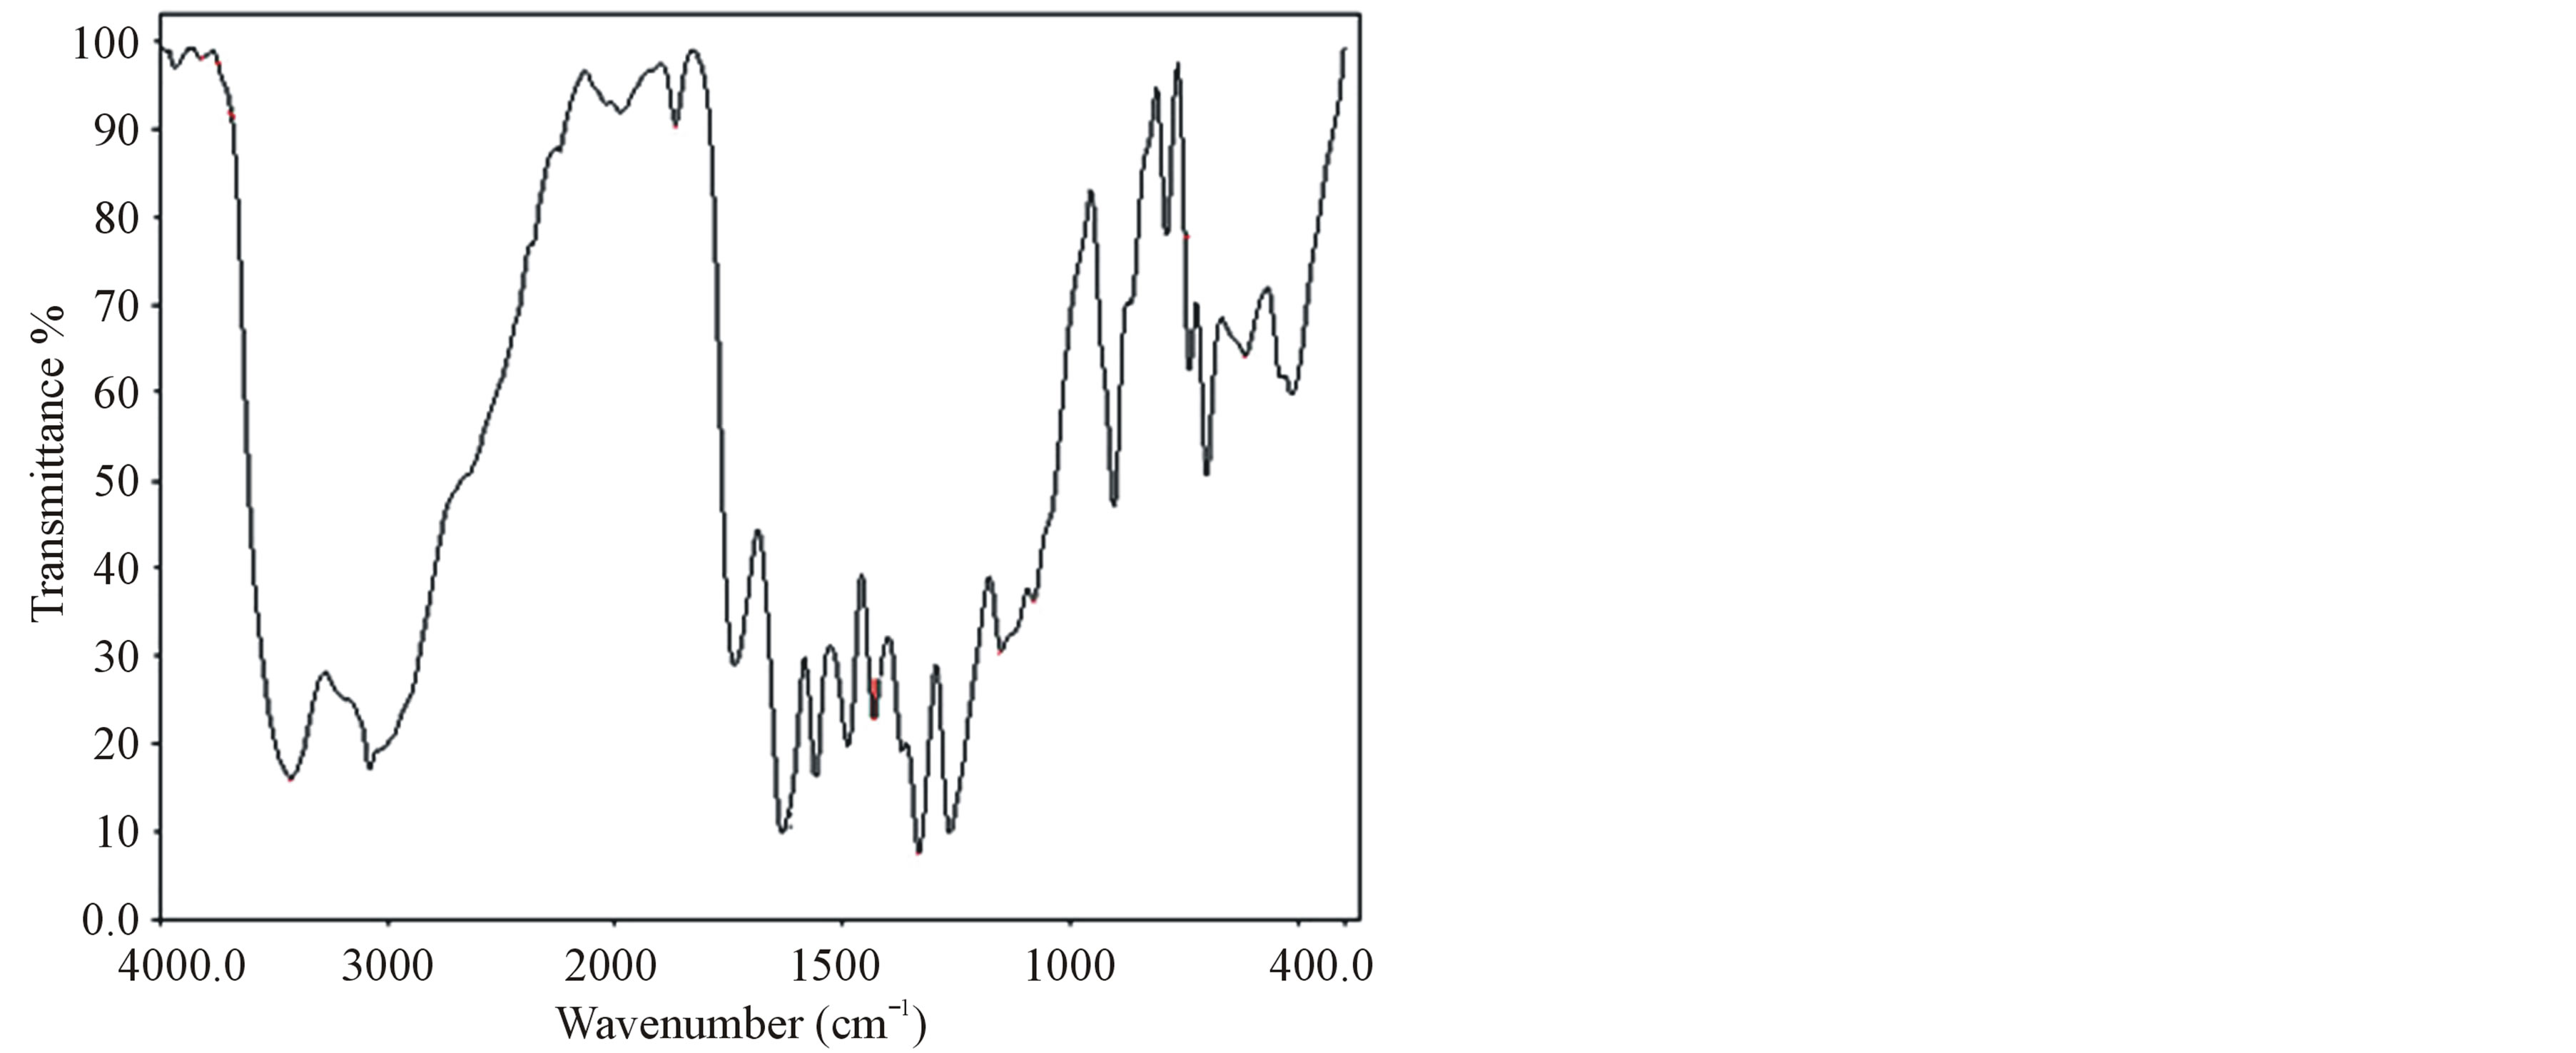 (b)
(b)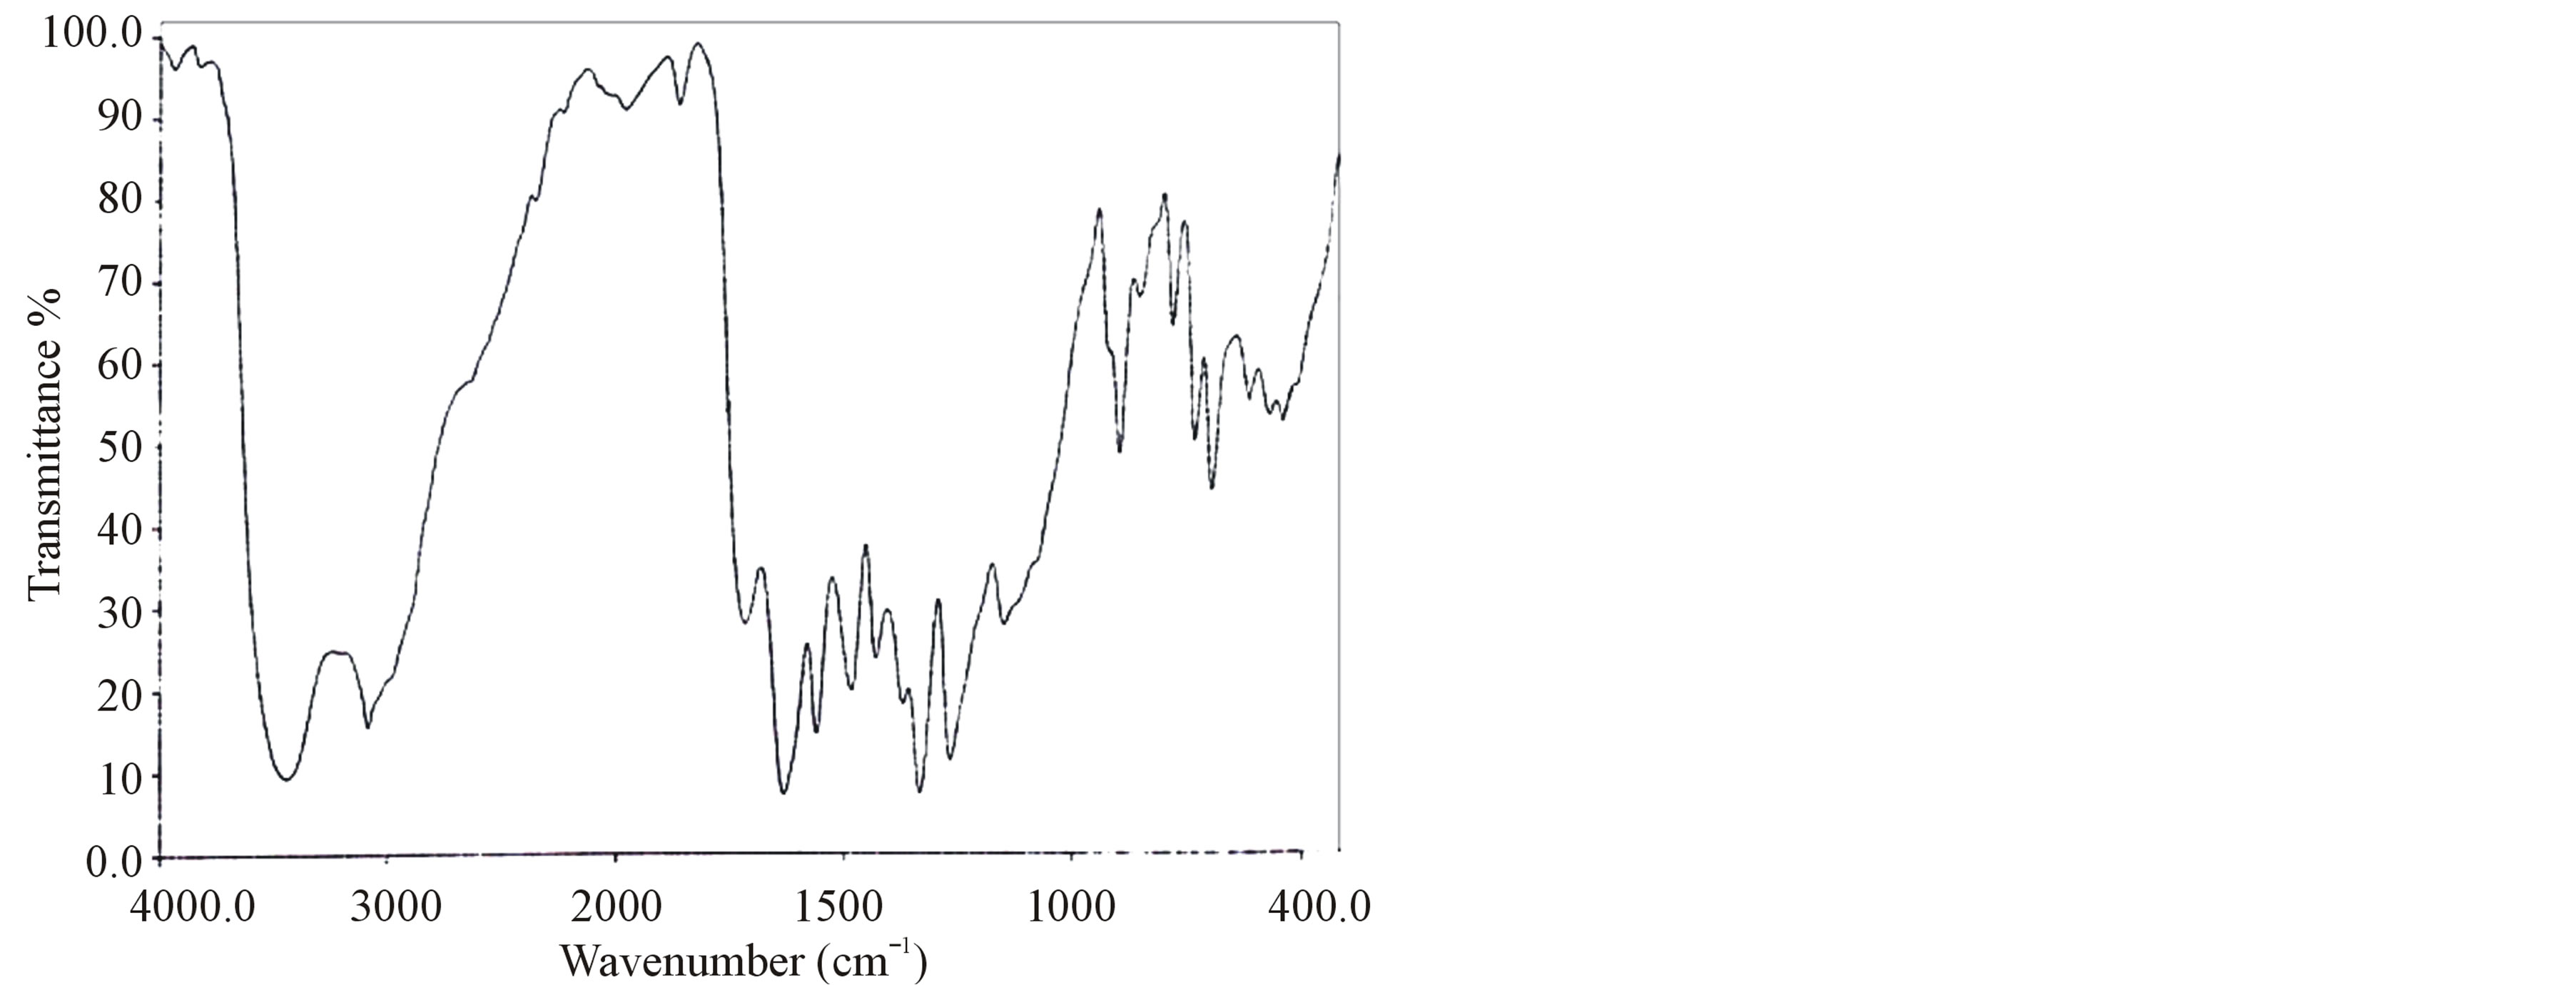 (c)
(c)
Figure 2. (a) FT-IR spectrum of LVP; (b) FT-IR spectrum of 10 GVP; (c) FT-IR spectrum of 50 GVP.
observed around 1153 cm−1 and 906 cm−1 in all the cases. The incorporation of glycine in L-valinium picrate is confirmed by presence of peak at 618 cm−1 in 10 GVP and 620 cm−1 in 50 GVP and it is obtained due to stretching
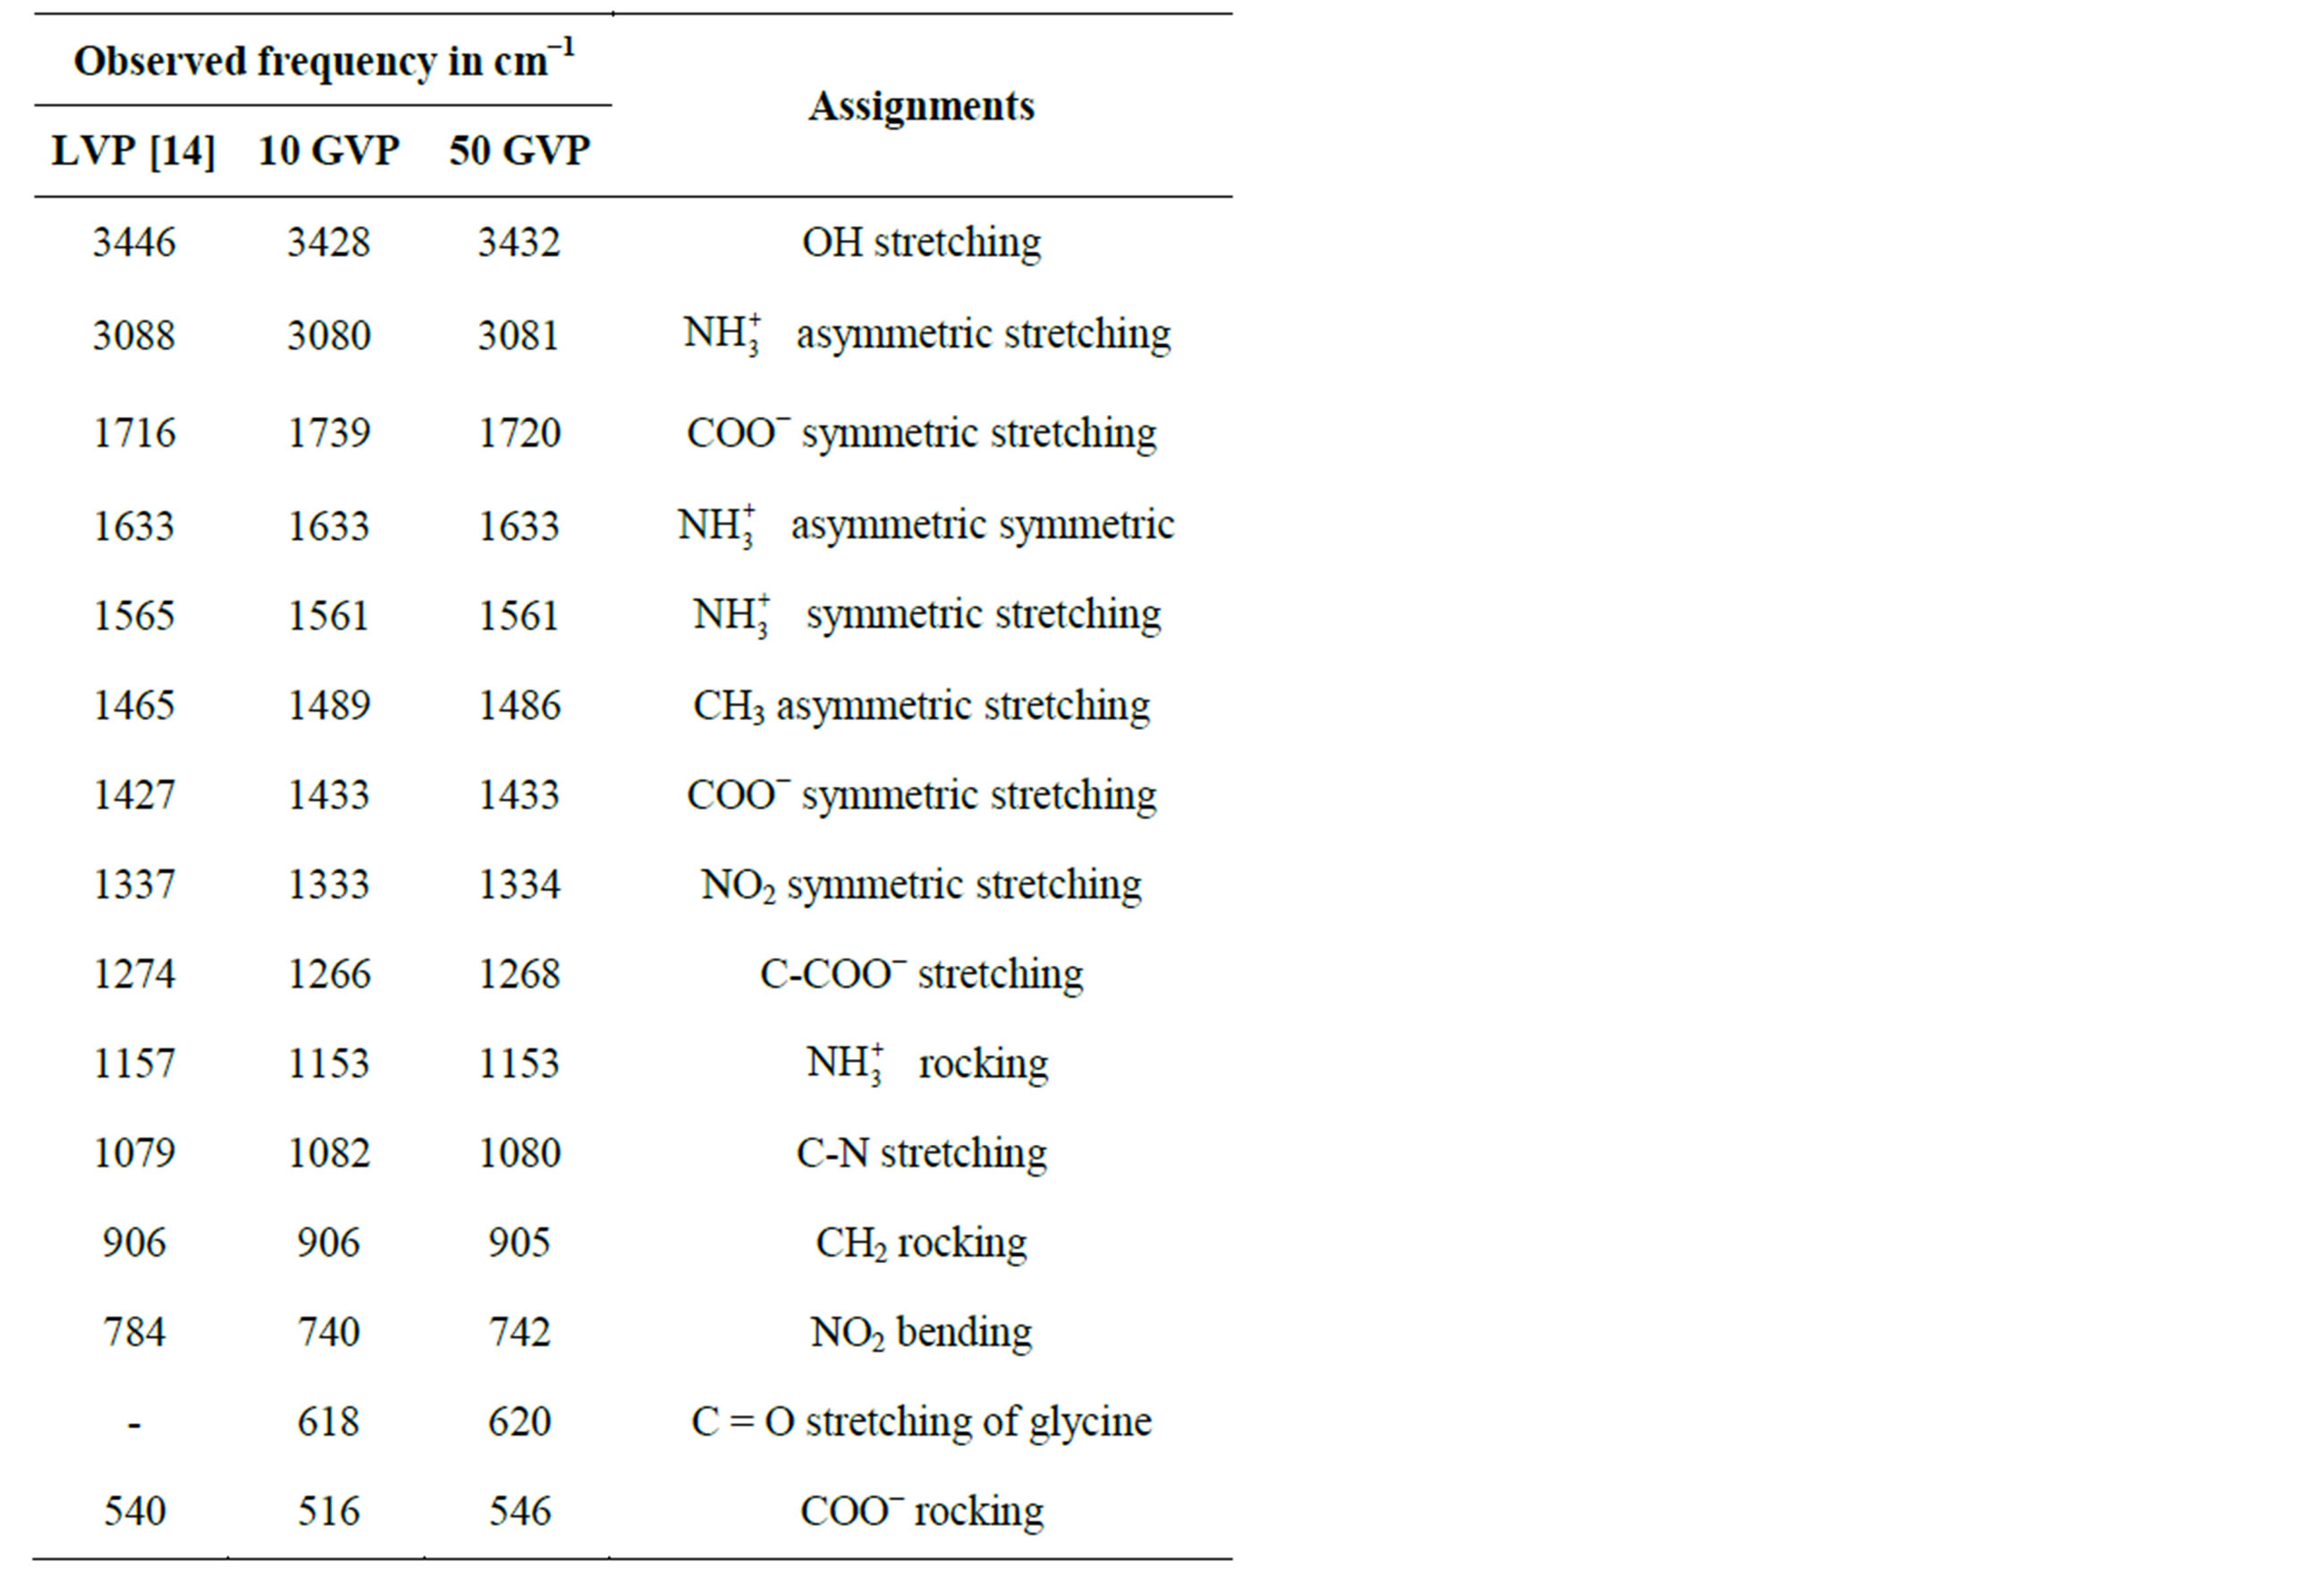
Table 2. FT-IR Spectral data.
of C = O group of glycine. The absorptions of 10 GVP and 50 GVP have been compared with those of parent compound (LVP) and its shows shifts in the position of characteristics peak which confirm the formation of the new compound.
3.4. NMR Studies
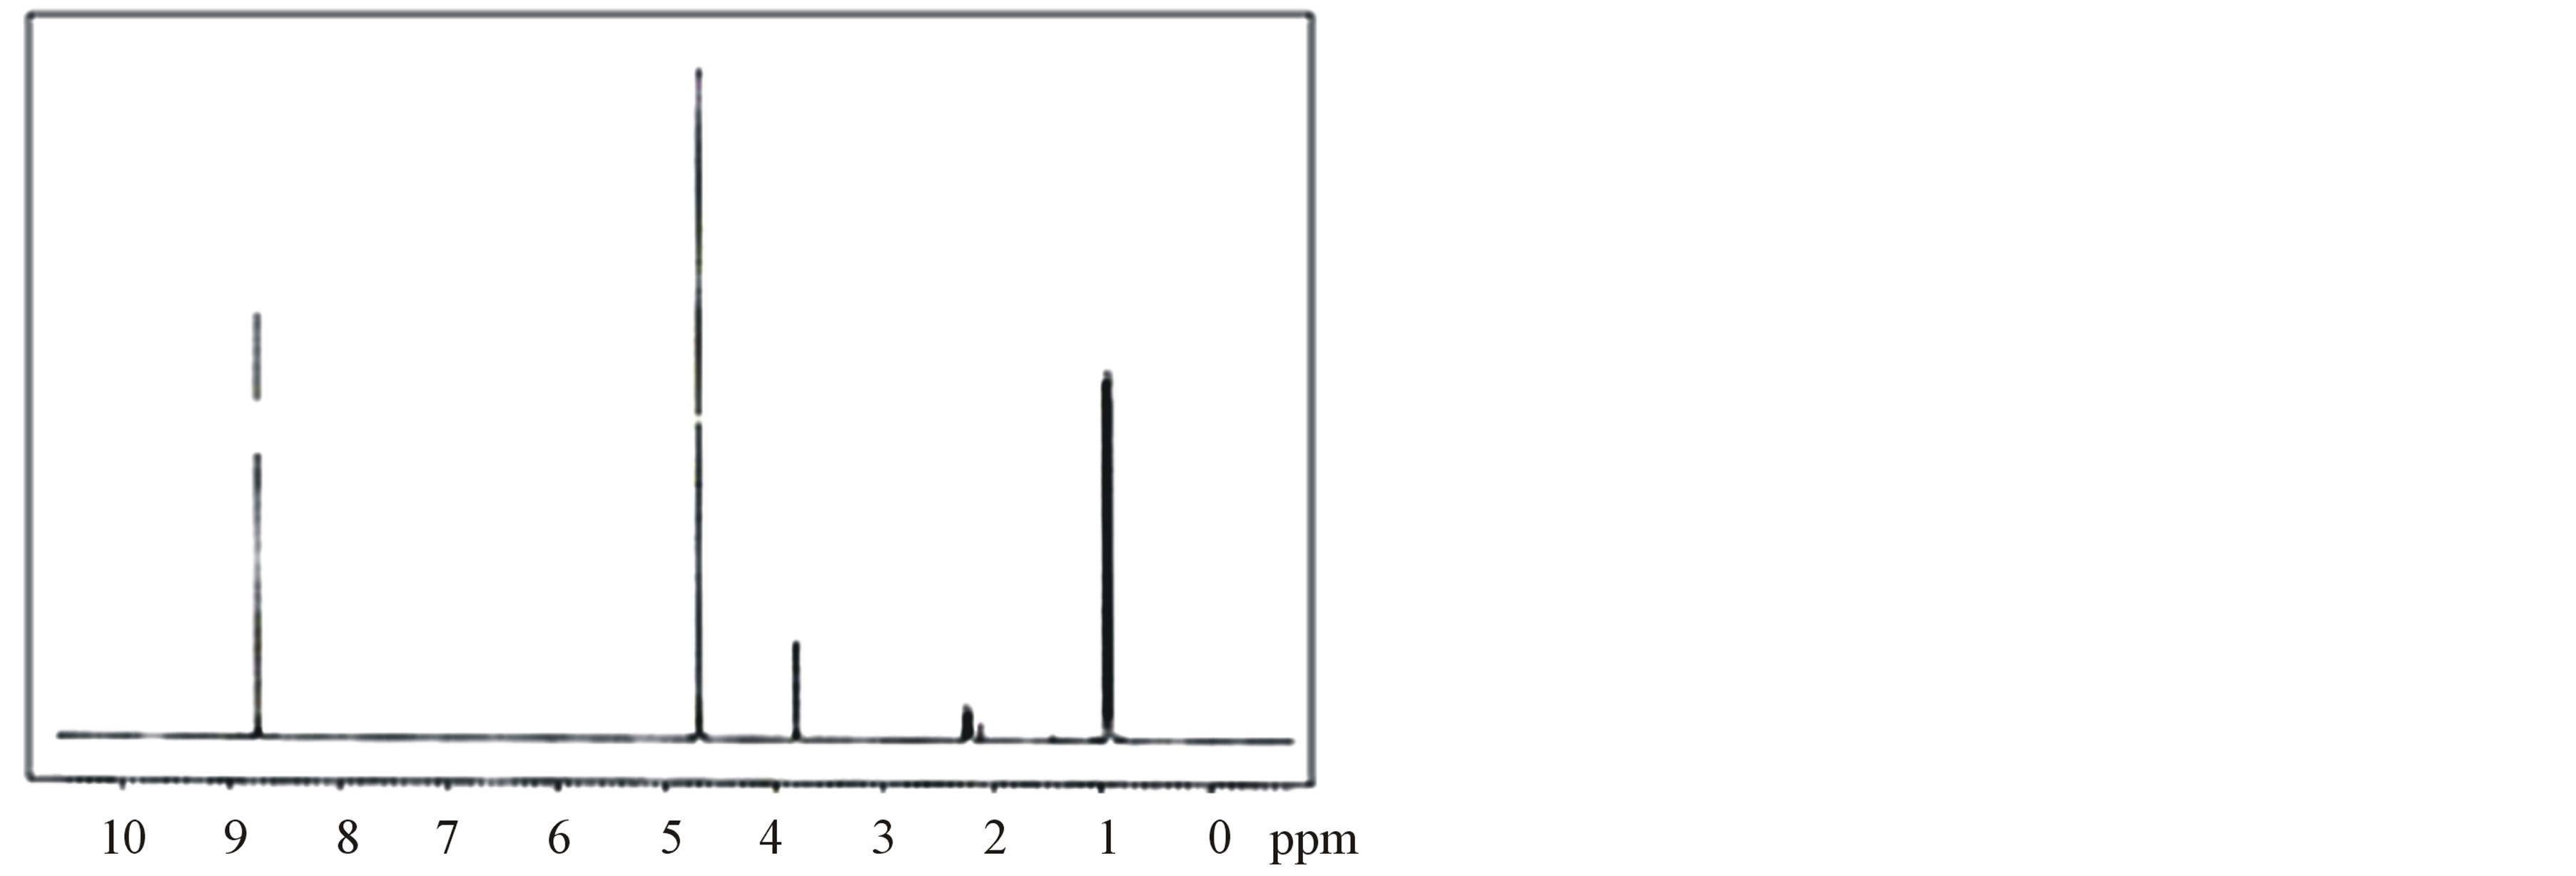
The 1H-NMR and 13C-NMR spectra of LVP, 10 GVP and 50 GVP crystals were recorded using D2O as solvent on a Bruker FT-NMR spectrometer. The spectra were recorded by dissolving the sample in D2O and obtained spectra are shown in the Figures 3 and 4. The chemical shifts for 1H-NMR and 13C-NMR spectrums are represented in δ ppm and are tabulated in the Table 3.
The proton in the glycine and picric acid was assigned with the help of the available literature [17,18]. In 1HNMRspectrum, the OH-proton of picric acid pf LVP, 10 GVP and 50 GVP are observed at δ = 8.75, 8.54 and 8.73 ppm respectively. The same was observed at δ = 11.94 ppm in free picric acid [18,19]. This upfield shift was due to the shielding of OH proton by the Л and n electron of glycine, confirming the charge transfer phenomenon in the compound [20]. The sharp and intense peak at δ = 4.8 ppm was due to the presence of undeuteriated D2O as solvent. The resonance signal observed around d = 3.79 ppm of LVP, d = 3.75 ppm of 10GVP and d = 3.75 ppm of 50 GVP are attributed to CH proton of L-valine next
 (a)
(a)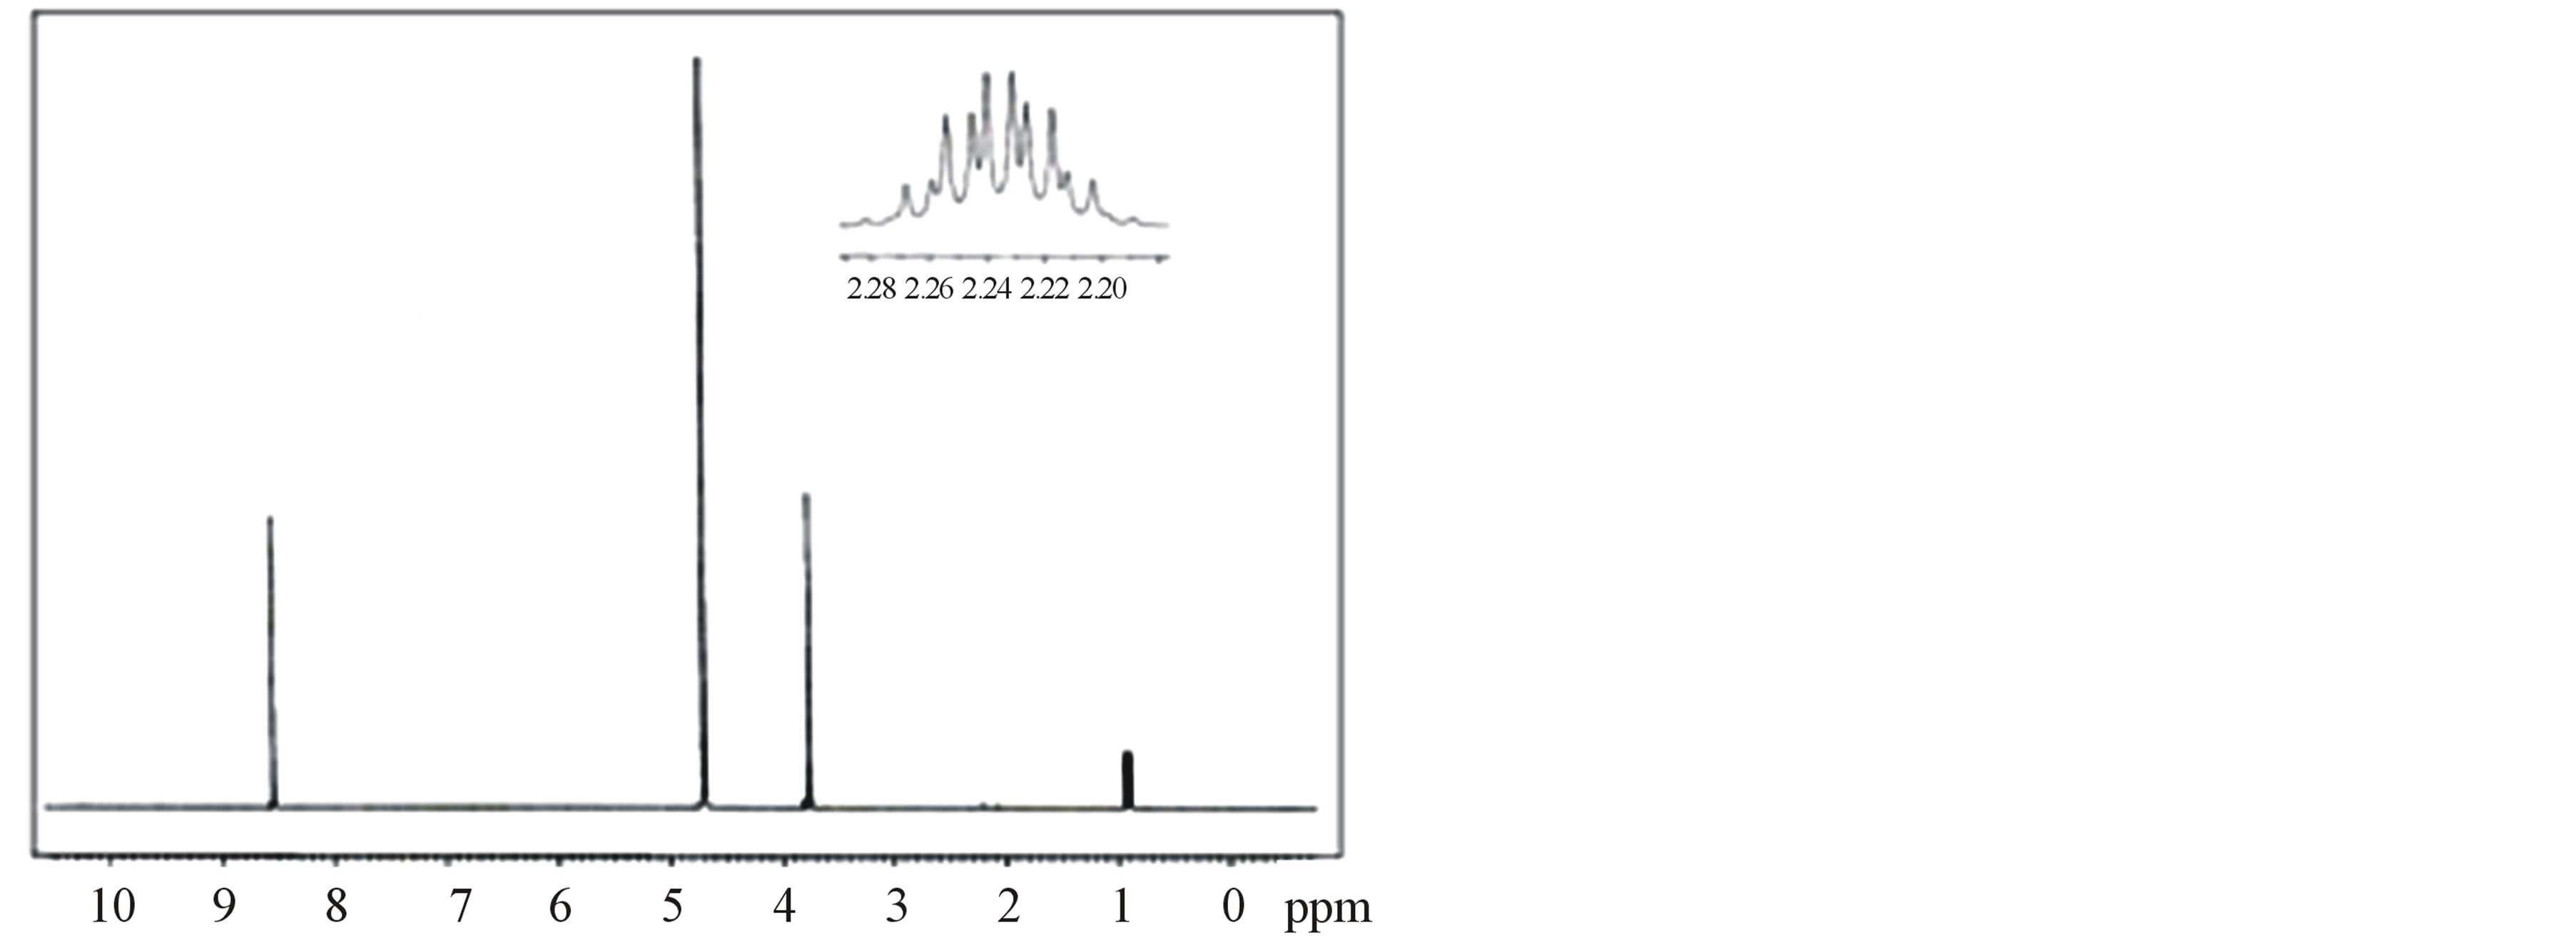 (b)
(b)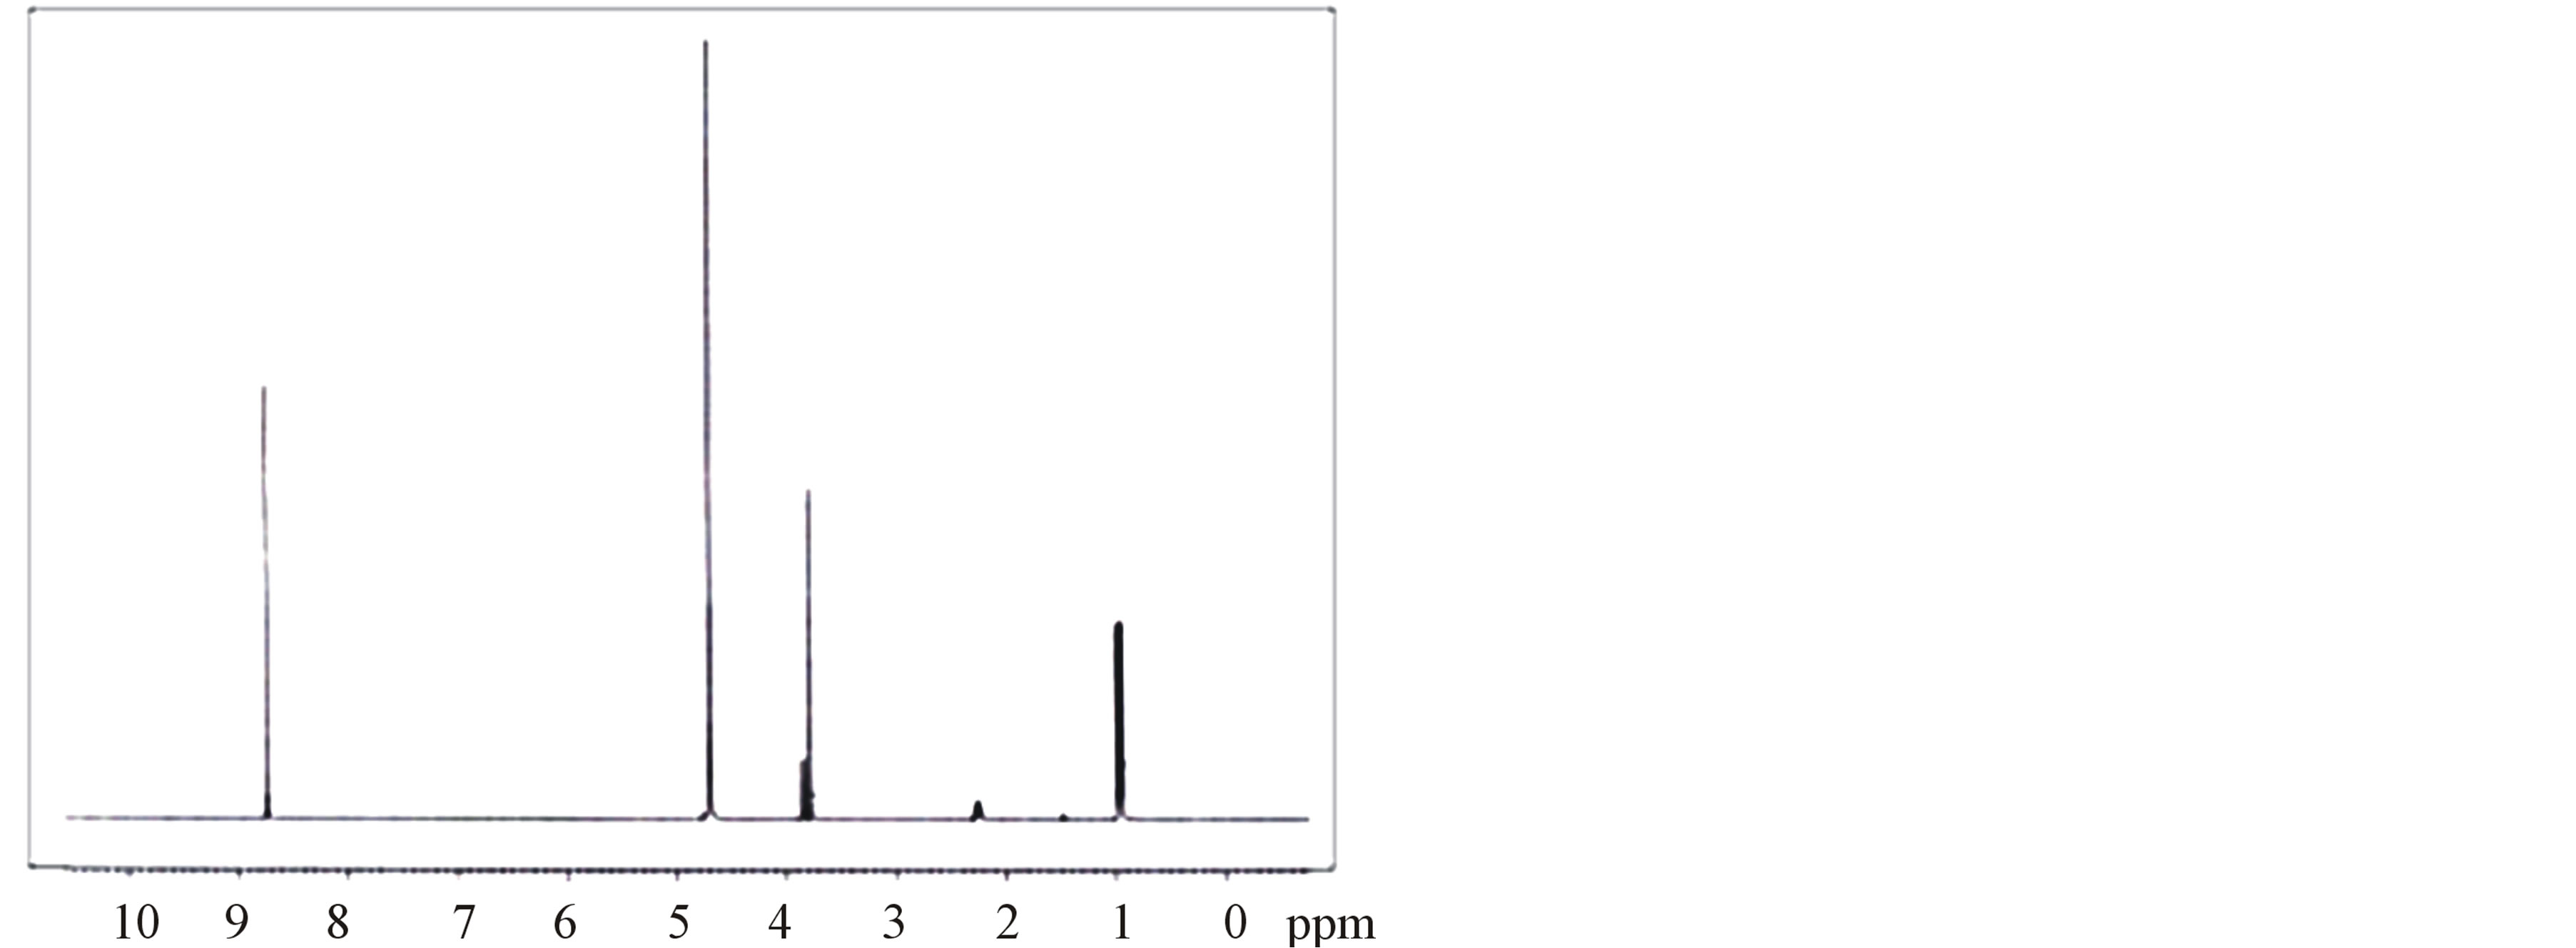 (c)
(c)
Figure 3. (a) 1H-NMR spectrum of LVP; (b) 1H-NMR spectrum of 10 GVP crystal; (c) 1H-NMR spectrum of 50 GVP crystal.
to carboxylic acid [21]. The doublets observed around at d = 0.8 ppm to 0.9 ppm are assigned to the proton of two CH3 group of L-valine in all three crystals. The signal observed at d = 3.85 and 3.83 ppm of 10 GVP and 50 GVP respectively are due to the protons present in the (CH2) group of glycine which indicates that addition of glycine in L-valinium picrate.
 (a)
(a)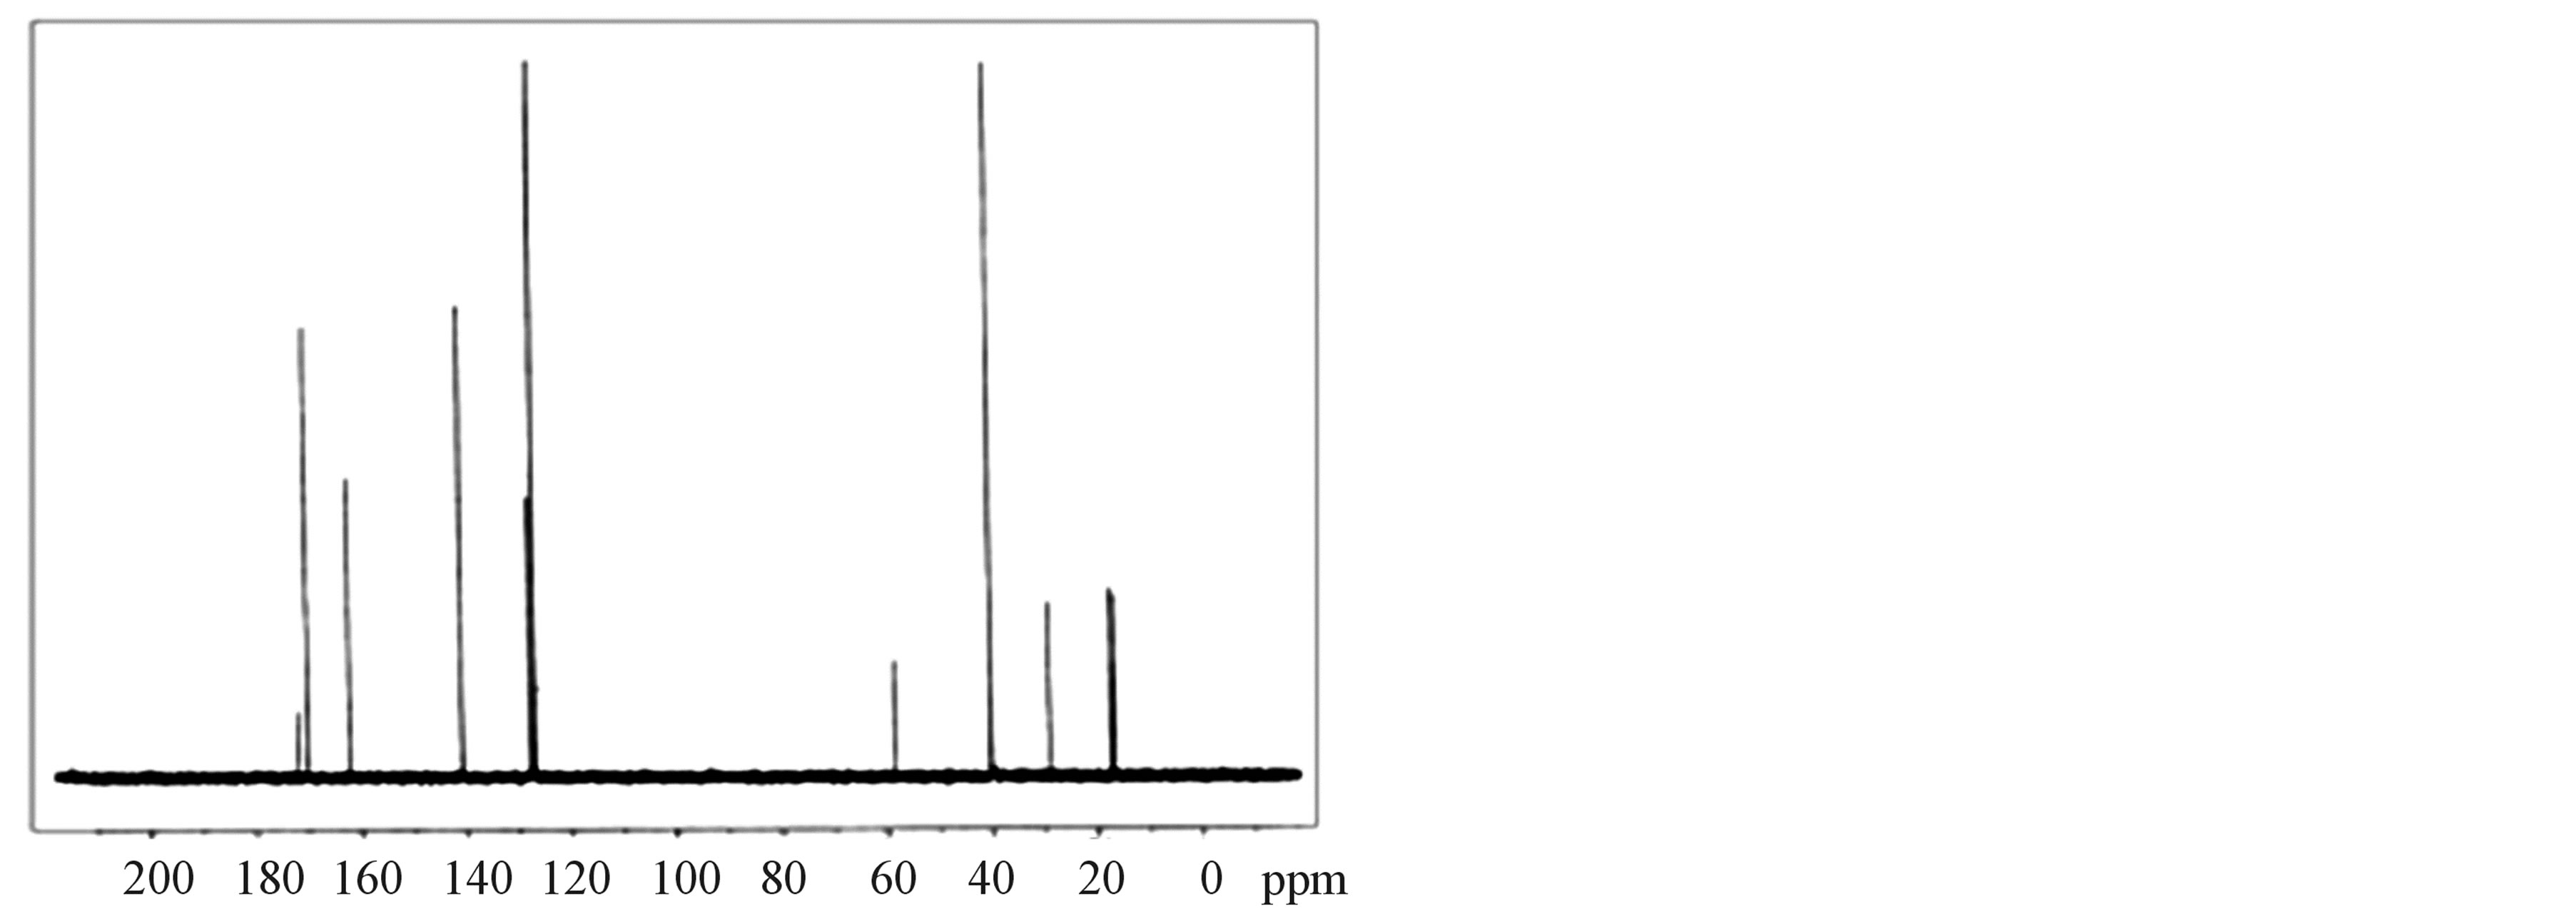 (b)
(b)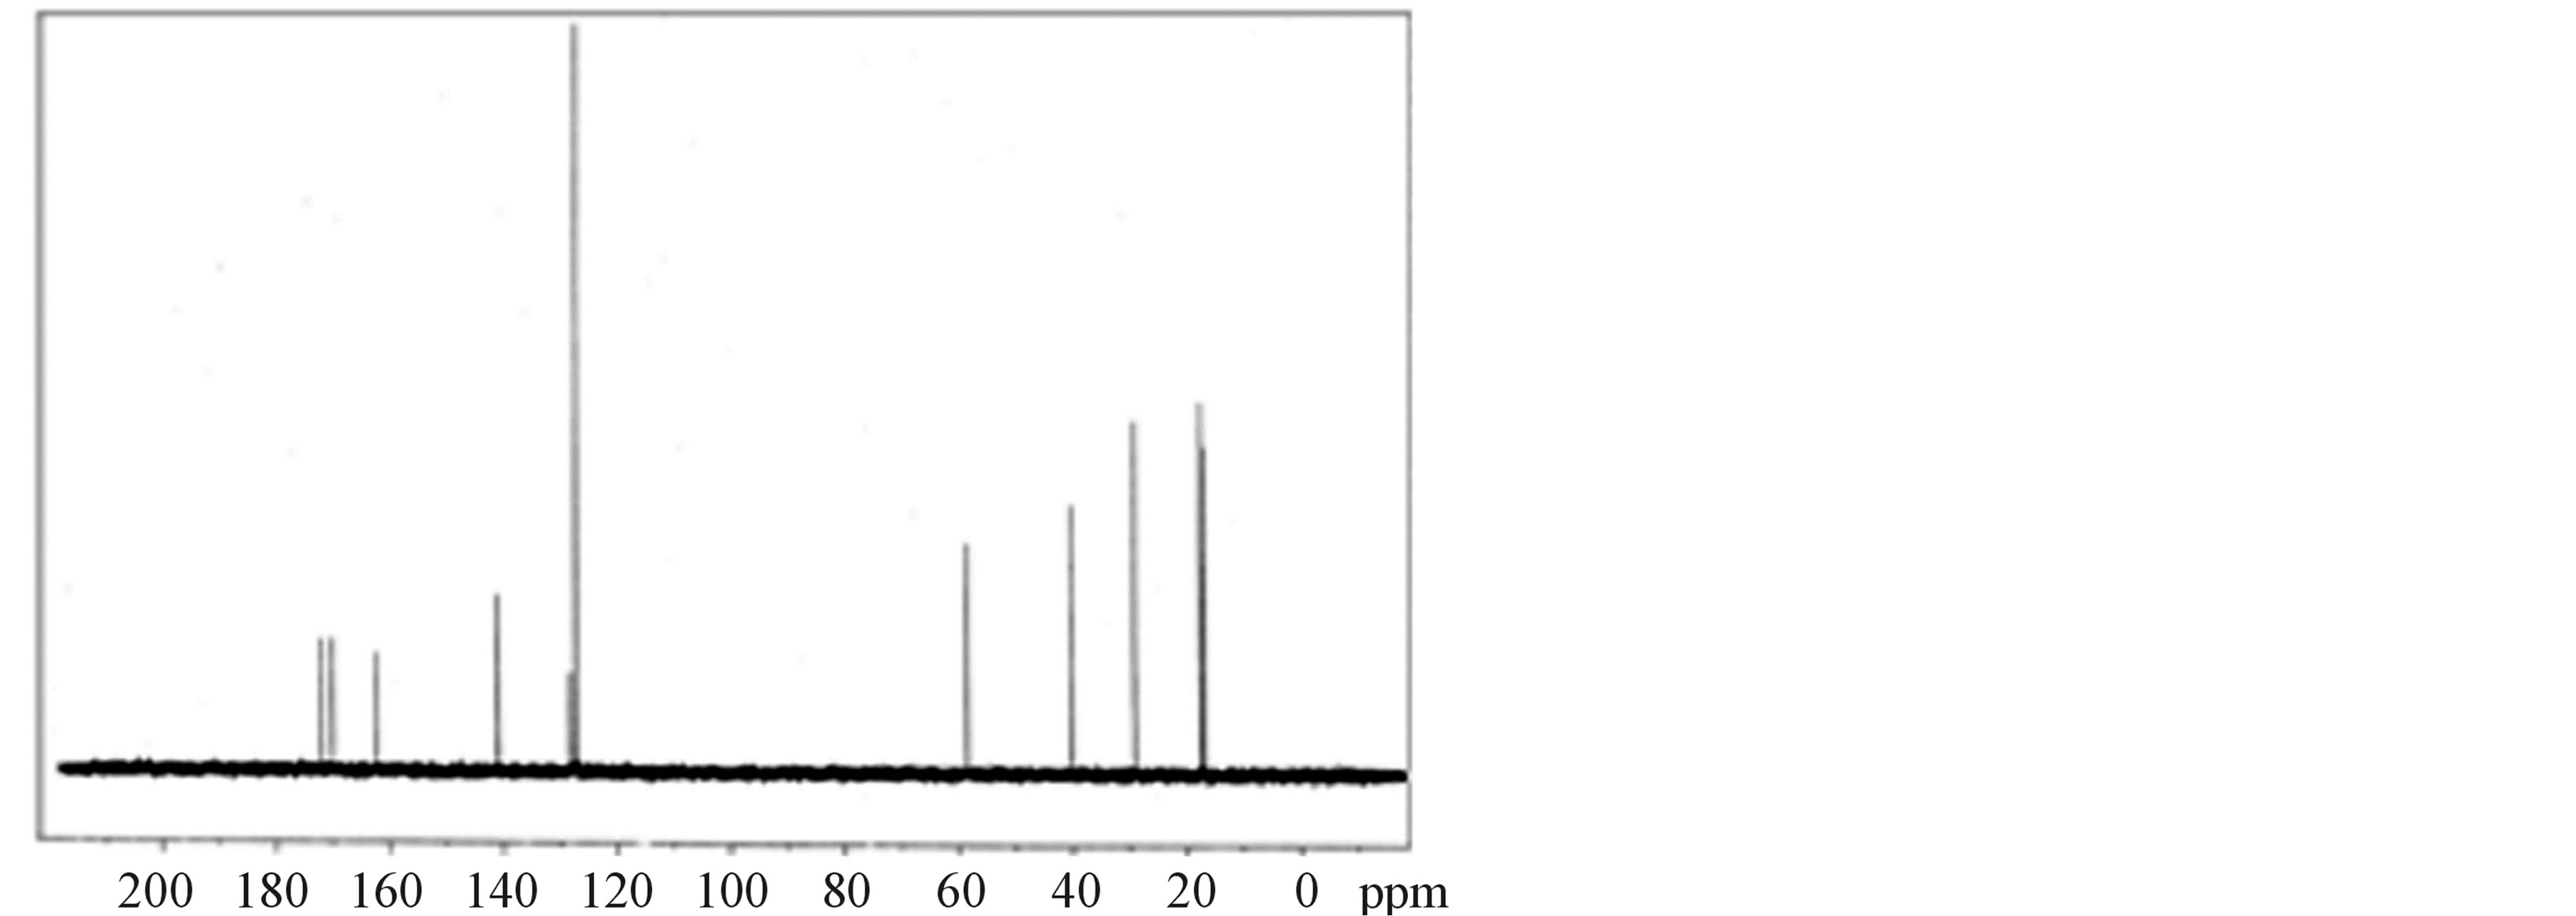 (c)
(c)
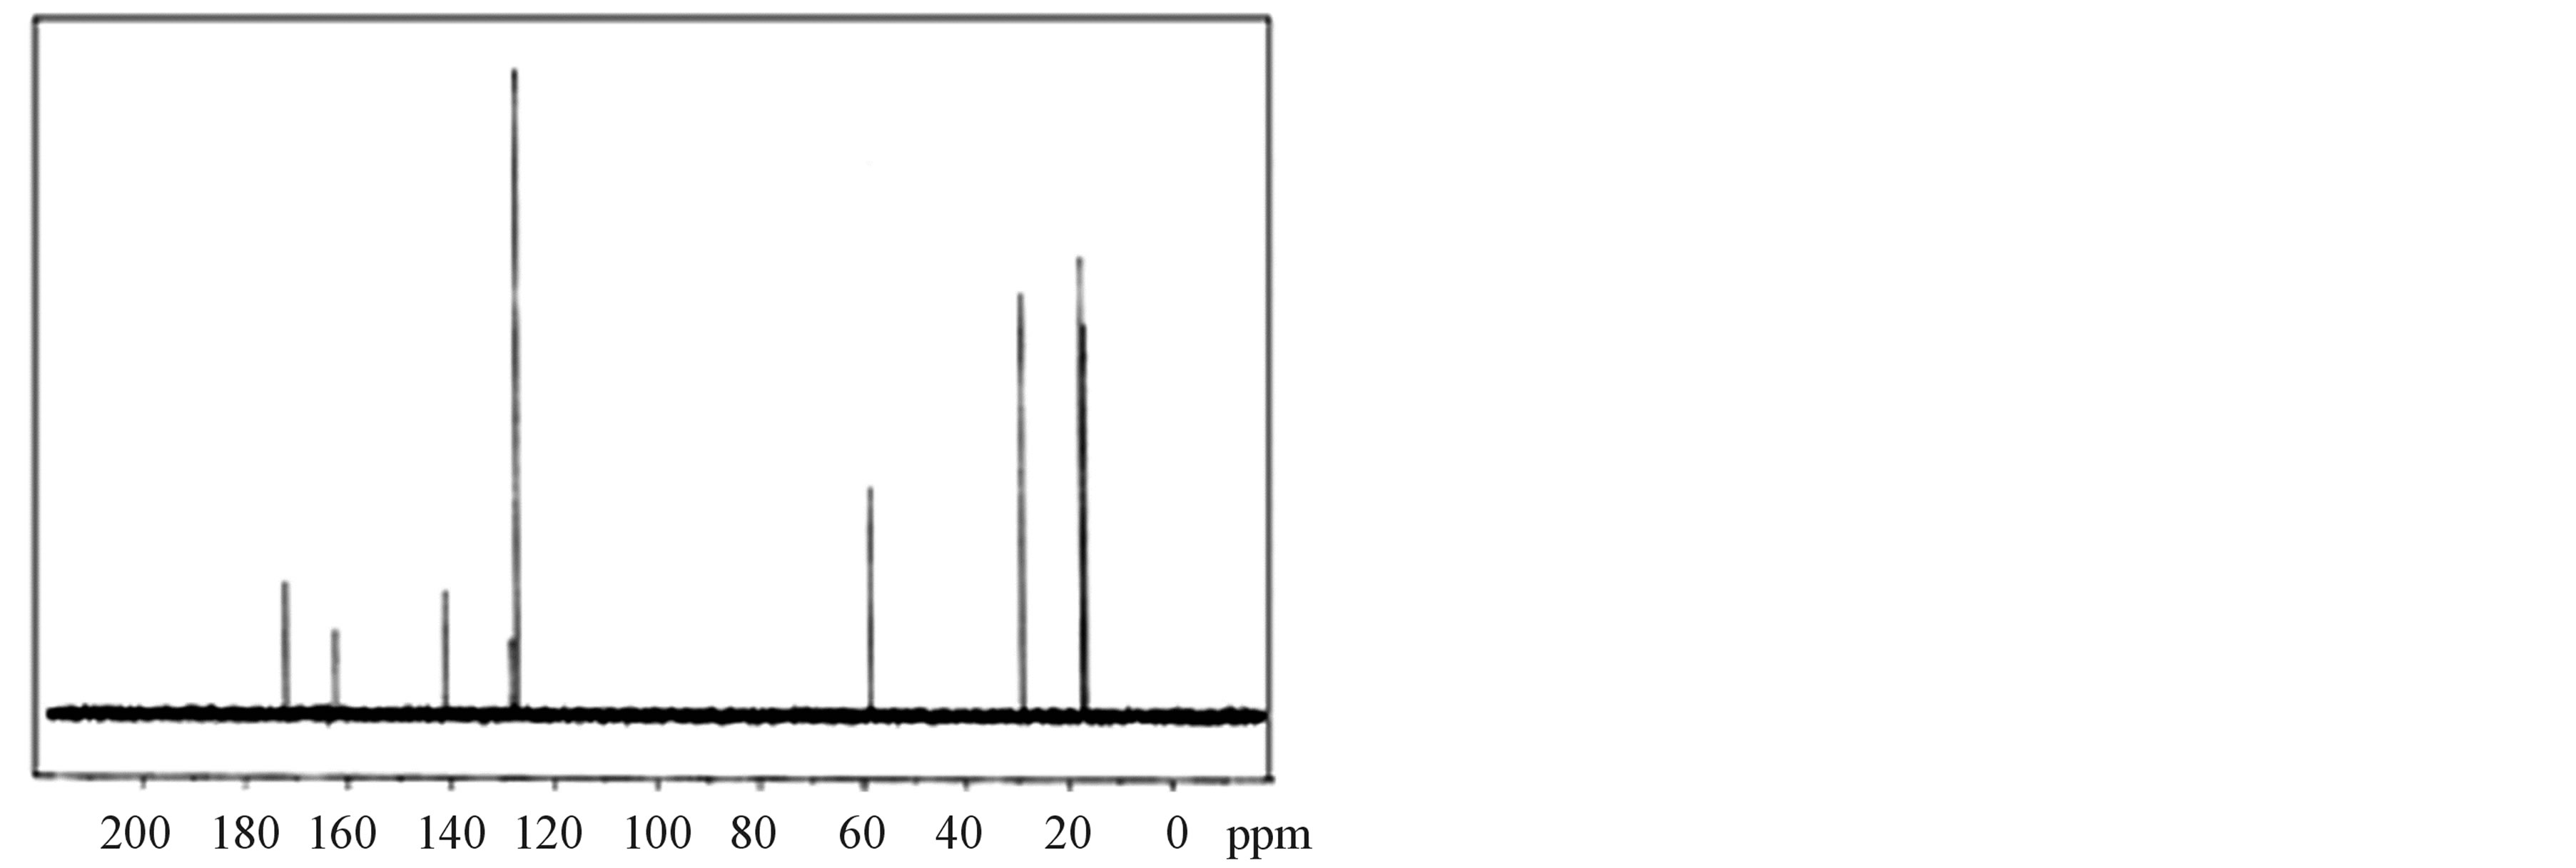
Figure 4. (a) 13C-NMR spectrum of LVP; (b) 13C-NMR spectrum of 10 GVP crystal; (c) 13C-NMR spectrum of 50 GVP crystal.
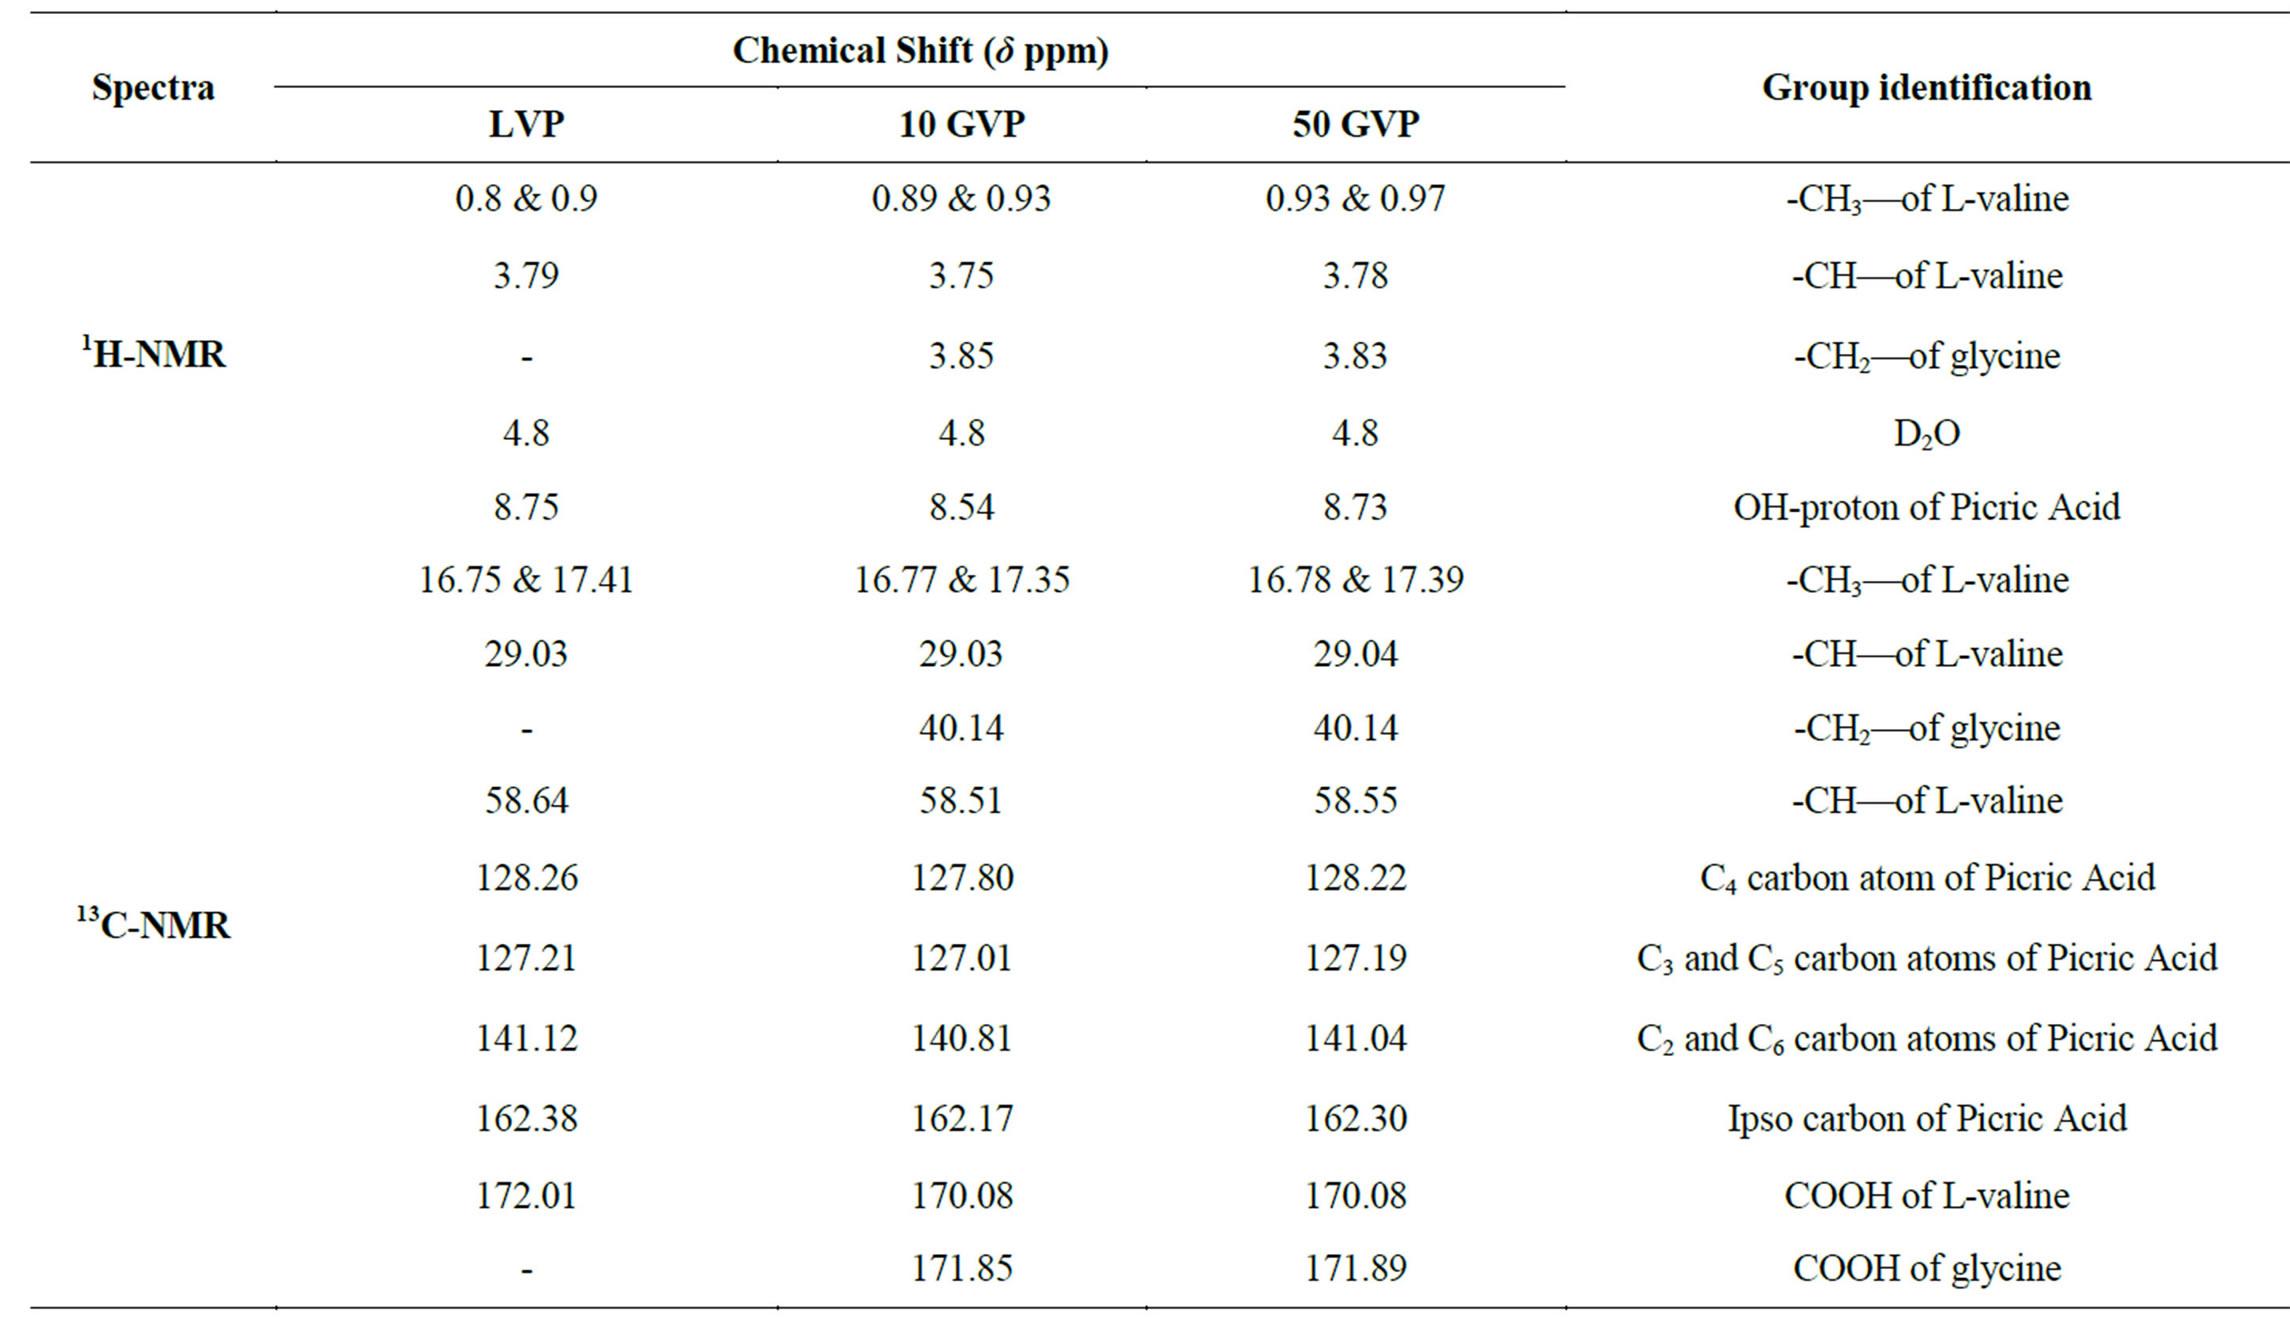
Table 3. 1H and 13C-NMR chemical shift values of LVP.
In 13C-NMR spectrum, the signals observed at δ = 172.01, 170.08 and 170.08 ppm of LVP, 10 GVP and 50 GVP were due to presence of COOH of L-valine. The characteristic peak nearly at δ = 162 ppm of three crystals were attributed to ipso carbon of picric acid. The observed peak arround δ = 141 ppm of three crystals were due to C2 and C6 carbon atom containing NO2 group in picric acid molecule. The signals at δ = 128.26, 127.80 and 128.22 ppm of grown crystals are assigned to C4 carbon atom of picric acid. The peaks at δ = 127.21, 127.01 and 127.19 ppm are assigned to C3 and C5 carbon of picric acid of LVP, 10 GVP and 50 GVP respectively. The resonance signal was observed at δ = 58.64, 58.51 and 58.55 are due to tertiary carbon connected to L-valine. The signal around d = 29.03 ppm represents the CH (isopropyl) groups of L-valine. The CH3 carbons of L-valine are observed nearly between 16 and 17 ppm. The resonance signals at d = 40.14 ppm of 10 GVP and 50 GVP are account for the carbon of the CH2 group in glycine. The peaks at d = 171.85 and 171.89 ppm of 10 GVP and 50 GVP respectively can be safely attributed to carboxyl group (COOH) of glycine.
3.5. SHG Test
The nonlinear optical susceptibility of grown crystals were measured through second harmonic generation test using standard Kurtz and Perry Method [22]. The powdered sample is placed in the path of Nd: YAG laser with pulse width of 8 ns and repetition rate 10 Hz. The intensity of incident power is 2.8 mJ/pulse for LVP, 50 GVP crystals and 3.5 mJ/pulse for 10 GVP crystals. The green color output signal from the sample confirmed the second harmonic generation. The intensity of output light was observed as 1300 mV, 425 mV and 1050 mV for LVP, 10 GVP and 50 GVP crystals respectively.
4. Conclusion
Organic NLO material, L-valinium picrate (LVP), 10 mol% glycine mixed L-valinium picrate (10 GVP) and 50 mol% glycine mixed L-valinium picrate (50 GVP) were grown from aqueous solution in room temperature using slow evaporation technique. The cell parameters were determined by XRD analysis and crystal systems were found. The chemical environment of carbon and hydrogen in grown crystals was identified by FT-NMR technique and it confirmed the presence of dopent in parent crystals. The NLO effect was confirmed by Kurtz and Perry technique.
Acknowledgements
The authors acknowledge the help rendered by St. Joseph’s College, Trichy, India, and SASTRA University, Thanjavur, India for spectral facilities. The corresponding authors are thankful to Central Electro Chemical Research Institute, Karaikudi, India for providing the thermal studies. The authors are grateful to Maduari Kamaraj University, Madurai for XRD studies.
REFERENCES
- D. J. Willams, “Organic Polymeric and Non-Polymeric Materials with Large Optical Nonlinearities,” Angewandte Chemie International Edition in English, Vol. 23, No. 9, 1984, pp. 690-703. http://dx.doi.org/10.1002/anie.198406901
- V. G. Dmitriev, G. G. Gurzadyan, D. N. Nicogosyan, et al., “Hand Book of Nonlinear Optical Crystals,” SpringerVerlag, New York, 1999. http://dx.doi.org/10.1007/978-3-540-46793-9
- P. N. Prasad and D. J. Williams, “Introduction to Nonlinear Optical Effect in Molecules and Polymers,” John Wiley & Sons Inc., Hoboken, 1991.
- D. S. Chemla and J. Zyss, “Nonlinear Optical Properties of Organic Molecules and Crystals,” Academic Press, New York, 1987.
- M. N. Bhat and S. M. Dharmaprakash, “New Nonlinear Optical Material: Glycine Sodium Nitrate,” Journal of Crystal Growth, Vol. 235, No. 1-4, 2002, pp. 511-516. http://dx.doi.org/10.1016/S0022-0248(01)01799-7
- C. R. Raja and A. A. Joseph, “Crystal Growth and Characterization of New Nonlinear Optical Single Crystals of L-Alaninium Fumarate,” Materials Letters, Vol. 63, No. 28, 2009, pp. 2507-2509. http://dx.doi.org/10.1016/j.matlet.2009.08.046
- C. R. Raja and A. A. Joseph, “Crystal Growth and Comparative Studies of XRD, Spectral Studies on New NLO Crystals: L-Valine and L-Valinium Succinate,” Spectrochima Acta A, Vol. 74, No. 3, 2009, pp. 825-828. http://dx.doi.org/10.1016/j.saa.2009.08.023
- C. R. Raja, G. Gokila and A. A. Joseph, “Growth and Spectroscopic Characterization of a New Organic Nonlinear Optical Crystal: L-Alaninium Succinate,” Spectrochima Acta A, Vol. 72, No. 4, 2009, pp. 753-756. http://dx.doi.org/10.1016/j.saa.2008.11.030
- S. A. Martin Britto Dhas and S. Natarajan, “Growth and Characterization of a New Potential Second Harmonic Generation Material from the Amino Acid Family: L-Valinium Picrate,” Crystal Research and Technology, Vol. 43, No. 8, 2008, pp. 869-873. http://dx.doi.org/10.1002/crat.200711152
- P. Srinivasan, T. Kanagasekaran and R. Gopalakrishnan, “A Highly Efficient Organic Nonlinear Optical Donor— Acceptor Single Crystal: l-Valinium Picrate,” Crystal Growth & Design, Vol. 8, No. 7, 2008, pp. 2340-2345. http://dx.doi.org/10.1021/cg701143n
- S. Senthilkumar, M. B. Mary and V. Ramakrishnan, “Infrared and Raman Spectroscopic Studies of L-Valinium Picrate,” Journal of Raman Spectroscopy, Vol. 38, No. 3, 2007, pp. 288-294. http://dx.doi.org/10.1002/jrs.1641
- K. Anitha, B. Sridhar and K. K. Rajaram, “L-Valinium Picrate,” Acta Cryst., Vol. E60, 2004, pp. o1530-o1532. http://dx.doi.org/10.1107/S160053680401949X
- A. A. Joseph, I. J. D. Ebenezar and C. R. Raja, “Crystal Growth, Spectral and NMR Studies of Nonlinear Optical Crystal: L-Valinium Picrate,” Optik—International Journal for Light and Electron Optics, Vol. 123, No. 16, 2012, pp. 1436-1439. http://dx.doi.org/10.1016/j.ijleo.2011.07.064
- A. A. Joseph, I. J. D. Ebenezar and C. R. Raja, “Spectroscopic Studies on the Influence of 10 mol% of Glycine on Nonlinear Optical Crystal l-Valinium Picrate,” Spectrochima Acta A, Vol. 82, No. 1, 2011, pp. 410-413. http://dx.doi.org/10.1016/j.saa.2011.07.071
- R. Mahalakshmi, S. X. Jesuraja and S. Jerome Das, “Growth and Characterization of L-Phenylalanine,” Crystal Research and Technology, Vol. 41, No. 8, 2006, pp. 780-783. http://dx.doi.org/10.1002/crat.200510668
- K. Kirubavathi, K. Selvaraju, N. Vijayan and S. Kumararaman, “Synthesis Growth and Characterization of L-Valinium Picrate a New Nonlinear Optical Crystal,” Spectrochimica Acta A, Vol. 71, No. 1, 2008, pp. 288-291. http://dx.doi.org/10.1016/j.saa.2008.02.028
- A. Chandramohan, R. Bharathikannan, M. A. Kandasawamy, J. Chandrasekaran and V. Kandavelu, “Synthesis, Crystal Growth, Spectral, Thermal and Optical Properties of Acenaphthene Picrate,” Crystal Research and Technology, Vol. 43, No. 1, 2007, pp. 93-98. http://dx.doi.org/10.1002/crat.200710949
- R. Bharathikannan, A. Chandramohan, M. A. Kandasawamy, J. Chandrasekaran, R. Renganathan and V. Kandavelu, “Synthesis, Crystal Growth and Properties of the Charge Transfer Complex Adduct of 2-Nitro Aniline with Picric Acid—An Organic Non-Linear Optical Material,” Crystal Research and Technology, Vol. 43, No. 6, 2008, pp. 683-688. http://dx.doi.org/10.1002/crat.200711114
- S. M. Teleb and A. S. Gaballa, “Preparation and Spectroscopic Studies on Charge-Transfer Complexes of 2,2′- Bipyridine with Picric and Chloranilic Acids,” Spectrochimica Acta A, Vol. 62, No. 1-3, 2005, pp. 140-145. http://dx.doi.org/10.1016/j.saa.2004.12.017
- V. R. Dani, “Organic Spectroscopy,” Tata Mcgraw-Hill, New Delhi, 1995.
- P. Y. Brice, “Organic Chemistry,” Pearson Edition (Singapore), New Delhi, 2002.
- S. K. Kurtz and T. T. Perry, “A Powder Technique for the Evaluation of Nonlinear Optical Materials,” Journal of Applied Physics, Vol. 39, No. 8, 1968, p. 3798. http://dx.doi.org/10.1063/1.1656857
NOTES
*Corresponding author.