Food and Nutrition Sciences
Vol.4 No.10A(2013), Article ID:36820,7 pages DOI:10.4236/fns.2013.410A002
Food Perceptions among Adults and Registered Dietitians: Are They Similar?
![]()
1Department of Food Science and Nutrition, Institute of Nutrition and Functional Foods, Laval University, Québec, Canada; 2Health and Social Services Ministry, Government of Quebec, Québec, Canada; 3Department of Social and Preventive Medicine, University of Montreal, Montreal, Canada.
Email: veronique.provencher@fsaa.ulaval.ca
Copyright © 2013 Kathleen Cloutier et al. This is an open access article distributed under the Creative Commons Attribution License, which permits unrestricted use, distribution, and reproduction in any medium, provided the original work is properly cited.
Received June 11th, 2013; revised July 11th, 2013; accepted July 18th, 2013
Keywords: Food; Perception; Frequency; Dietitian
ABSTRACT
Purpose: To determine how adults and registered dietitians (RDs) perceived foods according to a frequency continuum, and to assess the differences between them. Methods: A sample of 1002 adults and 566 RDs were recruited. Participants had to associate 51 foods with a frequency continuum (“daily”, “occasional” or “sometimes”). Food groups were created: 1) Canada’s Food Guide’s groups (CFG) (n = 22), 2) High in Fat or High in Sugar foods (HFHS) (n = 16), and 3) Meals (n = 13). Results: CFG were perceived as “daily” foods (adults = 56.8%, RDs = 94.5%), HFHS as “sometimes” foods (adults = 67.2%, RDs = 59.6%) and Meals as “occasional” foods (adults = 75.8%, RDs = 58.2%). Adults (all age groups) perceived that CFG and Meals should be eaten less frequently than RDs (18 to 64 years old). Younger adults perceived these two groups as to be eaten more frequently than older respondents. Adults perceived HFHS as to be consumed less frequently than RDs (no age effect). Conclusions: While adults tend to have more severe perceptions than RDs, results show that their food perceptions are in line with an overall awareness of Canadian nutrition guidelines, suggesting the presence of a relevant popular knowledge about the value of food.
1. Introduction
Since research has not yet demonstrated the link between only one food item and overall health [1,2], healthy eating should be defined both by food characteristics and by overall eating habits of individuals [3]. Social relationships, physical well-being, past experiences and environments can also influence individuals’ definition of healthy eating, and “healthy foods” could be translated in various ways among adults [4]. Healthy eating is not a black and white concept as it goes far beyond the biological and nutritional factors that are often cited, supporting the inclusion of both individual and environmental factors in its definition [2,4,5]. A better knowledge of the perceptions of the population about foods (i.e., individuals’ judgements regarding various type of foods) could help to clarify our definition of healthy eating.
Given the large amount of information disseminated about diet and health-related risks, some individuals are confused about how to make healthier choices according to nutritional values of foods [6]. They may overcome this difficulty by tending to embrace a dichotomized way of perceiving food according to its health-related characteristics [7,8]. “Good” or “bad” foods and “healthy” and “unhealthy” foods are commonly used terms. This dichotomized way of thinking may lead to misperceptions about actual nutritional content of foods [9] and promote stereotypes [8]. Moreover, since a large amount of money is invested in advertising low-nutrient foods by the industry, it is possible that their views reach consumers more efficiently than those of governmental organizations, and may influence food perceptions [10].
Food perceptions should also be examined with regards to healthy eating [11]. One study has addressed this issue among nutrition professionals by asking them to categorize the healthiness of 40 food items (described with detailed nutritional values) on a 6-point scale [12]. This study showed that their average food perceptions were in line with the nutritional recommendations, but that nutritional value of foods only explaining 50% of the variance [12]. Even among nutrition professionals, other factors than nutritional information are influencing perceptions. However, less is known about food perceptions among adults, who should demonstrate lower nutritional knowledge and abilities in evaluating food products than nutrition professionals.
Considering the dichotomized way of thinking observed among the population, which do not solely lay on actual nutritional content of foods, as well as the important role that advertising may play in shaping views about foods, it appears to be relevant to further examine adults’ perceptions. The aim of this study is therefore to determine how adults and registered dietitians (RDs) spontaneously perceived foods’ frequency consumption from a healthy eating perspective. The specific objectives are: 1) to determine adults and RDs’ perceptions of different food groups based on their nutritional value, and 2) to assess differences between their perceptions for each group. The third objective is to assess if group’s perceptions differ between adults and RDs, and according to age. The hypothesis is that, while food perceptions of adults and RDs will be in line with nutritional guidelines, adults will be more severe in their global perceptions of all foods groups than RDs.
2. Methods
2.1. Context of the Study
Prior to this study, the Health and Social Services Ministry of Québec (MSSS) has developed a Vision for Healthy Eating, which is a public health nutrition strategy to support the creation of healthier food environments [13]. According to this Vision, a healthy diet includes a wide variety of foods, for which their nutritional values vary on a continuum from low to high nutritional value. In parallel, a food frequency continuum varies from daily to sometimes. Those two continuums are complementary to each other. High nutritious food should be present on a regular basis while low nutrient food should be offered less frequently and in smaller amount. This study was conducted to validate this food frequency continuum by verifying its understanding by the population.
2.2. Participants
A sample of adults and RDs were recruited in 2009. To be eligible, the adults had to be over 18 years old, live in the province of Quebec and be able to complete a phone interview in French or in English. RDs had to be members of the Ordre professionnel des Diététistes du Qué- bec (OPDQ) and had completed a degree and internships related to Nutrition and Dietetics. RDs needed to have an active email address to take part in the study, as they had to complete the survey online.
2.3. Procedures
The MSSS created a survey on food perceptions, and mandated SOM [14] to conduct the survey. Its development involved two pilot studies (n = 10 and n = 32 participants, respectively). Adults were randomly reached by phone to participate in this study. A weighting was made to obtain a representative sample of the Quebec population regarding age, sex, maternal language and location. The mean duration of the interview was 14.5 minutes. Participation rate for adults was 33.5%, for a total n of 1002 participants. RDs were invited to participate in this study by email. No ponderation was done with regards to representativity as the main criteria for this sample was to be a RD. Participation rate for RDs was 25.7%, for a total n of 566 participants.
This study was conducted according to the SOM’s guidelines based on the Canadian Privacy Act [15]. The interviewer seeks the respondent’s consent after he/she has been introduced and has explained the purpose of the survey. Verbal informed consent was obtained from all participants, which was witnessed and formally recorded. All databases were anonymized (i.e. purged of information that could identify an individual) by SOM before they were returned to our research team.
2.4. Measurements
Participants had to spontaneously associate 51 foods to a frequency of consumption based on daily, occasional or sometimes episodes of eating. The following question was used to collect participant’s perception of each food item: “According to you, in a healthy eating perspective, what should be the frequency of consumption of this following food?” Only common foods eaten by the population of Quebec were included to ensure that each food item was well-known by all participants (Table 1). Participants were not informed of the nutritional value of the food items. At the end of the survey, sex, age, maternal language and ethnicity were collected.
2.5. Statistical Analysis
A score was attributed to each food item according to the frequency of consumption selected by the participant: “daily” = 1 point, “occasional” = 2 points and “sometimes” = 3 points. To compare perceptions, different food groups were created (Table 1) and a mean food frequency score for each group was calculated.
A mean score ranging from 1 to 1.66 corresponds to a “daily” food, from 1.67 to 2.33 to an “occasional” food, and from 2.34 to 3 to a “sometimes” food. An initial grouping was done for each food items related to the Canada’s Food Guide (CFG) as well as for high in fat and/or high in sugar (HFHS) foods. Another group was
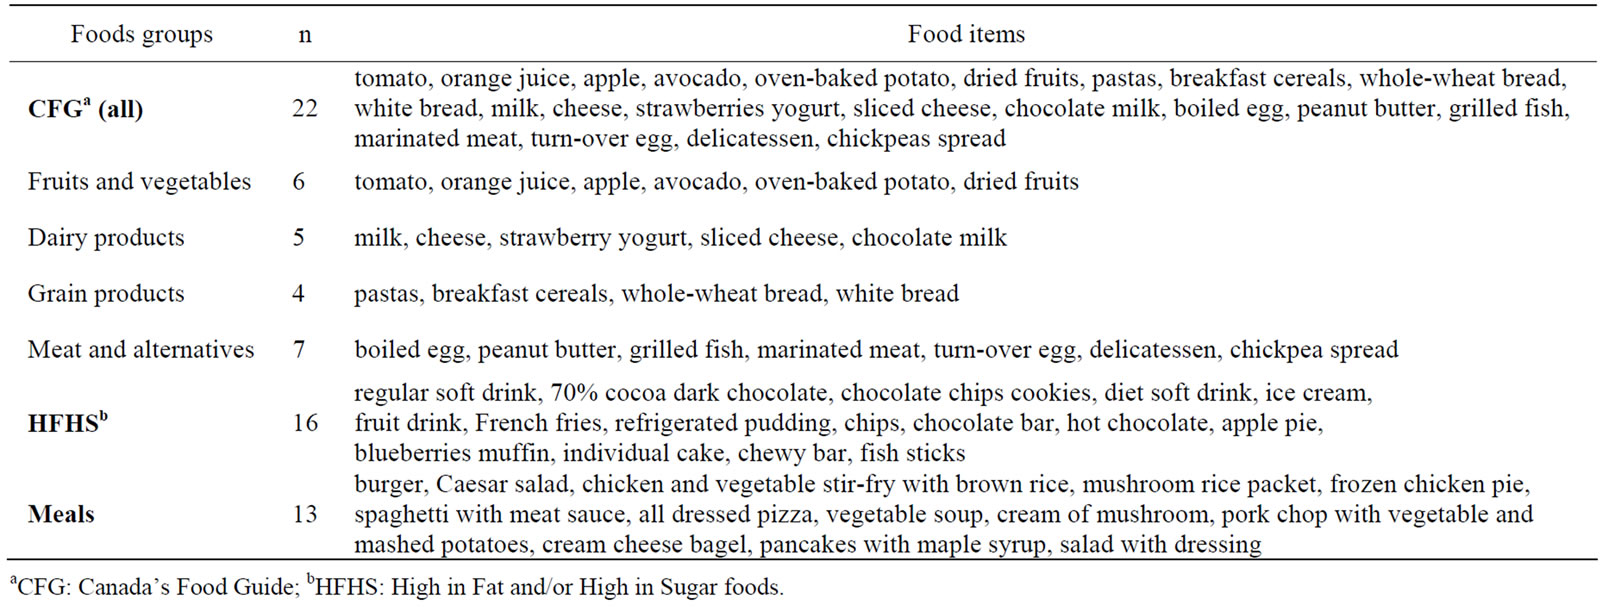
Table 1. The 51 common foods according to their following food groups.
made according to multiple food items referred to meals (Meals).
Frequency procedures were conducted to describe characteristics of participants and to assess the proportion of food perceptions among each sample (adults or RDs). T-tests were used to assess the presence of significant differences between food groups. Mixed procedures, with Lsmeans procedure and Tukey adjustment for multiple comparisons, were then conducted by using mean food frequency score of each group as dependent variables and the two samples as the independent variable. Age was also included as an independent variable in the model to take into account potential differences between groups. With regards to sex differences, the low number of men in both samples (adults: n = 378 and RDs: n = 14) did not allow us to provide estimated values with the Mixed procedures. Analysis were done using SAS Software version 9.2 (SAS Institute, Cary, N.C., USA). The probability level for significance used for the interpretation of all statistical analysis was set at an alpha level of p ≤ 0.05.
3. Results
3.1. Characteristics of the Sample
A higher proportion of women participated in the study for both adults and RDs (Table 2). Adults were distributed equally between all age ranges while RDs were mostly aged between 25 to 54 years old. Participants were almost all born in Canada (93.2%), and were mainly French speakers (88.0%).
3.2. Food Frequency Perceptions of Groups among Adults
CFG foods were seen as foods to be consumed on a “daily” basis (Table 3). More specifically, fruits and
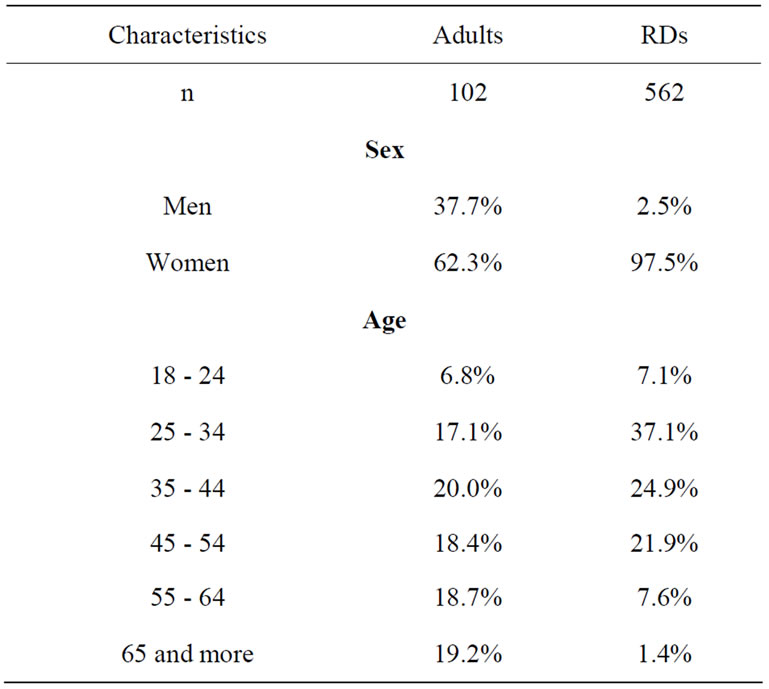
Table 2. Proportion of adults and registered dietitians (RDs) by sex and age categories.
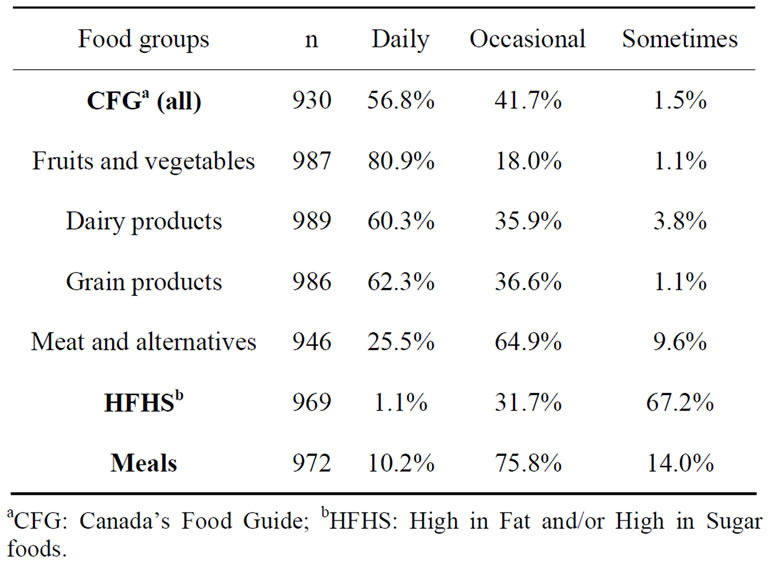
Table 3. Proportion of foods’ perceptions of adults by food groups.
vegetables, dairy products, and grain products were mostly perceived as “daily” foods while meats and alternatives were perceived as “occasional” foods. HFHS foods were mostly perceived as “sometimes” foods, and Meals were perceived as “occasional” foods.
Significant differences were observed for adult groups’ perceptions between HFHS foods (2.44 ± 0.30) versus CFG foods (1.64 ± 0.27; t = 74.90, p < 0.001). Significant differences were also observed between perceptions of the CFG subgroups: fruits and vegetables versus dairy products (t = −17.97, p < 0.001), fruits and vegetables versus grain products (t = −7.96, p < 0.001), fruits and vegetables versus meat and alternatives (t = −45.75, p < 0.001), grain products versus dairy products (t = −10.73, p < 0.001), dairy products versus meat and alternatives (t = −21.77, p < 0.001), grain products versus meat and alternatives (t = −30.98, p < 0.001). Finally, significant differences were noted between perceptions of Meals (2.03 ± 0.28) versus CFG foods (t = 56.92, p < 0.001), and versus HFHS foods (t = −46.05, p < 0.001).
3.3. Food Frequency Perceptions of Groups among Registered Dietitians
Most RDs perceived the CFG foods as well as its four subcategories as “daily” foods (Table 4). HFHS foods were perceived as “sometimes” foods, and Meals were perceived as “occasional” foods.
Significant differences were observed for RDs groups’ perceptions between HFHS foods (2.39 ± 0.28) versus CFG foods (1.32 ± 0.17; t = 101.73, p < 0.001). Significant differences were also observed between perceptions of the CFG subgroups: fruits and vegetables versus dairy products (t = −21.04, p < 0.001), fruits and vegetables versus grain products (t = −17.74, p < 0.001), fruits and vegetables versus meat and alternatives (t = −36.86, p < 0.001), grain products versus dairy products (t = −5.03, p < 0.001), dairy products versus meat and alternatives (t =
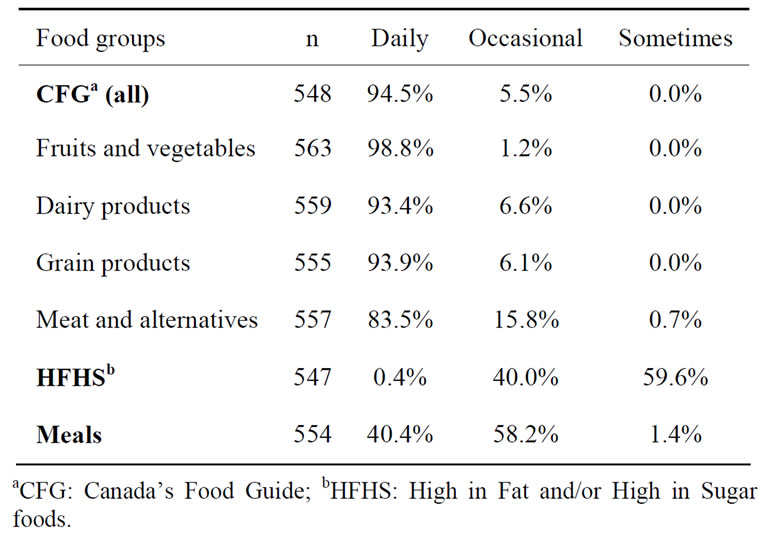
Table 4. Proportion of foods’ perceptions of registered dietitians (RDs) by food groups.
−12.50, p < 0.001), grain products versus meat and alternatives (t = −16.47, p < 0.001). Finally, significant differences were noted between perceptions of Meals (1.75 ± 0.23) versus CFG foods (t = 66.64, p < 0.001), and versus HFHS foods (t = −66.79, p < 0.001).
3.4. Differences in Group’s Perceptions between Adults and Registered Dietitians and According to Age
A significant interaction between samples (adults versus RDs) and age groups was observed for CFG foods’ perceptions (F = 5.85, p < 0.001; Figure 1). Adults from all age groups perceived CFG foods as foods to be consumed on a less frequent basis than RDs, aged from 18 to 64 years old. Significant differences between age groups were observed among adults’ perceptions for CFG foods, with younger respondents perceiving CFG foods as more “daily” foods than older respondents. No differences between age groups were observed among RDs’ perceptions for CFG foods. Similar patterns of interactions were also noted for Meals (F = 3.14, p = 0.008). With regards to HFHS foods, no interaction was observed between samples (adults versus RDs) and age groups (F = 0.92, p = 0.467). A main effect of samples was although observed (F = 6.33, p = 0.012), with adults perceiving HFHS foods as foods to be consumed on a less frequent basis than RDs (2.44 ± 0.01 versus 2.38 ± 0.02, t = 2.52, p = 0.01).
4. Discussion
The aim of this study was to determine how adults and RDs spontaneously perceived foods’ frequency consumption from a healthy eating perspective. Results showed that food perceptions of most adults and RDs followed a frequency continuum that is in line with nutritional guidelines, with CFG foods generally perceived as “daily” foods, Meals as “occasional” foods, and HFHS foods as “sometimes” foods. Perceptions also differ among subcategories of the CFG foods (sorted in ascending order): fruits and vegetables, dairy products, grain products and meats and alternatives. Adults are more severe in their food perceptions than RDs, as adults from all age groups perceived that CFG foods and Meals should be eaten less frequently than RDs (18 to 64 years old). Younger adults perceived these two groups as to be eaten more frequently than older respondents. Adults perceived HFHS foods as to be consumed less frequently than RDs, but no age effect was noted.
Adults’ perceptions for fruits and vegetables are in line with previous studies showing that fruits and vegetables are perceived as healthy foods [3,4,11,16]. On the other hand, dairy and grain products are rarely included in individual’s perceptions of healthy eating [3], which may
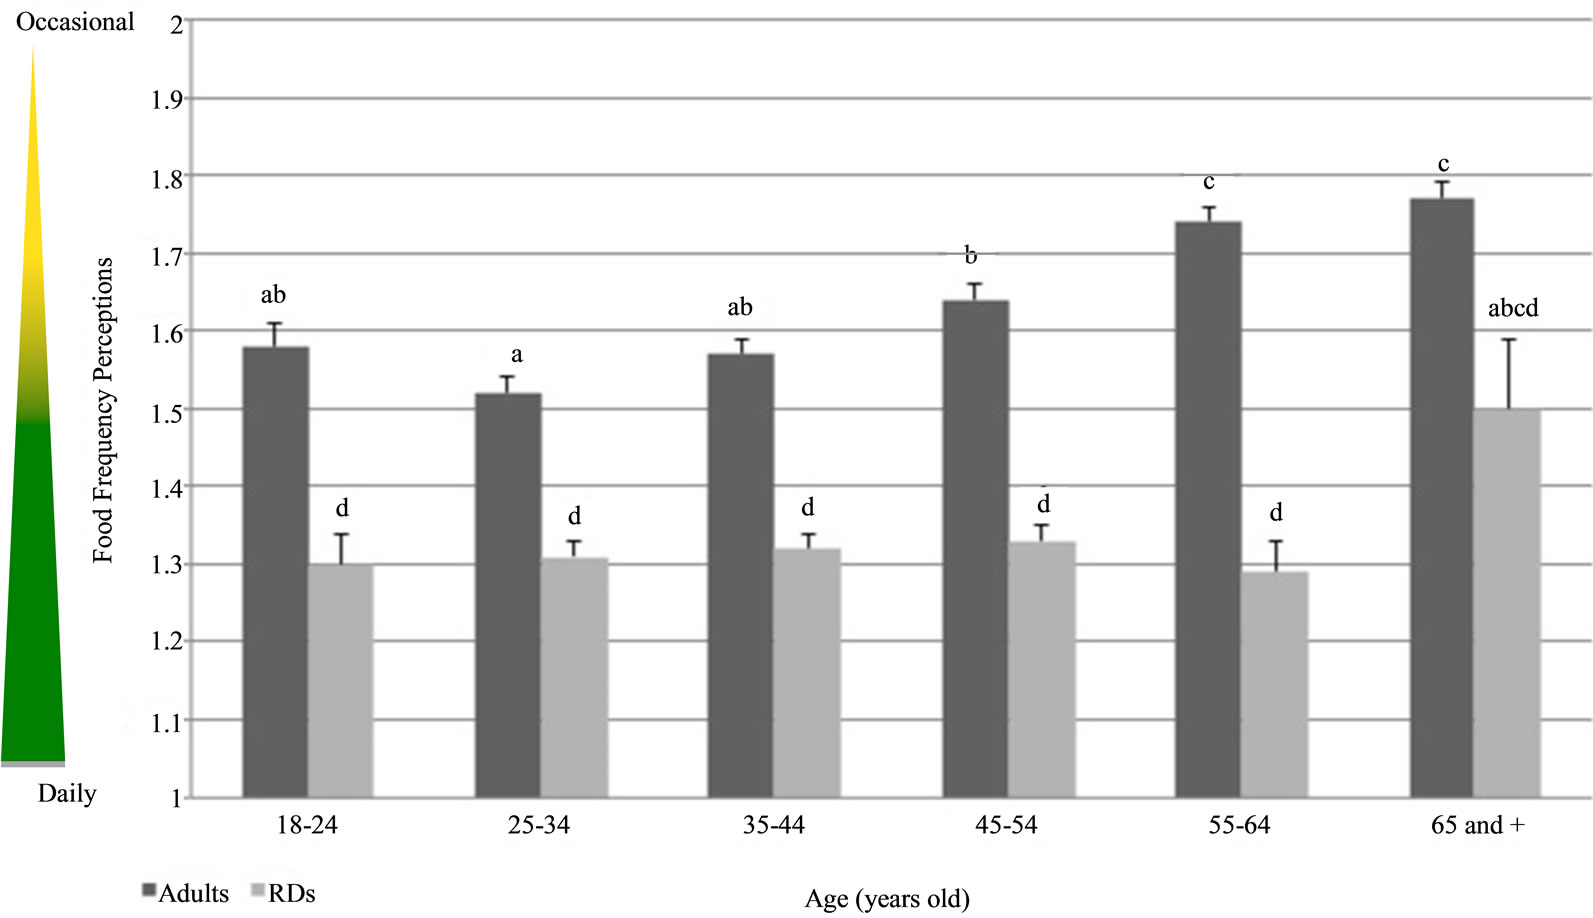
Figure 1. Differences in food group’s perceptions of Canadian Food Guide (CFG) foods between adults and registered dietitians (RDs) and according to age. Means ± SD, mean values with unlike superscript letters were significantly different (p £ 0.01).
explain why these subcategories were perceived as “occasional” foods by one third of the adults. Results observed for meats and alternatives may be explained by the unclear role of meat with regards to health among the population, as these foods are either perceived as a part of a healthy diet [17], or as foods to be avoided or eaten in limited amount [3,17,18]. Adults’ perceptions of HFHS foods are not surprising considering that fat, salt and sugar are often perceived as nutrients to be avoided in a healthy diet [3,7]. With regards to Meals, adults’ perception may reflect their difficulties to perceive a number of food items together, which are having different nutritional value. Overall, adults’ perceptions of CFG foods, HFHS foods and Meals are thus in line with nutrient content of these foods. Those perceptions could be partly explained by population-wide nutrition education campaigns which emphasize the consumption a variety of foods from each of the CFG subcategories as well as low-fat and low-sugar foods [19].
Among nutrition professionals, perceptions of foods were in accordance with general healthy eating guidelines and nutrients content of the foods, as reported in a previous study [12]. For example, nutrition professionals classified HFHS foods at the lowest average rank according to their healthiness [12]. The researchers also observed a highest variance in composite foods’ perceptions, suggesting a difficulty in categorizing such foods according to a frequency continuum, which may explain the RD’s perceptions of Meals in the present study. It is interesting to note that Scarborough et al. showed that 50% of the variance in nutrition professional’s categorysation of foods was made according to food content in fat, total sugars, fibres and sodium [12]. Knowledge about nutritional value of foods may further explain the difference observed between CFG foods (and its four subcategories), HFHS foods and Meals in the present study.
With regards to differences between the perceptions of adults versus RDs, it could be suggested that RDs’ higher nutritional knowledge could lead to a more global perception of a healthy diet where all food can be included, which is in line with the American Dietetic Association’s overall approach to healthy eating [2]. Differences observed between adults and RDs may also be explained by the dichotomized way of thinking about foods previously observed among general population [7,8]. Finally, the significant difference in perception of CFG foods and Meals observed between younger and older adults may be explained by the negative correlation between age and nutritional knowledge reported in previous studies [20,21].
Some limitations should be underlined with regards to this study. Food items included in the survey may not be representative of common foods eaten elsewhere. No descriptive information on food items was given to the participants when collecting data to obtain a global perception of it (e.g., for milk, participants may have in mind skim or whole milk). Participants’ perception may cover a large range of variation for one food item. Our study also has several strengths. Participants were a representative sample of Quebec’s population. Our survey was conducted by an independent third-party and therefore, data obtained were free of any possible influence by the researchers.
In conclusion, even if adults’ perceptions tend to be more severe than RDs, results from this study showed that food perceptions among adults and RDs are in line with an overall awareness of nutritional guidelines, suggesting the presence of a relevant popular knowledge about the value of food. Healthy eating practices are influenced by the way it is conceptualized in society and by how those conceptualizations are enacted through food practices of an individual [22]. It may explain the gaps between actual perceptions and practices in everyday life. It is essential to define food perceptions among population in order to better plan the changes required to create healthier food environments. In fact, if the population perceives spontaneously some less healthy foods as “sometimes” foods, it could be translated by a healthier food offer on a “daily” basis. It could be easier to build social acceptability of food policies in different settings when food perceptions are known.
5. Acknowledgements
The authors would like to acknowledge the work of all collaborators in creating the Vision for Healthy Eating: the Health and Social Services Ministry of Québec, the nine others ministries and governmental organisations.
REFERENCES
- American Dietetic Association, “Food Labeling: Definition of the Term ‘Healthy’. American Dietetic Association,” Journal of the American Dietetic Association, Vol. 93, No. 4, 1993, p. 404. http://dx.doi.org/10.1016/0002-8223(93)92284-5
- American Dietetic Association, “Position of the American Dietetic Association: Total Diet Approach to Communicating Food and Nutrition Information,” Journal of the American Dietetic Association, Vol. 107, No. 7, 2007, pp. 1224-1232. http://dx.doi.org/10.1016/j.jada.2007.05.025
- M. C. Paquette, “Perceptions of Healthy Eating: State of Knowledge and Research Gaps,” Canadian Journal of Public Health, Vol. 96, No. S3, 2005, pp. S15-S19,S16- S21.
- L. W. Falk, J. Sobal, C. A. Bisogni, M. Connors and C. M. Devine, “Managing Healthy Eating: Definitions, Classifications, and Strategies,” Health Education & Behavior, Vol. 28, No. 4, 2001, pp. 425-439. http://dx.doi.org/10.1177/109019810102800405
- A. M. Hamelin, C. Lamontagne, D. Ouellet, N. Pouliot and H. Turgeon O’Brien, “Healthful Eating: Beyond Food, a Global Concept,” Canadian Journal of Dietetic Practice and Research, Vol. 71, No. 2, 2010, pp. e21-e27. http://dx.doi.org/10.3148/71.2.2010.98
- C. Diekman and K. Malcolm, “Consumer Perception and Insights on Fats and Fatty Acids: Knowledge on the Quality of Diet Fat,” Annals of Nutrition and Metabolism, Vol. 54, No. S1, 2009, pp. 25-32.
- P. Rozin, M. Ashmore and M. Markwith, “Lay American Conceptions of Nutrition: Dose Insensitivity, Categorical Thinking, Contagion, and the Monotonic Mind,” Health Psychology, Vol. 15, No. 6, 1996, pp. 438-447. http://dx.doi.org/10.1037/0278-6133.15.6.438
- M. E. Oakes and C. S. Slotterback, “Prejudgments of Those Who Eat a ‘Healthy’ versus and ‘Unhealthy’ Food for Breakfast,” Current Psychology, Vol. 23, No. 4, 2004, pp. 267-278. http://dx.doi.org/10.1007/s12144-004-1001-6
- M. E. Oakes and C. S. Slotterback, “Judgements of Food Healthfulness: Food Name Stereotypes in Adults over Age 25,” Appetite, Vol. 37, No. 1, 2001, pp. 1-8. http://dx.doi.org/10.1006/appe.2001.0405
- M. A. Beydoun, L. M. Powell, X. Chen and Y. Wang, “Food Prices Are Associated with Dietary Quality, Fast Food Consumption, and Body Mass Index among U.S. Children and Adolescents,” Journal of Nutrition, Vol. 141, No. 2, 2011, pp. 304-311. http://dx.doi.org/10.3945/jn.110.132613
- R. Povey, M. Conner, P. Sparks, R. James and R. Shepherd, “Interpretations of Healthy and Unhealthy Eating, and Implications for Dietary Change,” Health Education & Research, Vol. 13, No. 2, 1998, pp. 171-183. http://dx.doi.org/10.1093/her/13.2.171
- P. Scarborough, M. Rayner, L. Stockley and A. Black, “Nutrition Professionals’ Perception of the ‘Healthiness’ of Individual Foods,” Public Health Nutrition, Vol. 10, No. 4, 2007, pp. 346-353. http://dx.doi.org/10.1017/S1368980007666683
- Ministère de la Santé et des Services Sociaux, “Vision de la Saine Alimentation—Pour la Création d’Environnements Alimentaires Favorables à la Santé,” Gouvernement du Québec, Quebec, 2010.
- SOM, “SOM—Enquêtes et Sondage, Recherche Qualitative et Quantitative, Sondages Téléphoniques,” 2012. http://www.som.ca/
- SOM, “SOM’s Policies and Practices with Respect to the Protection of Personal Information,” 2004. http://www.som.ca/documents/file/pol_practices.pdf
- N. Eikenberry and C. Smith, “Healthful Eating: Perceptions, Motivations, Barriers, and Promoters in Low-Income Minnesota Communities,” Journal of the American Dietetic Association, Vol. 104, No. 7, 2004, pp. 1158- 1161. http://dx.doi.org/10.1016/j.jada.2004.04.023
- B. M. Margetts, J. A. Martinez, A. Saba, L. Holm, M. Kearney and A. Moles, “Definitions of ‘Healthy’ Eating: A Pan-EU Survey of Consumer Attitudes to Food, Nutrition and Health,” European Journal of Clinical Nutrition, Vol. 51, No. S2, 1997, pp. S23-S29.
- A. A. Lake, R. M. Hyland, A. J. Rugg-Gunn, C. E. Wood, J. C. Mathers and A. J. Adamson, “Healthy Eating: Perceptions and Practice (The ASH30 Study),” Appetite, Vol. 48, No. 2, 2007, pp. 176-182. http://dx.doi.org/10.1016/j.appet.2006.08.065
- Health Canada, “Eating Well with Canada’s Food Guide,” 2007. http://www.hc-sc.gc.ca/fn-an/food-guide-aliment/index-eng.php
- M. Dickson-Spillmann and M. Siegrist, “Consumers’ Knowledge of Healthy Diets and its Correlation with Dietary Behaviour,” Journal of Human Nutrition and Dietetics, Vol. 24, No. 1, 2011, pp. 54-60. http://dx.doi.org/10.1111/j.1365-277X.2010.01124.x
- K. Parmenter, J. Waller and J. Wardle, “Demographic Variation in Nutrition Knowledge in England,” Health Education & Research, Vol. 15, No. 2, 2000, pp. 163-174. http://dx.doi.org/10.1093/her/15.2.163
- S. Ristovski-Slijepcevic, G. E. Chapman and B. L. Beagan, “Engaging with Healthy Eating Discourse(s): Ways of Knowing about Food and Health in Three Ethnocultural Groups in Canada,” Appetite, Vol. 50, No. 1, 2008, pp. 167-178. http://dx.doi.org/10.1016/j.appet.2007.07.001