Food and Nutrition Sciences
Vol.4 No.5(2013), Article ID:31006,7 pages DOI:10.4236/fns.2013.45063
Utilization of Different Hydrocolloid Combinations in Gluten-Free Bread Making
![]()
1Departement of Nutrition and Food Technology, Faculty of Agriculture, Jordan University of Science and Technology, Irbid, Jordan; 2Deptartment of Food Science and Biotechnology, College of Agriculture, University of Baghdad, Baghdad, Iraq; 3Applide Science Department, Al-Huson University College, Al-Balqa Applied University, Al-Huson, Jordan.
Email: *maghaydah@just.edu.jo
Copyright © 2013 Sofyan Maghaydah et al. This is an open access article distributed under the Creative Commons Attribution License, which permits unrestricted use, distribution, and reproduction in any medium, provided the original work is properly cited.
Received February 25th, 2013; revised March 25th, 2013; accepted April 2nd, 2013
Keywords: Coeliac Disease (CD); Gluten-Free Bread (GFB); Xanthan; Carrageenan; Pectin
ABSTRACT
Coeliac disease (CD) is a common lifelong disorder with small bowel malabsorption and gluten intolerance. The only effective treatment for CD is a strict lifelong renunciation of gluten-containing foods. Currently, the cereal products designed to meet the requirements of CD patients, especially gluten-free bread, are scarce, of low quality and poor flavor. Therefore, preparation of high quality and affordable bread for coeliac patients was the main objective of this study. Three kinds of gluten-free bread were prepared, in which wheat flour was substituted with rice and corn flour at a ratio of 5:1, respectively. Gluten was substituted using different hydrocolloids: 1% xanthan and 1% carrageenan (Mix A), GFB A; 1% xanthan and 1% pectin (Mix B), GFB B; and 1% carrageenan and 1% pectin (Mix C), GFB C. These three types of bread were compared to control bread produced from wheat flour (WB). Sponge and dough method with some modifications was used to produce the bread samples with a developed formula (0.8% yeast, 4.0% sugar, 2% salt, 7.0% shortening, 2.0% non-fat dry milk, and 1% sodium stearoyl lactylate (SSL)). Determination of the chemical composition, rheological properties and physical characteristics, as well as sensory evaluation of the bread samples, was undertaken. Results showed that the moisture content of WB bread (control) was significantly lower than that of all types of gluten-free bread, and there was no significant difference in ash, protein, and lipid contents among the gluten-free bread samples. GFB A, GFB B and GFB C displayed no significant differences in their specific volumes. The sensory evaluation showed that GFB C received the lowest sensory evaluation score. Therefore, GFB A and GFB B were the best gluten-free samples.
1. Introduction
Coeliac disease (CD) is a digestive disease that damages the small intestine and interferes with absorption of nutrients from food [1,2]. It is a chronic hereditary noninfectious disorder with an incidence of about one in every 300 births [3]. The disease is caused by the intake of gluten, which is a protein found in wheat, rye barley, and possibly oats [4]. Gluten is a protein complex formed when water is added to wheat, barley, rye and oat flours. It is a mixture of individual proteins: gliadin and glutenin [5]. The gliadin fraction acts as a toxic substance, causing atrophy of the intestinal villi and seriously reducing the absorptive surface of the intestinal tract, resulting in malabsorption of many nutrients including fat, protein, carbohydrate, fat-soluble vitamins, iron, calcium, magnesium, zinc and some water-soluble vitamins [6]. These factors lead to mucosal inflammation, thrive failure, weight loss, hypotonia, abdominal distention and steatorrhoea. Therefore, the only effective treatment for CD is a strict lifelong renunciation of gluten-containing foods, which eventually results in clinical and mucosal recovery [7]. Cereal products, in general, and wheat in particular, are the basic components of the diet around the world. They supply more nutrients than other single food sources [8]. In Middle Eastern countries, especially Jordan [9], wheat bread is an essential staple food [10]. Furthermore, bread contributes about 53% and 65% of the total calorie and protein intakes, respectively, to Jordanians and up to 80% to 90% of calorie intake to other people in the Middle East [9]. It is a challenge to produce high-quality gluten-free bread, given that gluten is the major structure-forming protein and is responsible for developing viscoelastic dough that has the ability to keep gas and produce a light baked product [11]. Rice and corn flours have been found to be one of the most suitable flours for developing gluten-free products. This could be due to their soft taste, easily digestible carbohydrates content, and low levels of prolamin and hypoallergenic properties [12]. However, they are unable to form a useful protein network to provide the structure required in bread because the texture of corn bread is quite crumbly (lacking gluten) and the rice protein is unable to retain the gas produced during the fermentation process (McWilliams, 1997) [13]. Accordingly, gluten alternatives have been used to produce high-quality gluten-free bread, as recommended by A. Aziz and Abdul-Hussain [14] when they substituted wheat flour with 50% rice flour and 50% corn starch to prepare four gluten-free bread samples using 12.5% soybean flour, 0.5% carboxymethalcellulose (CMC), 0.5% pectin and a combination of 0.25% CMC and 0.25% pectin. Moreover, Marco and Rosell produced rice-based gluten-free soybean bread enriched in hydroxypropyl methylcellulose (HPMC) as the gluten substitute [12]. These results demonstrated that the use of additives improved gluten-free bread characteristics. Therefore, ingredients that have the ability to mimic the properties of gluten were used in this study as gluten alternatives, together with gluten-free flour. Based on preliminary work, it was concluded that using hydrocolloids and gums in bread formula improved the quality of gluten-free bread [15]. Xanthan, carrageenan and pectin were used in this study due to their unique properties in gluten-free formula components to produce the best quality bread. Currently, the cereal products designed to meet the requirements of CD patients, especially gluten-free bread, are lacking, of low quality, and exhibit a dry crumb, poor mouth-feel and flavor. Moreover, they are expensive in Jordan and neighboring countries. Therefore, the main aim of this study was to develop a local, high quality and affordable bread for coeliac patients.
2. Materials and Methods
2.1. Materials
Zero-grade wheat flour with an extraction rate of 72% [16], rice flour, corn flour, yeast, sugar, non-fat milk, shortening, xanthan, carrageenan, pectin and sodium stearoyl lactylate (SSL) were obtained from Modern Flour Mills and Macaroni Factories (Amman, Jordan).
2.2. Flour Mix Formula
Zero-grade wheat flour was used to produce plain bread, which was considered the control bread. Regarding gluten-free flour, rice and corn flours at a ratio of 5:1 were blended with 2% (of flour weight) of three different mixtures: Mix A (gluten-free flour with 1% xanthan and 1% carrageenan); Mix B (gluten-free flour with 1% xanthan and 1% pectin); and Mix C (gluten-free flour with 1% carrageenan and 1% pectin). (Table 1).
2.3. Rheological Properties of Wheat Flour and Mixture
The rheological properties of the dough as those used in bread making (control and blended mix), but without added yeast, were determined by farinograph tests. These were carried out according to AACC-approved method No. 54-21 [17], using Brabender Farinograph Dusiburg, Model 810104, supplied with the model 820501 (S 300 N) mixer. The parameters obtained from the Farinogram tests were: water absorption, arrival time, dough development time (DDT) and stability time (time during which dough consistency was 500 B.U.).
2.4. Bread Preparation
Pan bread was prepared from flour samples A, B, C and control using the sponge and dough method [17]. The bread’s ingredients were flour, yeast (0.8%), sugar (4.0%), salt (2.0%), shortening (7.0%), non-fat dry milk (2.0%), SSL (1.0%) and water (57.5%) for wheat bread (control). Sugar, yeast and 50% of wheat or gluten-free flour were placed into the mixing bowl and blended for one minute using a Kenwood mixer (KM 800, Britain). Then, 70% of water was added, and the entire mixture was blended for six minutes to make the control bread, and four minutes to produce the gluten-free bread. The resulting dough was fermented for 20 minutes at 30˚C and 80% to 90% humidity. The remaining wheat flour, shortening, salt, SSL, non-fat dry milk and water were added to the fermented dough. The dough was divided, moulded and then placed in pup loaf pans for fermentation at 30˚C with 80% to 90 % relative humidity, until the dough reached the top edge of the pan. All mixing and fermentation conditions were the same for all samples (mixing time was 6 min, proofing time 20 min, proofing temperature 25˚C, remixing time 4 min, fermentation temperature 30˚C, relative humidity inside the
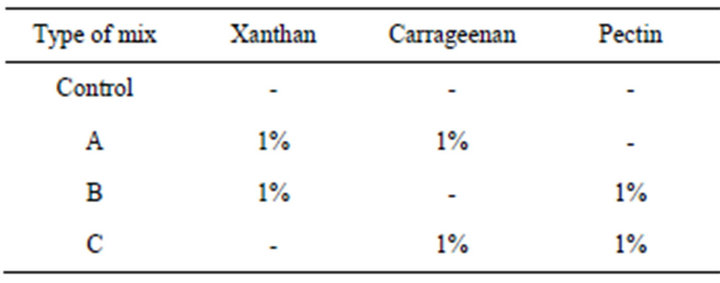
Table 1. Hydrocolloid combinations used in the production of gluten-free bread.
fermented bread 80% to 90%, baking time 25 min and baking temperature 170˚C), except for fermentation time (50 min for control bread and 60 min for gluten-free bread). Finally, the pans were placed in the oven (Rational, Germany) and baked for 25 minutes. The loaves were then cooled for 1 hour and after that, loaf weight and loaf volume were measured by the sesame seed displacement method. The results were obtained for 5 replicates and the average was calculated.
2.5. Chemical Analysis of Flour and Bread
Moisture, protein, lipid and ash were determined following the AOAC [18] method for wheat, rice, corn flours and all types of bread. Wet and dry gluten were measured following the ICC method for wheat flour [19].
2.6. Evaluation of Bread Quality
Specific volume of bread (cm3/g) was defined as the quotient between loaf volume and loaf weight. Specific volume of the produced bread samples was determined by dividing volume by weight.
2.7. Sensory Evaluation
All pan bread samples were evaluated within 1 hour of baking by 10 trained panellists (trained by the researcher using standard product evaluation criteria). Two training sessions were conducted in which the panellists were trained to evaluate the sensory attributes of control and gluten-free bread (GFB) with different gluten substitution (GFB A, GFB B and GFB C). The panellists used the orientation session to improve their reproducibility and accuracy. Randomly coded samples were served to the panellists individually. They were supplied with water for cleansing the palate between samples. Sensory evaluation was carried out for the overall impression, color and nature of crust, color and texture of crumb symmetry of form, uniformity of baking, grain, aroma, and taste. The Hedonic scale test was used for overall impression, nature of crumb, symmetry of form, uniformity of baking, grain, aroma, and taste of the sample: 1 = dislike extremely to 9 = like extremely. The Hedonic scale test was also used for crust and crumb color: 1 = much too light, 2 = too light, 3 = just about right, 4 = too brown, 5 = much too brown. In addition, the Hedonic scale test was employed to assess the nature of the crust: 1 = too hard, 2 = hard, 3 = just about hard, 4 = soft, 5 = too soft.
2.8. Statistical Analysis
The data were analysed using the SPSS [20]. One way analysis of variance (ANOVA) was performed to test differences between the treatments followed by mean separation using Duncan’s analysis. Findings with a p-value of ≤0.05 were considered to be statically significant.
3. Results and Discussion
3.1. Flour Characterization
Characteristics of the zero-grade flour that was used in the production of pan bread, including wet and dry gluten were comparable with the standard [16].
3.2. Chemical Evaluation of Wheat, Rice and Corn Flours
The moisture percentages of wheat, rice and corn flours used in this study were 13.82%, 12.44% and 9.38%, respectively (Table 2). The ash contents were 0.515%, 0.145% and 0.765%, respectively, while the percentages of crude protein were 13.06%, 7.81% and 11.3%, respectively. The percentage of fat content for wheat, rice and corn flours were 1.5, 0.88 and 3.9, respectively (Table 2).
3.3. Effect of Different Gluten-Free Flour Blends on Dough Rheological Properties
Farinograph properties of the control and gluten-free flour blends are shown in Table 3. Water absorption of the control was 57.5%, arrival time 2.6 min, DDT 6.1 min and the stability time 8 min. The farinograms of the gluten-free flour blends revealed that the farinograph properties were increased compared to control, with the highest for blend A containing xanthan and carrageenan. These results were consistent with those obtained by Ćurić et al. [21], they observed that the addition of hydrocolloids improved water absorption and rheological
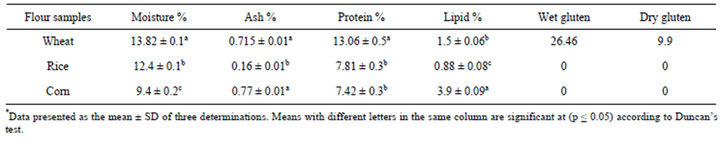
Table 2. Chemical properties of flours*.
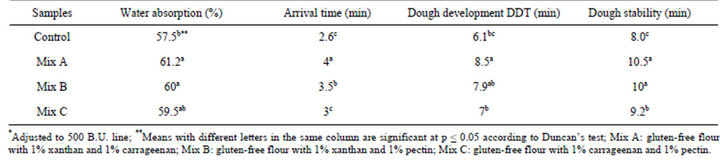
Table 3. Rheological properties of control and different gluten-free mixtures*.
properties. Similar results were also demonstrated by Rosell et al. [22].
3.4. Chemical Composition of Gluten-Free Bread (GFB) and Wheat Bread (WB)
The chemical composition of WB and different GFB are presented in Table 4.
The moisture contents of WB, GFB A, GFB B and GFB C were 24.39%, 43.09%, 43.31% and 40.66%, respectively. As shown in Table 4, the moisture content of control bread (24.39%) was lower than that of all the other gluten-free breads (40.66% to 43.31%). The significant difference in moisture content between control and gluten-free bread samples could have been due to the water percentage in the control bread formula (57.5%). The water percentage of the gluten-free bread formula was 100% (on the basis of flour). Moreover, the addition of hydrocolloids increased water percentage due to the hydrophilic nature of these [23]. An increase in water percentage has also been reported by other researchers when various hydrocolloids, such as xanthan and carrageenan, have been added to wheat flour. In addition, this difference in water percentage could be due to the differences in the starch content of rice flour (88% to 90%) and wheat starch (70% to 72%), which could have a positive influence on increasing the water holding capacity, leading to a higher hydration rate [24]. Furthermore, there was a significant difference in the moisture content of the three types of gluten-free bread samples; bread samples GFB A and GFB B showed the highest percentages of 43.39% and 43.31%, respectively, while bread sample GFB C showed 40.66%. These significant differences could be related to the presence of pectin in GFB C, which has the ability to form junctions and a network of polymer chains that entrap portions of the aqueous solution [25]. Results of ash content for bread showed a significant decrease in ash in gluten-free bread compared to control (Table 4). Despite the ash content of corn flour being similar to that of wheat flour, the ash content of gluten-free bread was significantly lower than that of control bread. The protein content of WB was higher (15.98%) than that of all the other gluten-free bread samples GFB A, GFB B and GFB C, which displayed contents of 14.34%, 14.33% and 12.99%, respectively (Table 4). The fat content of corn flour was higher than that of wheat and rice flours, yet the fat content of control bread (9.5%) was lower than those of all the other gluten-free breads (10.72% to 10.46%) Table 4. This significant difference was expected because the fat content of rice flour was very low (0.8). In addition, the ratio between rice and corn flours was 5:1; thus, the fat content of gluten-free bread was lower than that of the control bread.
3.5. Physical Characterization of Bread
Table 5 illustrates the characterization of pan bread. The specific volumes of control, A, B, and C bread samples were 3.21, 2.65, 2.67 and 2.59, respectively. Bread sample B containing xanthan and pectin gave the highest specific volume score. Similarly, Aziz and Abdul-Hussain [14] reported the same result when pectin was added to the gluten-free formula. This was due to the effect of pectin in creating the network that could hold the gas and improve bread quality [26].
Sciarini et al. [27] and Mirsaeedghazi et al. [28] reported that hydrocolloids improved dough development and gas retention by increasing system viscosity, thereby producing loaves with better specific volumes.
3.6. Sensory Evaluation of Bread
The results of the sensory evaluation of control and gluten-free bread samples revealed that the WB, GFB A, and GFB B samples significantly (p ≤ 0.05) obtained the highest overall impression score compared to the GFB C sample, which received the lowest score. The quality score for the crust colour of bread ranged from 2.83 to 3.67 (Table 6). Regarding crust colour, sample GFB A was the darkest (too brown) and received a score of 3.67, whereas sample GFB C was the lightest (too light) and received a score of 2.8 (Table 6). Moreover, there was no significant (p > 0.05) difference in terms of crust colour among WB, GFB A and GFB B bread samples. Crust color is mainly linked to Maillard browning and caramelisation reactions, and is influenced by the distribution
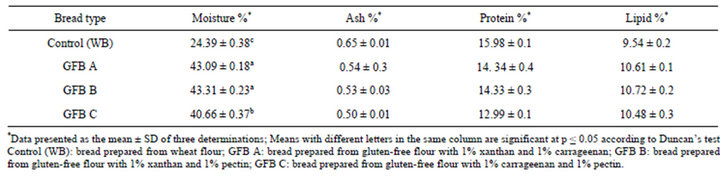
Table 4. Chemical properties of bread.
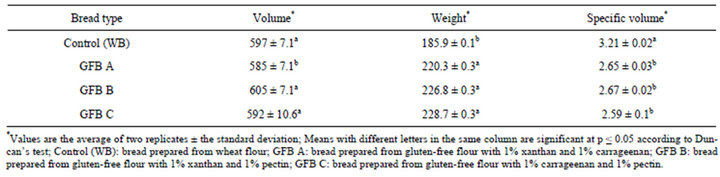
Table 5. Physical characteristics of bread.
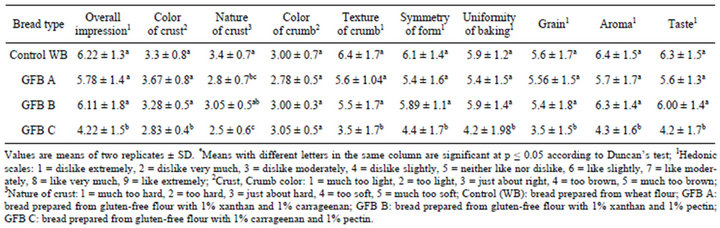
Table 6. Sensory evaluation of the bread samples.
of water and the reaction of reducing sugars and amino acids [11,29]. Moreover, crust color depends on the baking temperature [30]. It should be dark, normally ranging from deep golden brown on the top to a light golden brown on the sides of the loaf [30]. As illustrated in Table 6, the crumb color score for bread samples ranged from 2.78 to 3.05. There was no significant difference among the bread samples. This was due to the fact that crumb color depended on the natural endosperm color and bran particles of the flour, rather than Maillard browning and caramelization reactions, because the crumb does not reach such high temperatures as the crust [30,31]. Therefore, the Straight flour fails to produce a bright crumb color [30] and bread-containing corn has a significantly darker crumb [31]. On the other hand, the quality score for the nature of bread crust showed that the nature of crust varied significantly (p ≤ 0.05) among different treatments. The results indicated that the WB and GFB B bread samples received the highest scores of 3.4 and 3.05, respectively, which was just about hard, in comparison with GFB C, which attained the lowest score of 2.5 (too hard). Whistler and BeMiller [25] demonstrated that moisture migration from the crumb to the crust results in the hardness of the crust. The crumb texture of WB, GFB A and GFB B significantly (p ≤ 0.05) received the highest scores of 6.4, 5.6 and 5.5, respectively, compared to GFB C, which had the lowest score of 3.5. This was due to the addition of hydrocolloids to gluten-free breads at 2% concentration, which increased the elasticity values [23]. The quality score of symmetry of form ranged from 6.1 to 4.4, which indicated that control WB, GFB B and GFB A had the highest scores of 6.1, 5.89 and 5.4, respectively, compared to GFB C, which had the lowest score of 4.4. The symmetry of form indicates that the loaf has been properly proofed and has shown a good oven spring. Loaf defects that detract from symmetry of form include unsuitable loaf dimensions, as loaves being too wide or too narrow for their height and length are due to faulty pan design. Flat tops are caused by weak gluten, as are protruding sides or ends, and sharp corners [32]. The uniformity of bake scores ranged from 5.9 to 4.2. Control WB, GFB A and GFB B displayed the highest scores regarding uniformity of bake, compared to GFB C, which exhibited the lowest score. A loaf with a dark thick top crust, and a pale and underbaked side and bottom is unacceptable. The ideal loaf should possess a crust of uniform thickness and with its golden color varying over only a limited range [32]. The grain of WB, GFB A and GFD B bread samples received significantly (p ≤ 0.05) higher scores of 5.6, 5.56 and 5.4, respectively, than GFD C, which gave the lowest score of 3.5. This might have been due to the combination of xanthan and carrageenan in GFB A, and xanthan with pectin in bread GFB B, which stabilized the air cells in gluten-free bread and prevented coalescence of the cells [23]. Moreover, xanthan gum improves the cohesion of starch granules [33]. Sabanis et al. [31] defined the grain of the crumb “the cell structure as it is exposed when the loaf of bread is sliced”. Cell size, shape of the individual cell and thickness of the cell walls together are attributes of grain characteristics [30]. The results of aroma indicated that GFB A, GFB B and WB bread gave the highest scores of 5.7, 6.3 and 6.4, respectively, compared to GFB C, which was less desirable and received the lowest score of 4.3. This difference was due to the addition of xanthan gum, which improved the flavor of gluten-free bread [34]. Furthermore, the presence of oil and milk enhances the flavor of the baked products. Finally, the quality score for the taste of the bread ranged from 6.3 to 4.2. GFB A, GFB B and WB attained the highest scores of 5.6, 6.0 and 6.3, respectively, relative to GFB C, which was less well accepted as it received the lowest score of 4.2.
4. Conclusion
Our results indicated the possibility of producing good quality gluten-free bread by substituting wheat flour with rice and corn flours at a ratio of 5:1 and using gluten substitutes A (1% xanthan and 1% carrageenan) and B (1% xanthan and 1% pectin).
REFERENCES
- American Gastroenterological Association, “Medical Position Statement: Celiac Sprue,” Gastroenterology, Vol. 120, No. 6, 2001, pp. 1522-1525. doi:10.1053/gast.2001.24055
- P. H. R. Green, “The Many Faces of Celiac Disease: Clinical Presentation of Celiac Disease in the Adult Population,” Gastroenterology, Vol. 128, No. , 2005, pp. s74-s78. doi:10.1053/j.gastro.2005.02.016
- V. Kumar, R. Cotran and S. Robbins, “Robbins Basic Pathology,” 7th Edition, Saunders Murray, Philadelphia, 2003.
- A. Rubio-Tapia and J. A. Murray, “The Liver in Celiac Disease,” Hepatology, Vol. 46, No. 5, 2007, pp. 1650- 1658. doi:10.1002/hep.21949
- R. Sturgess, P. Day, H. J. Ellis, J. E. Lundin, H. A. Gjertsen, M. Kontakou and P. J. Cielitira, “Wheat Peptide Challenge in Celiac Disease,” Lancet, Vol. 343, No. 8900, 1994, pp. 758-761. doi:10.1016/S0140-6736(94)91837-6
- J. J. Connon “Celiac Disease,” In: M. E. Shils, M. Shike, C. A. Ross, B. Caballero and R. J. Cousins, Eds., Modern Nutrition in Health and Disease, 10th Edition, Lippincott Williams & Wilkins, Philadelphia, 2006, pp. 1219-1226
- E. N. Whitney, C. B. Cataldo, L. K. DeBruyne and S. R. Rolfes, “Nutrition for Health and Health Care,” 2nd Edition, Wadsworth Thomson Learning, New York, 2001.
- J. Ridgwell and J. Ridway, “Food around the World,” Oxford University Press, Oxford, 2000.
- A. Amr, “A Preliminary Study of Arab Middle Eastern Bread with Reference to Jordan,” Dirasat, Vol. 15, No. 10, 1988, pp. 81-98.
- S. Ayoub and S. Knight, “Nutritional and Sensory Evaluation of Pita Bread ‘Arabic Bread’ Supplemented with Provesteen-T ‘Single-Cell Protein’,” Ecology of Food and Nutrition, Vol. 25, No. 2, 1991, pp. 169-174. doi:10.1080/03670244.1991.9991164
- E. Gallagher, T. R. Gromley and E. K. Arendt, “Crust and Crumb Characteristics of Gluten Free Breads,” Journal of Food Engineering, Vol. 56, No. 2-3, 2003, pp. 153-161. doi:10.1016/S0260-8774(02)00244-3
- C. Marco and C. M. Rosell, “Breadmaking Performance of Protein Enriched, Gluten-Free Bread,” European Food Research and Technology, Vol. 227, No. 4, 2008, pp. 1205-1213. doi:10.1007/s00217-008-0838-6
- M. McWilliams, “Foods: Experimental Perspectives,” 3rd Edition, Merrill, 1997
- L. S. Aziz and S. S. Abdul-Hussain, “Production of Non-Gluten Bread,” Iraqi Journal of Science and Agriculture, Vol. 30, No. 2, 1999, pp. 513-521.
- M. Gobbetti, C. G. Rizzello, R. D. Cagno and M. D. Angelis, “Sourdough Lactobacilli and Celiac Disease,” Food Microbiology, Vol. 24, No. 2, 2006, pp. 187-196. doi:10.1016/j.fm.2006.07.014
- Jordan Institution of Standards and Metrology, “Wheat Flour Standard, No. 293. Technical Regulation,” Amman, 2005.
- American Association of Cereal Chemists, “Approved Methods of the AACC,” 8th Edition, The Association, St. Paul, 2000.
- Association of Official Analytical Chemists, “Official Methods of Analysis of AOAC International,” 16th Edition, Virginia, 1995.
- International Association for Cereal Science and Technology (ICC), “Standard Method No. 155. Determination of Wet Gluten Quantity and Quality of Whole Wheat Meal and Wheat Flour,” Vienna, 1994.
- “Statistical Package for the Social Sciences,” Version 15.0, SPSS Inc., Chicago, 2007.
- D. Ćurić, D. Novotni, D. Tušak, I. Bauman and D. Gabrić, “Gluten-Free Bread Production by the Corn Meal and Soybean Flour Extruded Blend Usage,” Agriculturae Conspectus Scientifi cus, Vol. 72, No. 3, 2007, pp. 227- 232.
- C. M. Rosell, J. A. Rojas and C. Benedito de Barber, “Influence of Hydrocolloids on Dough Rheology and Bread Quality,” Food Hydrocolloids, Vol. 15, No. 1, 2001, pp. 75-81. doi:10.1016/S0268-005X(00)00054-0
- A. Lazaridou, D. Dyta, M. Papageorgiou, N. Belc and C. G. Billiaderis, “Effects of Hydrocolloids on Dough Rheology and Bread Quality Parameter in Gluten-Free Formulation,” Journal of Food Engineering, Vol. 79, No. 3, 2007, pp. 1033-1047. doi:10.1016/j.jfoodeng.2006.03.032
- R. C. Hoseney, “Principles of Cereal Science and Technology,” American Association of Cereal Chemists Inc., St. Paul, 1986.
- R. L. Whistler and J. N. BeMeiller, “Carbohydrate Chemistry for Food Scientists,” Eagan Press, St. Paul, 1997.
- A. G. Ganz, “Some Effects of Gums Derived from Cellulose on the Texture of Food,” Cereal Science Today, Vol. 18, No. 12, 1973, p. 398.
- L. S. Sciarini, P. D. Ribotta, A. E. León and G. T. Pérez, “Incorporation of Several Additives into Gluten Free Breads: Effect on Dough Properties and Bread Quality,” Journal of Food Engineering, Vol. 111, No. 4, 2012, pp. 590-597. doi:10.1016/j.jfoodeng.2012.03.011
- H. Mirsaeedghazi, Z. Emam-Djomeh and A. S. Mousavi, “Rheometric Measurement of Dough Rheological Characteristics and Factors Affecting It,” International Journal of Agriculture & Biology, Vol. 10, No. 1, 2008, pp. 112-119.
- N. Kent and A. Evers, “Kent’s Technology of Cereals’,” 4th Edition, Pergamon, 1994. doi:10.1533/9781855736603
- E. J. Pyler, “Baking Science and Technology. Volume II,” Siebel Publishing Company, Chicago, 1973.
- D. Sabanis, D. Lebesi and C. Tzia, “Effect of Dietary Fiber Enrichment on Selected Properties of Gluten-Free Bread,” LWT-Food Science and Technology, Vol. 42, No. 8, 2009, pp. 1380-1389.
- K. Kulp and J. Ponte, “Hand Book of Cereal Science and Technology,” Marcel Dekker, Inc., New York, 2000
- O. Ozboy, “Development of Corn Starch-Gum Bread for Phyenlketonuria Patients,” Nahrung, Vol. 46, No. 2, 2002, pp. 87-91. doi:10.1002/1521-3803(20020301)46:2<87::AID-FOOD87>3.0.CO;2-Y
- G. Ylimaki, Z. Hawrysh, R. Hardin, A. Thomson, “Response Surface Methodology in the Development of Rice Flour Yeast Breads: Sensory Evaluation,” Journal Food Science, Vol. 56, No. 3, 1991, pp. 751-759. doi:10.1111/j.1365-2621.1991.tb05374.x
NOTES
*Corresponding author.