Food and Nutrition Sciences
Vol.3 No.12(2012), Article ID:25264,12 pages DOI:10.4236/fns.2012.312212
Forbidden Fruit Tastes the Sweetest—A Study of Norwegians’ Consumption Pattern of Chocolate, Sweets, Salty Snacks, Soft Drinks and the Like
![]()
National Institute for Consumer Research (SIFO), Oslo, Norway.
Email: annechen.bugge@sifo.no
Received September 10th, 2012; revised October 18th, 2012; accepted October 25th, 2012
Keywords: Advertising; Age; Agency; Class; Consumption; Food Cultural Codes; Gender; Health; Marketing; Nutritional Policy; Pseudo Foods; Societal Structures
ABSTRACT
The theme of this study is eating and drinking patterns for products of which the health authorities want the Norwegian people to reduce their consumption. Although consumption development has shown positive trends over the past few years, Norwegians still have a much higher intake of such products than what is advisable. The study showed that only a small proportion had not eaten chocolate, sweets, sweet pastries, salty snacks etc. in the last seven days. Young people, men, people with low education and people living in households with children had the highest eating and drinking frequency of these kinds of products. Gender and age had the strongest impact on eating and drinking frequency. However, women had a higher eating rate of chocolate and sweets, and men had a higher eating and drinking frequency of salty snacks and sugary soda. People with low education had a considerably higher frequency of drinking sugary soda than people with high education. Among those who ate these products weekly, there were many who expressed that they would prefer to avoid such products, but that they were often tempted. Among those who ate these products a few times a month or less, few said that they did not like chocolate, sweets, etc. The main reason for having a relatively low eating and drinking frequency was that they perceived such products as unhealthy and fattening. Although there were only a few in the group of respondents who were concerned with healthy eating that had not eaten any of the listed products in the past seven days, this group had a significantly lower frequency of eating chocolate, sweets, etc. than the group that was not concerned with this. It was also clear that people who were health conscious to a greater extent limited eating of such products to the weekends and special occasions than those who were not. In order to succeed in reducing eating and drinking frequency of these products, it will be necessary to draw attention to product availability and social acceptance.
1. Introduction
The development in the Norwegian diet has shown many positive features over the last decades. Consumption of fruits and vegetables has increased significantly, and the consumption of sugar and fat is reduced. In spite of these developments the diet still contains too much fat, sugar and salt, and too little fruit and vegetables for a large segment of the population [1]. Figures from Statistics Norway (2010) showed that the average Norwegian eats about 30 kg sweets, ice cream and chocolate, and 19 kg salty snacks and French fries during a year [2]. Furthermore, the average Norwegian drinks about 64 litres of sugary soda.
In 2007 the Norwegian government made a Plan of action to improve the diet in the population in the period 2007 to 2011 [3]. In the plan it was stated that it was necessary to use several type of societal strategies and measures in order to succeed in nutrition work. One of the strategies that was emphasised was to improve the availability of healthy food products in e.g. kindergartens, schools, work places and market places. Another one was to improve consumer knowledge with clear, easily understood and uniform information on diet and nutrition. It was also formulated several measures for these strategies. One example is improving labelling and nutritional declaration of food products. Another one was to consider introduction of restrictions on advertising unhealthy food aimed children and young people. Furthermore, ministries were responsible for studying the possibilities of the use of economic incentives to promote a healthy diet. A prioritised (quantitative) objective was to reduce the percentage of people who had more than 10% of their intake of calories respectively from sugar and saturated fat. And also to reduce the percentage of people who drank soft drinks daily. In order to succeed with these aims, it was stated that the government should implement the plan within the scope of the annual state budget, grant schemes and relevant parliamentary documents. And interministerial coordination group would also follow up the plan.
In recent decades food high in sugar, fat and salt has been considered the enemy [4-6]. A high intake of this type of food and beverages is seen in connection with increased risk of overweight, obesity and various lifestyle diseases. Over the years overweight and obesity have become a larger problem in Norway. In 2002 a 40-year-old man weighed on average 5 kg more than in the 1980s. For women the difference was 5.8 kg. The proportion of adults with a BMI of 30 kg/m2 or more was between 14 to 22 percent for men, and between 13 to 20 percent for women. 40-year-olds with higher education were less obese than the groups with low education [7]. Among Norwegians aged 8 to 9, 16 - 18 percent were overweight. Girls were slightly more overweight than boys [8].
Considering the attention overeating of products rich in sugar, fat and salt is given in the public sphere, surprisingly few studies have been carried out that have explored the consumption patterns of chocolate, sweets, salty snacks and sugary soda in a Norwegian context. Consequently, the aim of this study is to contribute some new perspectives on the consumption of this type of food and drink. Therefore we have looked into details of the eating and drinking pattern of this kind of products: How often and on what occasions do people eat or drink this type of products? What differences are found between different social groups—gender, age, socioeconomic status, household type and residence? What characterises the preferences, priorities and practices among those who weekly eat this type of products? And what characterises the preferences, priorities and practices among those who eat such products only a few times a month or less? And how does interest in healthy eating affect the consumption pattern of products high in sugar, fat and salt? However, the purpose was not to explain discrepancies between attitude and action, but to increase our understanding of why sweet, salty and fatty has become such a big challenge for the Norwegian health authorities.
2. Methods
2.1. Investigating Methods
The web-based survey was conducted in November 2009. Survey invites were sent out via e-mail. These surveys are similar to postal surveys in that they are self-administered. In the web-based surveys NorStat Norge has a panel of 80,000 potential respondents. NorStat is a professional market research company. They treat their participants with the greatest respect—beyond adhering to industry guidelines and complying with national laws and regulations.
2.2. Sample Selection
A random sample of the potential respondents was selected to participate in the study. The participants of the panel have all access to internet. This means for instance that compared to the total population the oldest age groups are somewhat under-represented in the panel, and people with higher education are slightly over-represented. Figures from 2010 show, however, that 90 percent of the Norwegian population has internet access [9]. The sample is weighted by gender, age and region in order to get a sample which is close to the population. After weighting procedure, the education level in the sample is quite similar to the population distribution (Table 1). In total 1445 respondents participated in the study at the age of 16 to 80 years. Younger people than 16 years old would also been interesting to look at because of the thematic, but this were not possible this time. The response rate was about 40%.
2.3. Statistical Analysis
In the survey the respondents were asked about their eating and drinking pattern of selected products. Furthermore, they had to take a position on a series of statements about their food and eating habits. Statistical analysis was carried out using SPSS. The analysis is based on simple frequency distributions and bivariate analy-
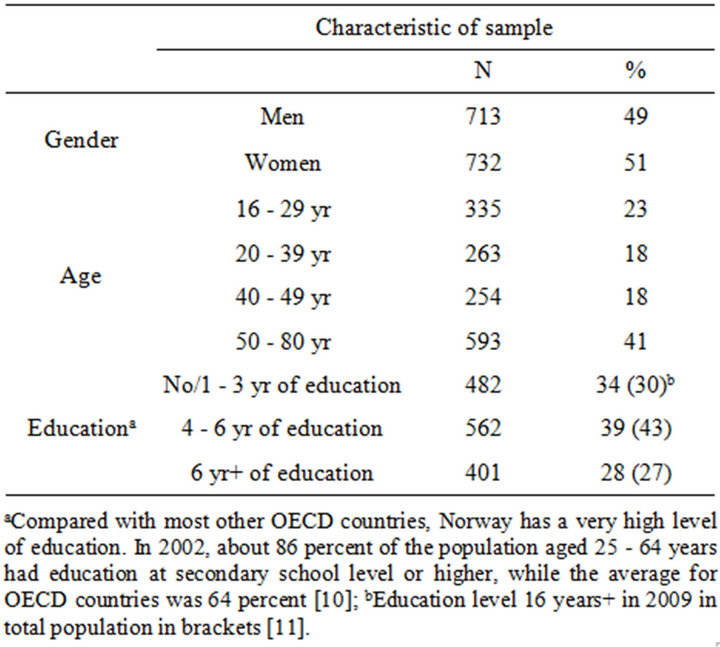
Table 1. Characteristic of sample (N = 1445). Weighted by gender, age and region.
ses, which are all presented in figures. The level used to determine statistical significance was p < 0.05. In the bivariate analyses the tests are chi-square-tests and in the regression analyses the significance test are T-tests. In order to get a more general picture of unhealthy eating, we also computed an index of the eating frequencies of the products. For this purpose we conducted an ordinary regression analysis.
3. Results
The survey showed that only 6 percent of the respondents had not eaten chocolate, sweets, sweet pastries or salty snacks in the last seven days. More than half the population had eaten chocolate once a week or more. Four in ten had eaten sweets or salty snacks weekly. Three in ten ate sweet pastries or drank sugary soda weekly (Figure 1).
However, the survey showed that gender, age, education level and type of household had an impact on eating and drinking frequency.
3.1. Who Eats What and How Often
There was no difference between women and men in the frequency of eating sweet pastries. However, more women than men ate chocolate or sweets once a week or more. Conversely, more men than women ate fast food and salty snacks weekly. It was also far more men than women who drank sugary soda weekly (Figure 2).
Young people had a higher eating and drinking frequency of all the mentioned products except sweet pastries. Seven in ten young people ate chocolate weekly, compared to four in ten in the age group 50 years or more. Furthermore, young people also ate more sweets. However, it was especially salty snacks, fast food and sugary soda that young people had a significantly higher intake than adults (Figure 3).
Among those with higher education, the proportion who drank sugary soda daily was considerably lower compared to those with low education (Figure 4).
People living in households with children had a higher eating and drinking frequency for all the mentioned products than people living without children. The exception was sweet pastries (Figure 5).
3.2. What Was the Occasion for Eating This Type of Products the Last Time
When asked what had been the occasion for eating this type of products the last time, responses showed that few had replaced an ordinary meal with chocolates, sweets, sweet pastries and salty snacks. Most described the occasion last time they had eaten chocolate, sweets or salty snacks as a treat. It was also quite a few who said that they had indulged themselves with chocolate or sweets as weekday treat. Moreover, there were also some who said there had been no special occasion for eating chocolate, sweets, sweet pastries or salty snacks the last time. Almost as many said the occasion had been a celebration (Figure 6).
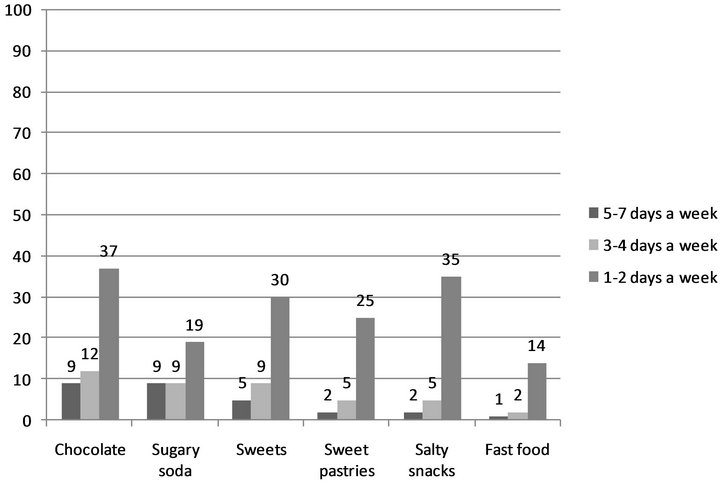
Figure 1. Eating and drinking frequency of chocolate, sugary soda, sweets, sweet pastries, salty snacks and fast food. N = 1445. Percent. 2009. WEB.
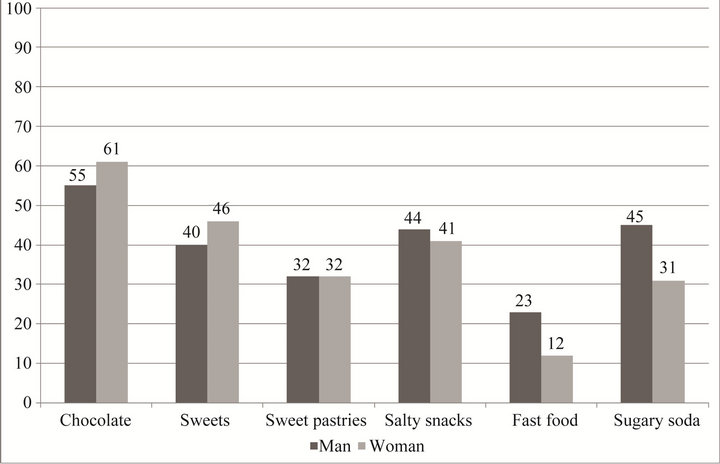
Figure 2. Percentage who ate this kind of products weekly. By gender. N = 1445. Percent. 2009. WEB.
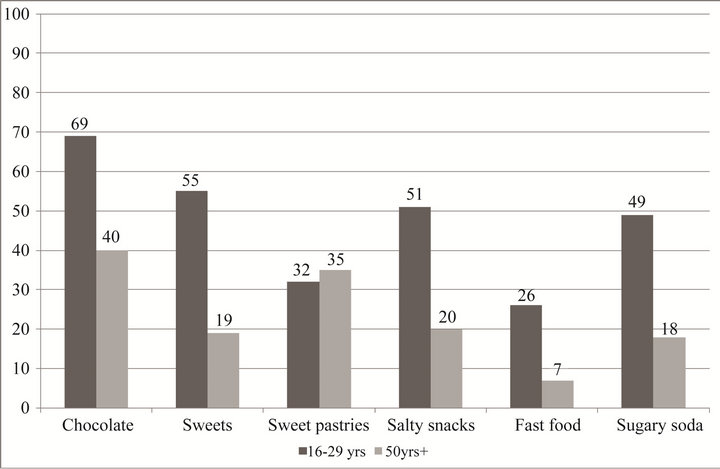
Figure 3. Percentage who ate this kind of products weekly. By age. N = 1445. Percent. 2009. WEB.
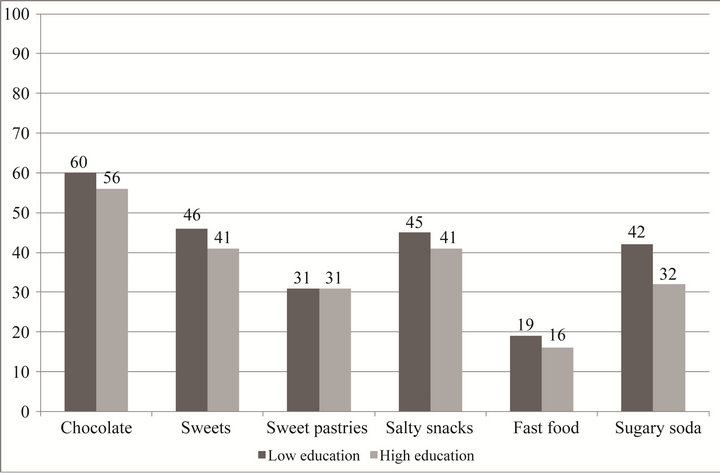
Figure 4. Percentage who ate this kind of products weekly. By education. N = 1445. Percent. 2009. WEB.
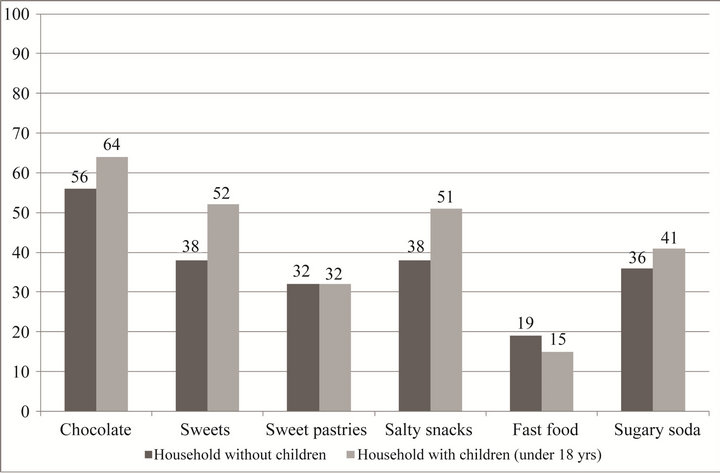
Figure 5. Percentage who ate this kind of products weekly. By household type. N = 1445. Percent. 2009. WEB.
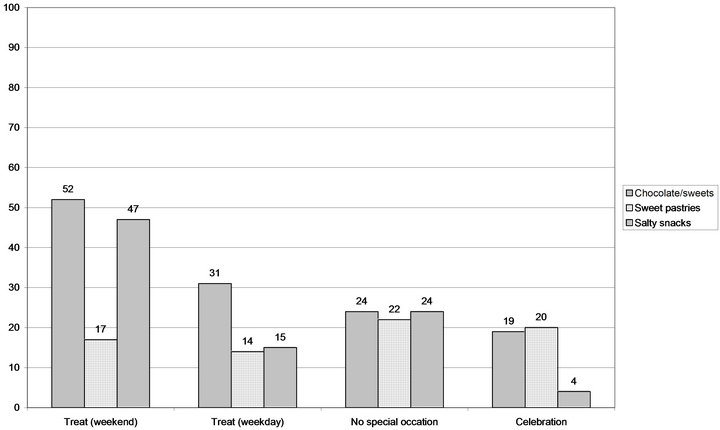
Figure 6. What was the occasion that you ate these products last time (It was given a total of 9 possible answers to this question: weekend treat, weekday treat, celebration, gift, comfort/encouragement, reward, snack/eaten between the meals, replacement of a meal). N = 575 (chocolate), N = 840 (sweet pastries), N = 836 (salty snacks). Percent. 2009. WEB.
3.3. What Was the Occasion for Eating This Type of Products the Last Time in Various Social Groups
The answers to the question of what had been the occasion for eating the listed products last time varied in different social groups. More women than men said that the occasion for eating chocolate and sweets last time had been a celebration. Furthermore, there were more women than men who described the occasion as comfort or consolation. More men than women said there had been no special occasion last time they had eaten sweet pastries and salty snacks.
Young people were more likely than the population as a whole to describe the occasion for eating chocolate and sweets last time as a weekday treat. There were also more young people than the population as a whole who thought the occasion had been comfort or consolation. The proportion of young people who said the occasion had been a reward was also higher compared to the population as a whole.
People living in households without children were more likely to describe the last time they had eaten chocolate or sweets as a weekday treat. Conversely, there were more people living in households with children who described the occasion as a weekend treat.
There were more people with low education than with higher education who said the occasion for eating sweets or chocolate last time had been comfort or consolation.
3.4. How Is Weekly Eating and Drinking Frequency of This Type of Products Explained
Among those who ate chocolate, sweets, sweet pastries or salty snacks weekly, there were many who explained high eating frequency with reference to fondness for this type of products: “I love …” (Figure 7). Somewhat fewer said the same about sugary soda.
There were quite a few who said they ate chocolate, sweets, and salty snacks on weekdays as well as at weekends. This was also the case for sugary soda.
Four in ten thought that the statement: “I would prefer to avoid eating sweets, but I am often tempted” fitted well with their own eating pattern. It was almost as many who said the same about chocolate and salty snacks. Somewhat fewer said this about sweet pastries and sugary soda.
Two in ten said that they got bad conscience when they ate sweets, chocolate, sweet pastries or salty snacks.
3.5. How Is Weekly Eating and Drinking Frequency of This Type of Products Explained in Various Social Groups
Women were more likely than men to say that they would prefer not to eat sweets, chocolate and salty snacks, but they were often tempted. Moreover, more women than men said this about chocolate and salty snacks. Women were also more likely than men to say that they got bad conscience when eating or drinking this type of products.
Young people were more likely to say that they had this kind of products on weekdays as well as at weekends than other age groups. They also to a greater extent explained weekly eating and drinking frequency by saying that they “loved” these kinds of products.
People with low education also to a greater extent said that they “loved” sweets, chocolates, sweet pastries, salty snacks and sugary soda compared to those with higher education. Moreover, they were also more likely to say that they ate these products both on weekdays and at weekends.
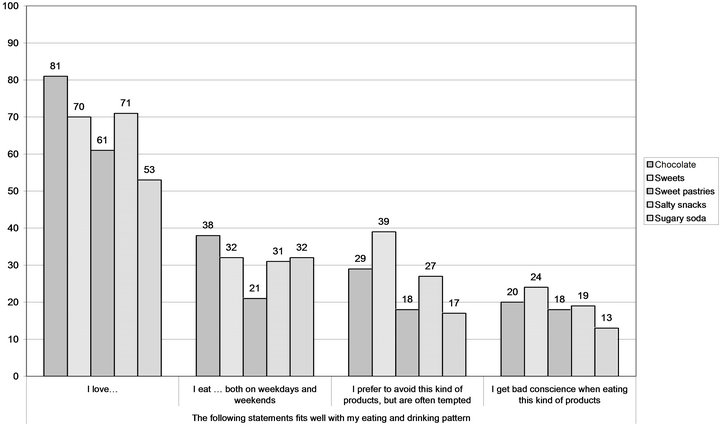
Figure 7. Reasons for eating and drinking this kind of products weekly. N = 749 (chocolate), N = 527 (sweets), N = 472 (sweet pastries), N = 536 (salty snacks), N = 469 (sugary soda). Percent. 2009. WEB.
3.6. How Is a Low Eating and Drinking Frequency of This Type of Products Explained?
There were few who explained that a relatively low eating and drinking frequency was due to not liking this kind of products. The exception was sugary soda. Among those who drank this a few times a month or less, it was half of the respondents who explained that they were not fond of this type of drink (Figure 8).
The most important explanation for eating and drinking this kind of products monthly or more seldom was that they saw this kind of products as unhealthy and fattening. The respondents were most sceptical of sugary soda. This was followed by sweets. Somewhat fewer said they avoided salty snacks, sweet pastries and chocolate because they perceived it as unhealthy.
3.7. How Is a Low Eating and Drinking Frequency of This Type of Products Explained in Various Social Groups?
More women than men said that they limited the eating frequency for sweets out of fear of gaining weight. The same pattern emerged for the reasons for having a relatively low eating and drinking frequency for chocolate, sweet pastries, salty snacks and sugary soda.
Young people explained to a lesser extent low eating frequency for these products with fear of putting on weight than the other age groups. The same pattern emerged for the reasons for having a relatively low eating frequency for sweet pastries and salty snacks.
There were more far more with higher education than with low education who said that low eating frequency for sweets had to do with the products being unhealthy. The same pattern emerged for the reasons for having a low eating frequency for sweet pastries and salty snacks. As for chocolate, there were far more of those with higher education, compared to those with low education who said they avoided all such products because they were unhealthy.
3.8. To What Extent Do Interest in Healthy Eating Affect the Eating and Drinking Frequency of This Type of Products
The study showed that there has been a significantly increasing interest in healthy eating in the last couple of years. Seven in ten said that this was something they put great emphasis on. Four in ten said that they particularly emphasised that the food and beverages they bought contained little sugar. Three in ten said the same about fat. Women were more concerned about the health aspects of food and beverages than men. People with higher edu-
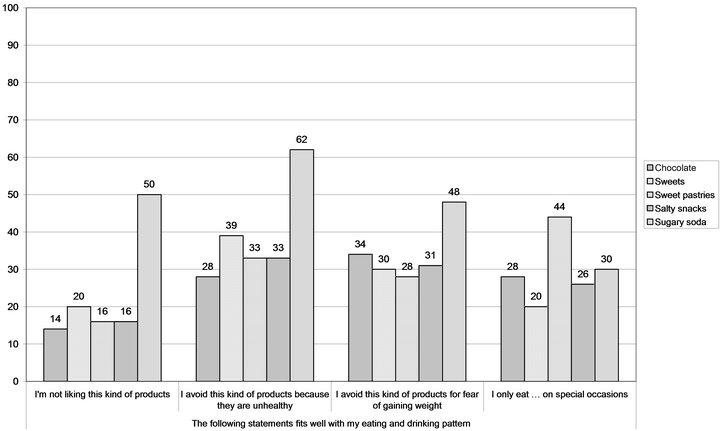
Figure 8. Explanations for eating or drinking this kind of products several times a month or more seldom. N = 644 (chocolate), N = 895 (sweets and salty snacks), N = 958 (sweet pastries), N = 962 (sugary soda). Percent. 2009. WEB.
cation were also far more concerned about this than those with lower education. The young were considerably more concerned about food being cheap than other age groups. The most important motivational factor for healthy eating was to achieve good health. Then followed avoiding overweight/obesity and to look good. The young put more emphasis on the latter than the other age groups.
There is a widespread notion that there is little correspondence between people’s stated interest in healthy food and what they actually eat. This study indicates, however, that this is not necessarily the case. The group of respondents who said they were concerned about healthy eating, had a far lower eating and drinking frequency of all the products than the group of respondents who were not concerned about that (Figure 9).
Far more in the group of respondents who were not concerned with healthy eating ate chocolate weekly, compared to those who were concerned with this. There was also far more of those who were not concerned about healthy eating that ate sweets and salty snacks weekly, compared to those who were concerned with this. Seven in ten of those who were not concerned with healthy eating drank sugary soda weekly, compared to two in ten of those who were concerned with this. Relatively few of those who were concerned with healthy eating ate fast food weekly. Among those who were not concerned with this the figure was 30 percent.
The group of respondents who were not concerned with healthy eating were more likely to say that there had been no special occasion the last time they had eaten this kind of products than the group of respondents who were concerned about this. The latter group of respondents were also more likely to answer that sweets, chocolates and salty snacks were reserved for weekends and special occasions than those who were not concerned about healthy eating (Figure 10). It should also be mentioned that among those who were not concerned with healthy eating there were more who said that the occasion last time they had eaten sweets or chocolate had been comfort or consolation than among those who were concerned about this.
3.9. What Are the Determinants of Consumption of Unhealthy Products
In order to get a more general picture of consumption of unhealthy products such as sweets, chocolate, sweet pastries, salty snacks, fastfood, sugary soda etc., we have conducted an ordinary regression analysis (OLS) (Table 2). The dependent variable is an additive index made by the frequency of eating the six unhealthy products. The
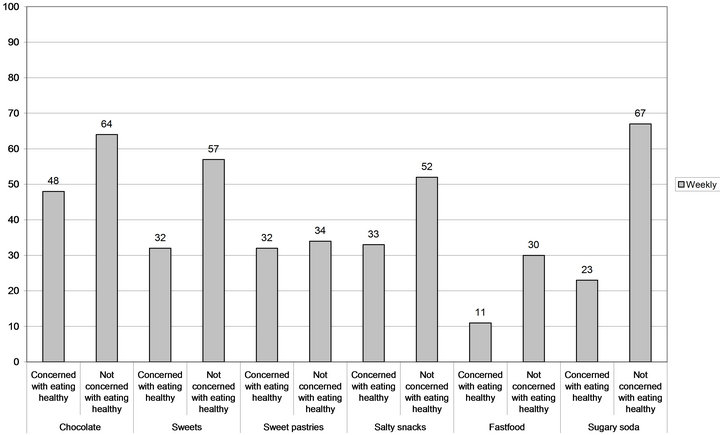
Figure 9. The percentage who weekly ate/drank chocolate, sweets, sweet pastries, salty snacks, fastfood and sugary soda. By concern with eating healthy. N = 749 (chocolate), N = 527 (sweets), N = 472 (sweet pastries), N = 536 (salty snacks), N = 469 (sugary soda). Percent. 2009. WEB.
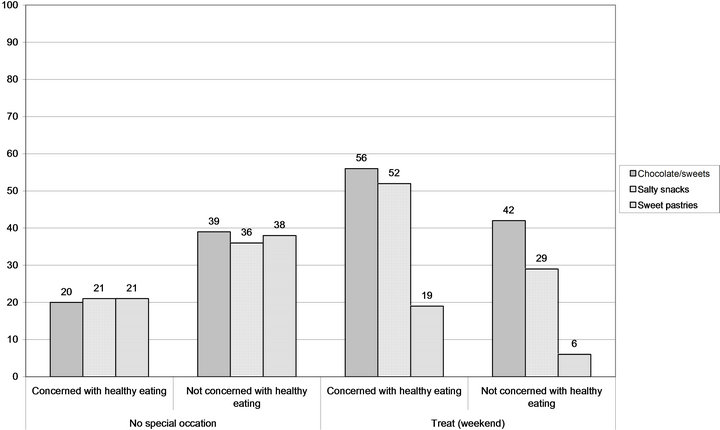
Figure 10. The reason for eating this kind of products last time. By concern with healthy eating. N = 575 (chocolate/sweets), N = 836 (salty snacks), N = 840 (sweet pastries). Percent. 2009. WEB.
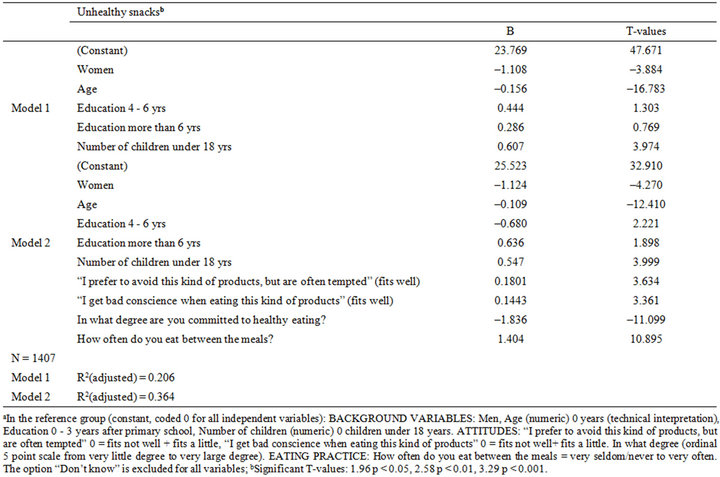
Table 2. Regression:Dependent vaiable unhealthy snacks. Unstandardized coefficientsa.
frequency values were: every day, 5 - 6 days a week, 3 - 4 days a week, 1 - 2 days a week, 2 - 3 times a month, about 1 time a month, more seldom, never, don’t know. Don’t know was excluded from the analysis. Every day was coded as 7 and never as 0. The correlation between these variables was relatively high. Testing with an exploratory factor analyses just one factor was extracted. By computing these six variables we obtained an index of UNHEALTHY SNACKS, varying from 0 to 42. This index is treated as a ratio variable, and the unstandardized coefficients are interpreted as a one unit change in the independent variable, so and so change in scores of the index.
Two models have been executed, model 1 with the background variables, and in model 2 attitudes and eating practice between meals have been added. We chose the attitude variables that were of most theoretical interests, like: “I prefer to avoid this kind of products, but are often tempted”, “I get bad conscience when eating this kind of products” and “In what degree are you committed to healthy eating?” The eating practice was in what degree they ate between meals.
All background variables are highly significant except educational level; women eat less unhealthy products than men, the eating frequencies increase the younger ones are, and the frequencies increase when the more children (under 18) there is in the household. The adjusted explained variance is pretty high (21 percent). When we introduce attitude variables and eating practice between meals, the adjusted explained variance increase to 36 percent. Introducing these new variables, the age coefficient has decreased, but is still highly significant. The change in age coefficient is due to correlations between age and some intermediate variables.
One important variable who explain the variation in the unhealthy snacks index is a positive correlation between the tendencies to eat between meals. This eating practice is not good for the intake for unhealthy snacks. There is also a negative correlation between commitment of healthy eating and the eating practice of unhealthy snacks. It is also a highly significant correlation between “those who try to avoid this kind of products, but are often tempted” and the frequencies of unhealthy snacks eating. Another positive correlation are between those who “get bad conscience when eating this kind of products” and the frequency of unhealthy snacks eating.
4. Discussion
Although there have been many positive, traceable features in Norwegians’ food and eating habits in recent years, products with high content of sugar, fat and salt still have a too dominant position [1]. As emerges from this study, very few people have not eaten chocolate, sweetssweet pastries, salty snacks etc. in the last seven days.
Even though Norway is characterized by smaller class differences than many other Western countries, several Norwegian studies have shown that a transition to a diet that the health authorities recommend has been more pronounced among people with higher education than lower education [12,13]. Moreover, women have been more willing to change their eating and drinking habits than men [14-16]. And it has also been revealed that children and adolescents have a higher intake of sugar and sugary soda than adults [1].
Our study also showed that variables such as gender, age, education and type of household had an impact on eating and drinking habits. However, gender and age had a particularly strong impact. Men and young people had the highest eating and drinking frequency for all this type of products. Furthermore, household type had a significant impact on eating and drinking frequency. Given the many studies that show that people with low education have a nutritionally poorer quality of their diet than people with high education, there was surprisingly little difference in eating and drinking frequency of the listed products between the different educational groups. However, people with low education had a significantly higher frequency of drinking sugary soda than people with high education.
Like several other studies, our study also showed that cultural and structural factors are important determinants of people’s eating and drinking patterns of chocolate, sweets, sweet pastries, sugary soda etc. Several have described how these kinds of products have become constantly more accessible in people’s everyday lives [4, 17-19]. According to Winson [18] pseudo products, that is, foods that have sugar, fats and salt as main ingredients, had an increasingly dominant position in sales and eating venues the last decades. Furthermore, there is much evidence that festival foods, that is, food and drinks which are sold in connection with bank holidays, seasonal celebrations and holidays (for instance Christmas and Easter) are sold for ever longer periods.
On the basis of our study there is also much evidence that such products to an increasing degree have become a part of everyday food and eating habits. An example is that more than half of the respondents described the occasion that they had been eating sweets or chocolate last time had been either “everyday treat” or “no special occasion”. Four in ten said the same about sweet pastries and salty snacks. Men and young people were most likely to have eaten this type of products in an everyday context.
In our study, we also looked into the explanations given for the eating and drinking pattern for the groups that ate or drank the mentioned products, weekly or several times a month or less respectively. One similarity between the two groups was that both expressed a preference for having this type of products. With the exception of sugary soda, there were few who explained low eating frequency for the various products by saying that they did not like chocolate, sweets etc. Among those who ate this type of products weekly, there were also many who just stated that they were fond of such products. However, it was clear that many of those who ate this type of product weekly really wanted to have a lower eating frequency. This was partly reflected by the fact that many said they would prefer to avoid eating or drinking chocolate, sweets, sugary soda etc., but that they were often tempted.
However, the most important explanation for eating or drinking these products a few times a month or more seldom was linked to health. Three in ten said they limited the frequency of eating chocolate, sweets, sweet pastries and salty snacks because they perceived such products as unhealthy and fattening. Six out of ten said they avoided sugary soda because it was unhealthy. Almost as many said they avoided this drink because it was fattening. Men, young people and people with low education were least concerned about the health aspects. Moreover, women to a far greater degree than men indicated that they got bad conscience from eating or drinking such products.
In recent years there has been a considerably growing interest in healthy eating among Norwegians [20]. Studies have also shown that Norwegians have a relatively high level of knowledge about what and how they should eat [5,6,20]. In a survey, for example, almost everybody (99 percent) expressed knowledge of the dietary advice that one should eat five servings of fruit and vegetables every day. Still an average Norwegian only ate 2.7 servings daily [21]. A popular interpretation of such findings is that there is a discrepancy between people’s expressed attitudes and what they actually eat. However, the groups who expressed interest in healthy eating—women, middle-aged people and people with higher education—had the highest eating frequency with an average of 3.1 servings daily.
Our study also showed that the group who stated that they were very or fairly concerned about eating healthy, had a much lower eating and drinking frequency for chocolate, sweets etc. than the group of respondents who were not concerned about this. Those who were concerned about healthy eating were also far more likely to respond that such products were reserved for weekends and special occasions than the group who were not concerned about this. Why, then, do so many people eat these products regularly?
Sugar, salt and fats are the ingredients that top the list of what Norwegians state that they preferably want to restrict. When people still have a relatively high consumption of products that have a high content of these ingredients, it must be viewed in light of the fact that we live in a food culture that constantly encourages eating such product. An account of advertising expenditure in Norwegian media, show that the products that are mostly advertised are precisely chocolate, sweets, salty snacks, fast food and sugary soda [20]. Furthermore, one can observe an increasingly aggressive marketing, pricing and product placement of such products in sales and eating venues [5,20]. Through consciously advertising such products also become invested with a range of positive significations [5,18,19,22]. No wonder, therefore, that many of those who eat this kind of products weekly answered that they really wanted to avoid this kind of products, but that they often yielded to temptation. But when you have made your bed, you have to lie in it. Around two in ten also answered that they often had bad conscience when eating such products.
The high consumption must, however, also be seen in light of the food-cultural codes and values associated with this kind of food and drink [4,23,24]. This emerges perhaps particularly clearly in the way adults socialize children and the young into the food culture. In a lot of situations what really should from a medical perspective be labelled a no, is culturally labelled yes. Sweets, chocolate, sweet pastries and sugary soda are typical examples of products that are served when one spends quality time with children, when children are celebrated, when they need comforting or rewarding [6]. Our study clearly showed that young people in a far greater extent than the other age groups linked eating sweets and chocolate into something positive—such as reward, celebration and consolation.
5. Conclusion
In order to succeed with the aim of reducing consumption of chocolate, sweets etc. it will, in other words, be necessary to make such products less accessible and less socially acceptable [19]. In this connection it should be mentioned that several social science studies of food and eating habits precisely have emphasized that increasing the nutritional quality of people’s diets often fails because one just ignores the many social and cultural meanings attached to food and drink [25-27].
In our opinion there has also been too much emphasis on the responsibility of the individual in public dietary information efforts and too little emphasis on the many social and structural limitations which influence people’s ability to make healthy choices. Therefore, more studies are needed in order to investigate how people negotiate and interpret food-cultural structures and relations.
6. Acknowledgements
This study was funded by Norwegian Research Council. The authors wish to thank colleagues at SIFO for inspiration and useful discussions during the work.
REFERENCES
- K.-I. Klepp and A. H. Rimestad, “Development in Norwegian Diet,” 2009. http://www.helsedirektoratet.no/publikasjoner/rapporter/utviklingen_i_norsk_kosthold_2009___stor_utgave_698074
- Statistics Norway, “Survey of Consumer Expenditure. Table 7. Quantity Consumption of Food and Beverages per Person per Year, by Commodity Group. 2007-2009. Kg/litre,” 2010. http://www.ssb.no/english/subjects/05/02/fbu_en/tab-2010-06-09-07-en.html
- Norwegian Ministries, “Recipe for a Healthier Diet. Norwegian Action Plan on Nutrition (2007-2011),” 2007. http://www.regjeringen.no/upload/HOD/Dokumenter%20FHA/SEM/Kostholdsplanen/IS-0238%20kortversjon%20eng.pdf
- A. James, “The Good, the Bad and the Delicious: The Role of Confectionery in British Society,” The Sociological Review, Vol. 38, No. 4, 1990, pp. 666-688. doi:10.1111/j.1467-954X.1990.tb00934.x
- A. Bugge, K. Lillebø and R. Lavik, “Food on the Run: Possibilities and Barriers for New and Healthy Fast Food Concepts,” Report No. 1-2009, National Institute for Consumer Research (SIFO), Oslo, 2009.
- A. Bugge, “Lovin’ It or Not? A Case Study of Norwegian Youth and the Culture of Fastfood,” Food, Culture and Society, Vol. 14, No. 1, 2010, pp. 71-89.
- S. Graff-Iversen, “Overweight and Obesity among Adults —Fact Sheet,” 2008. http://www.fhi.no/eway/default.aspx?pid=233&trg=MainArea_5661&MainArea_5661=5631:0:15,2689:1:0:0:::0:0
- H. Hånes, “Overweight and Obesity among Children and Young—Fact Sheet,” 2010. http://www.fhi.no/eway/default.aspx?pid=233&trg=MainArea_5661&MainArea_5661=5631:0:15,4586:1:0:0:::0:0&MainLeft_5565=5544:77252::1:5569:4:::0:0
- Statistics Norway, “ICT Usage in Households, 2nd Quarter of 2010,” 2010. http://www.ssb.no/english/subjects/10/03/ikthus_en/
- OECD, “Education at a Glance, 2010. OECD Indicators,” 2011. http://www.oecd.org/dataoecd/45/39/45926093.pdf
- Statistics Norway, “Table 1 Persons 16 Years and Older, by Education, Gender, Residence in 2011,” 2012. http://www.ssb.no/emner/04/01/utniv/tab-2012-06-19-01.html
- G. Holmboe-Ottesen, M. Wandel and A. Mosdøl, “Sosial Inequalities and Diet,” The Journal of The Norwegian Medical Association, Vol. 124, 2004, pp.1526-1528.
- E. Bere, F. J. van Lenthe, K. I. Klepp and J. Brug, “Why Do Parents with Lower Education Eat Less Fruit and Vegetables than Parents with Higher Education?” European Journal of Public Health, Vol. 18, No. 6, 2008, pp. 611-615. doi:10.1093/eurpub/ckn081
- G. Roos, R. Prättala and K. Koski, “Men, Masculinity & Food, Interviews with Finnish Carpenters and Engineers,” Appetite, Vol. 37, No. 1, 2001, pp. 47-56. doi:10.1006/appe.2001.0409
- G. Roos and M. Wandel, “I Eat Because I’m Hungry, Because It’s Incerely Yours, Good and to Become Full, Eating Voiced by Carpenters, Drivers and Engineers in Contemporary Oslo,” Food & Foodways, Vol. 13, No. 1-2, 2005, pp. 169-180.
- Ø. Ueland, “Meals and Gender,” In: H. L. Meiselman, Ed., Meals in Science and Practice. Interdisciplinary Research and Business Applications, Woodhead Publishing, Oxford, 2009, pp. 92-102.
- E. Schlosser, “Fast Food Nation. What the All-American Meal Is doing to the World,” Penguin, London, 2001.
- A. Winson, “Bringing Political Economy into the Debate on the Obesity Epidemic,” Agriculture and Human Values, Vol. 21, No. 4, 2004, pp. 299-312. doi:10.1007/s10460-003-1206-6
- D. A. Kessler, “The End of Overeating. Taking Control of Our Insatiable Appetite,” Penguin, London, 2009.
- A. Bugge, “Eat Yourself Healthy, Slim, Strong, Smart, Sexy… Is There a Diet for Everything?” SIFO-Report No. 4-2012, National Institute for Consumer Research (SIFO), Oslo, 2012.
- OFG, “General View of Fruit and Vegetable Consumption, 1999- 2009,” 2010. http://www.frukt.no/vedlegg/72396_total2009_norsk_web.pdf
- J. I. Locher, C. Y. Williams, D. Maurer and J. van Ellis, “Comfort Foods: An Explanatory Journey into the Social and Emotional Significance of Food,” Food & Foodways, Vol. 13, No. 4, 2005, pp. 273-297. doi:10.1080/07409710500334509
- N. Charles and M. Kerr, “Women, Food and Families,” Manchester University Press, Manchester, 1988.
- J. Chen, “The Taste of Sweet. Our Complicated Love Affair with Our Favourite Treats,” Crown Publishers, New York, 2008.
- S. Mintz, “Sweetness and Power. The place of Sugar in Modern History,” Penguin, New York, 1985.
- P. Caplan, “Food, Health & Identity. Approaches from the Social Sciences,” Routledge, London, 1997.
- J. Germov and L. Williams, Eds., “A Sociology of Food and Nutrition. The Social Appetite,” Oxford University Press, Oxford, 1999.