Food and Nutrition Sciences
Vol. 3 No. 10 (2012) , Article ID: 23382 , 9 pages DOI:10.4236/fns.2012.310177
Adolescents’ Estimation of Energy Content of Standard Portion Size of Foods and Its Association with Body Mass Index
![]()
1Division of Food Science, Kongju National University, Yesan, Korea; 2Department of Food and Nutrition, Kangwon National University, Samcheok, Korea.
Email: *mhkim1129@kangwon.ac.kr
Received May 21st, 2012; revised August 17th, 2012; accepted August 25th, 2012
Keywords: Knowledge of Energy Content; Portion Size; Energy Intake; BMI; Adolescents
ABSTRACT
The purpose of this study is to identify the adolescents’ knowledge of the energy content of the standard portion size of foods and to investigate the association between their knowledge and energy intake and also body mass index (BMI). A total of 251 middle school adolescents participated in this study. Participants’ knowledge was assessed based on their estimation of the energy content of the standard portion size of foods. To estimate the energy intake of the subjects, 24-h recall was used. The percentage of participants who accurately estimated (that is within 20% of the true value) the energy content of the standard portion size was calculated for each of the 32 typical foods. The food for which the most participants revealed the accurate estimation was cooked rice (39.5%). The proportion of students who overestimated the energy contents was highest for vegetables (98%), and oils and sugar (90%). The female students were more likely than males to provide the accurate estimation of energy contents for standard portion size of foods. After adjusting for age and sex, the estimation level ([estimation value/true value] × 100) of the energy content of some foods had a significant positive relationship with BMI, but had no significant relationship with reported energy intake. From these results, we concluded that the knowledge of energy content of food was poor among adolescents, with some gender difference, and that their estimation of the calorie contents of foods increased along with their BMI.
1. Introduction
In order to assist people in meeting daily nutrient recommendations, dietary intake is interpreted as two terms, serving size (standard portion size) and portion size. The serving size of a food refers to the recommended amount of food to be taken according to public guidelines on dietary intake such as the Food Pyramid. On the other hand, portion size refers to the amount of food that an individual decides to take at one time, and this is not necessarily the same as the serving size. A number of studies show that an increase in the portion size contributes to the rise in obesity [1-3]. In order to prevent obesity or underweight, therefore, an individual should choose the right amount of food and have accurate understanding of the standard portion size. In many countries, therefore, the government establishes a recommended portion size to help people meet proper energy requirements [4-6]. The food guide of the Korean Dietary Reference Intakes also provides the standard portion size of a limited number of typical Korean foods [7].
The nutrition education provided for Korean middle school students in home economics class suggests a standard diet including various nutrients based on nutritional intake standards and five basic food groups. Nevertheless, the standard portion size of various foods or portion size estimation is not included in regular classes but only in the appendix. Students are not given an opportunity to actually weigh various foods, for it is replaced by theoretical classes. Moreover, such education fails to provide the nutritional content of foods but only lists food sources of nutrients, which greatly limits students’ ability to use the knowledge in deciding what to eat and how much to eat. That is, the current education cannot help students to figure out the calories of the standard portion size for common foods and, as a result, they may eat too much or little compared to the recommended amounts of food [8,9].
Nutritional education program should not only provide general knowledge but also actually help students make the right decision about food intake. From this point of view, adolescents who are more likely to choose what to eat by themselves need help in understanding amounts and the calorie content of foods. In particular, the instruction should be practical, rather than focused on theories, utilizing visual materials such as actual pictures or food models. To that end, we need to first analyze adolescents’ knowledge regarding the energy content of the standard portion sizes of typical Korean foods in the current nutrition education environment.
The purpose of this study is 1) to identify the knowledge of the energy content of standard portion size of 32 typical Korean foods; 2) to investigate the relation between their estimation and reported energy intake and body mass index (BMI). Finally we provide data to address improving nutritional education programs for adolescents.
2. Materials and Methods
2.1. Subjects and Period
We conducted a preliminary survey on June 28, 2010 and modified and improved the questionnaire in order to distribute 360 copies to male and female students in a middle school, located in Seoul, Korea, on July 2. We collected 358 copies and excluded incomplete ones. Finally, a total of 251 copies were used for statistical analysis.
2.2. Methods and Contents
The questionnaire consisted of 3 questions for general information including body weight and height, and 32 about knowledge of energy content of the standard portion size of 32 typical Korean foods. The questionnaire also included the 24-hour recall method.
Body weight and height were obtained using a self-reported data. In order to conduct the survey on the knowledge of the energy content of standard portion size of foods, we provided 32 types of typical Korean foods with describing in household measures about the portion size of each food and allowed the subjects to freely describe energy content of each food. The 32 food items were decided based on the standard portion size of major foods provided in the home economics text book used in middle schools and the food guide of the Korean Dietary Reference Intakes [7].
The dietary survey on the types and amounts of foods taken for breakfast, lunch, dinner, and for snacks was carried out by using the 24-hour recall method by professionally trained dietitians from the morning and until bedtime on the day before the survey. Food models and pictures were used to help participants accurately recall the food they had eaten. The daily energy intake was analyzed by CAN-Pro 3.0 (The Korean Nutrition Society, 2005).
2.3. Statistical Analysis
The data were analyzed by SAS (version 9.1) so as to calculate the frequency, percentage, average, and standard deviation according to the gender. Participants’ energy estimation level was calculated by the following equation; (estimation value of the energy content of each food/true value) × 100. Based on the results of the existing research, the participants were divided into the following 3 categories: under calorie estimation (the estimation was under 20% and over from the actual calories of the standard potion size of each food), accurate calorie estimation (the estimation was within the ±20% of the actual calories of the standard potion size of each food), and over calorie estimation (the estimation was over 20% and more of the actual calories of the standard potion size of each food) [8,9]. For the significance analysis, we used the χ2-test and Student’s t-test. We analyzed the partial correlation coefficients among the calorie estimation level, energy intake, and BMI, after adjusting for age only or age and sex (in the case of total subjects). All statistical significance was considered at the level of α < 0.05.
3. Results
3.1. General Characteristics of the Subjects
Table 1 shows the general information of the subjects. The average age of participant was 14.9 years old. The height (p < 0.001) and weight (p = 0.001) were significantly higher in the male group than in the female group. Regarding the BMI (19.9 kg/m2 in male vs. 19.73 kg/m2 in female), however, there was no significant difference between the two groups.
The energy intake was significantly higher in the male group than in the female group (2213.6 kcal vs. 1872.9 kcal, p < 0.001). The energy intake based on the estimated energy requirement was 85.7% in the male group and 93.6% in the female group, showing a significant difference (p = 0.002).
3.2. Knowledge of Calorie Content about Standard Portion Size of 32 Typical Korean Foods
Table 2 and Figure 1 show the students’ knowledge levels of the calorie content of 32 typical foods. The food group for which the most participants provided the accurate estimation was grains/starches (25.6%), followed by dairy (22.5%) and protein foods (15.6%).
The food for which the most participants provided the accurate estimation was cooked rice (35.5%), followed
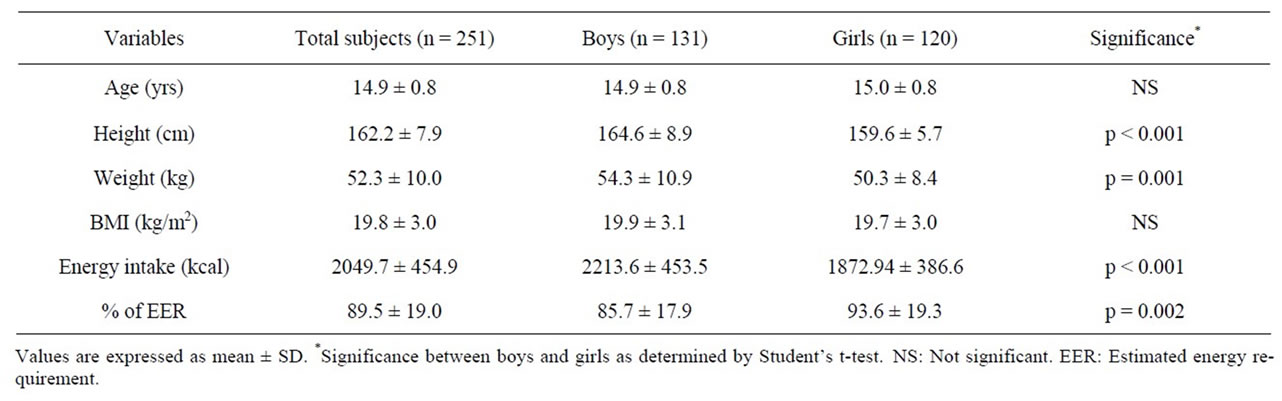
Table 1. Age, anthropometric measurements and daily energy intake of the subjects.
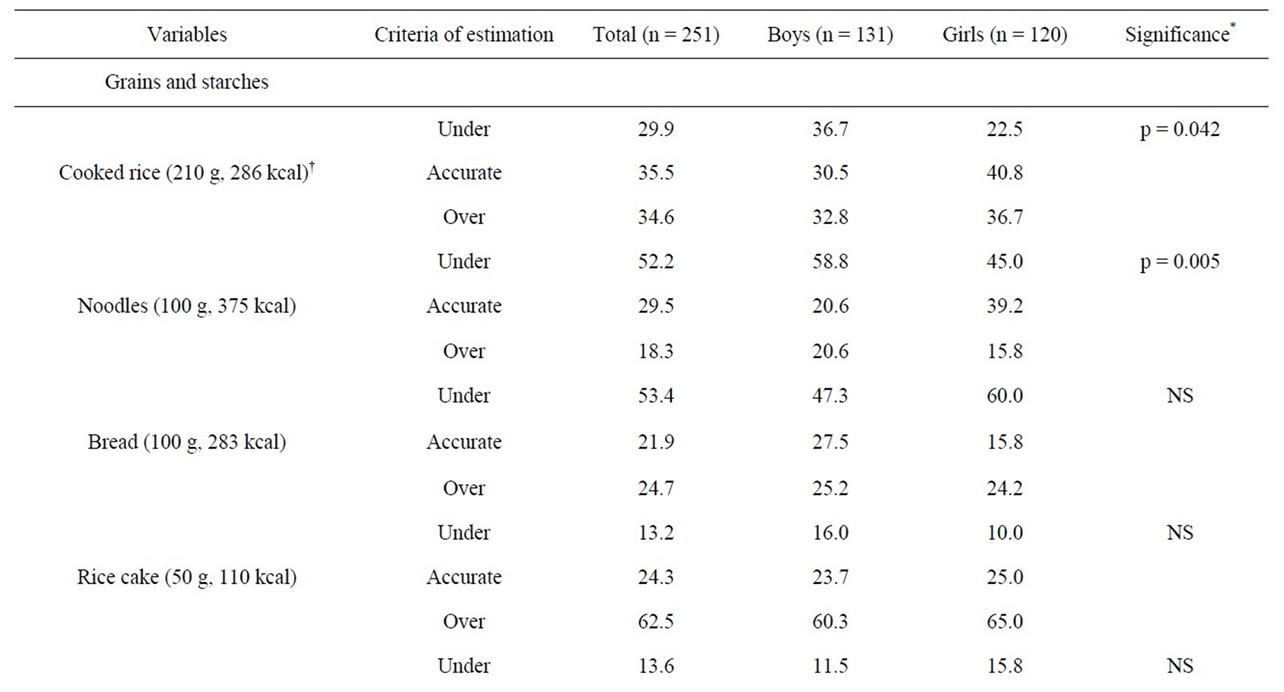
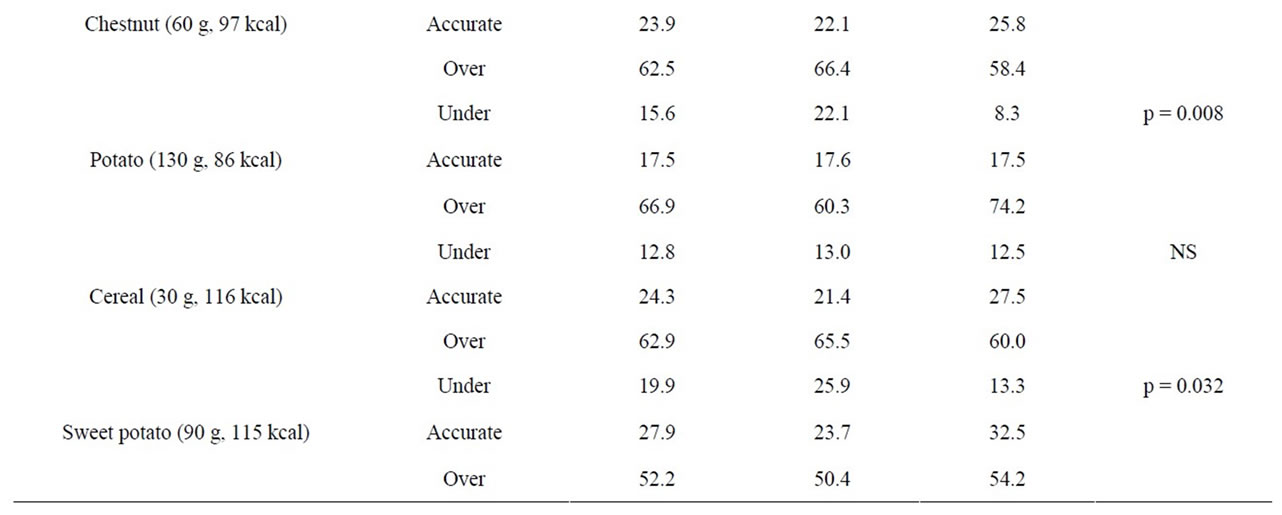
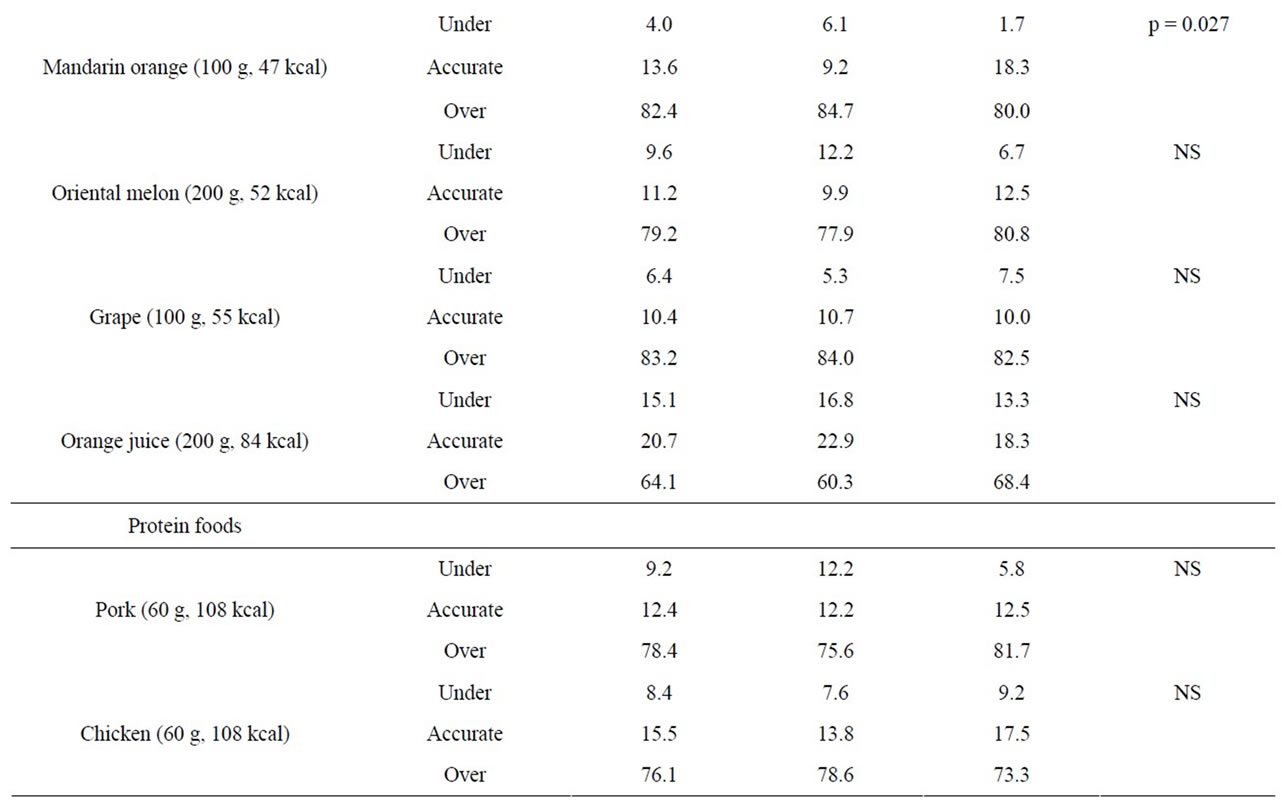
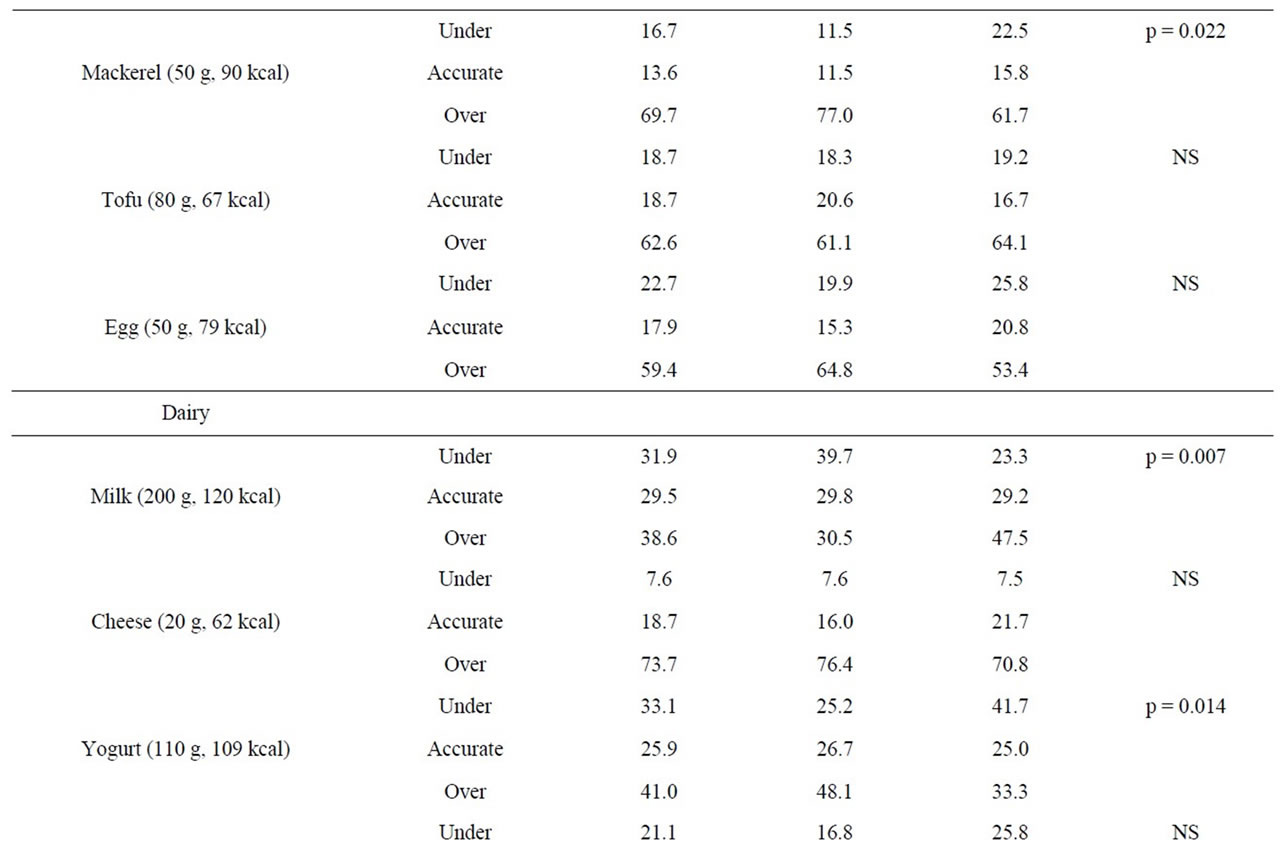
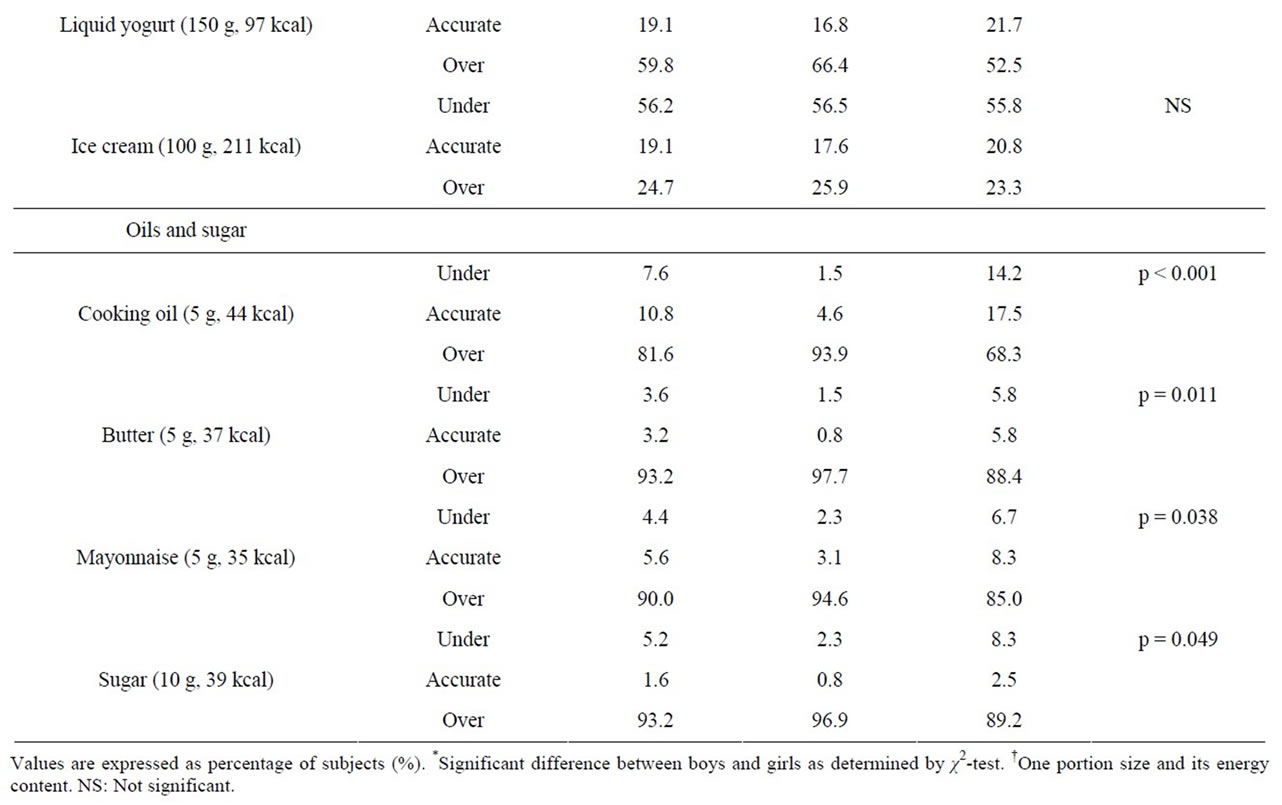
Table 2. Estimation of energy contents of standard portion size of 32 typical Korean foods.
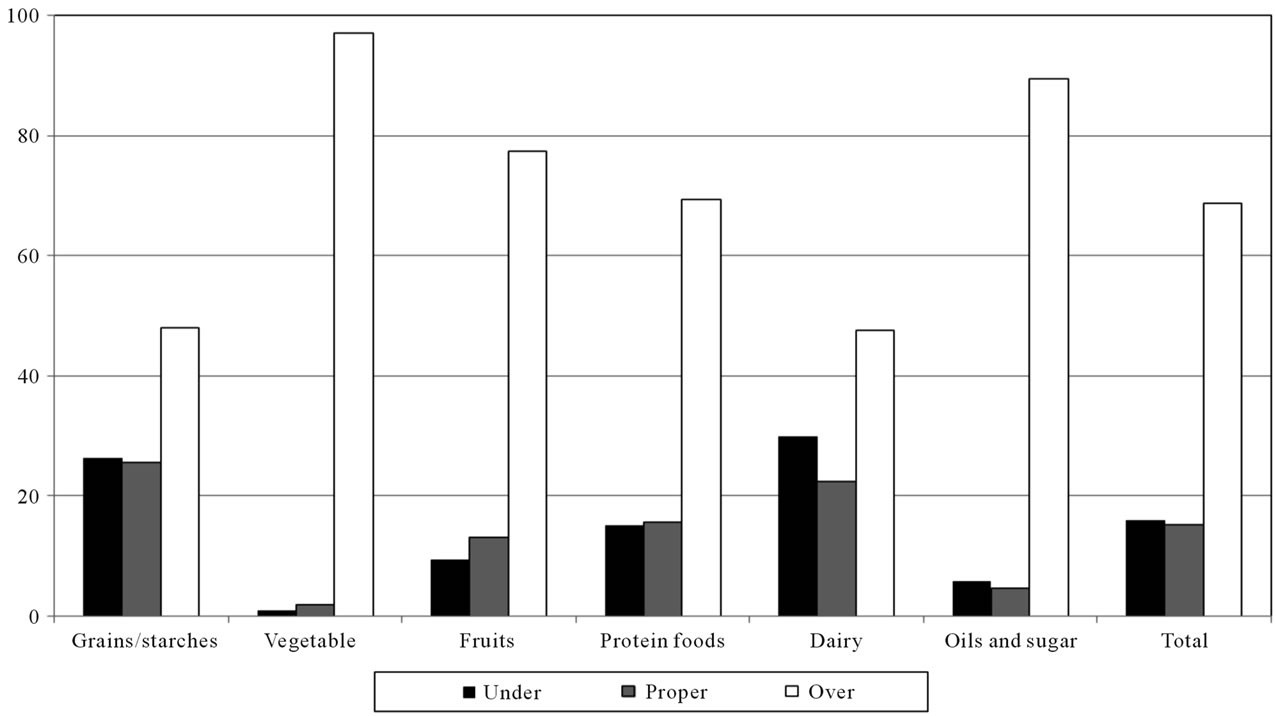
Figure 1. Estimation of calorie contents of one portion size of foods according to the food groups.
by noodles (29.5%), milk (29.5%), and sweet potatoes (27.9%). The proportion of subjects who overestimated the calorie content was highest for vegetables (98%), oils and sugar (90%), and fruits (77%). In the protein foods, 15.6% of the participants had accurate knowledge about the energy content of each protein food item. About 90% of the participants thought that the calorie contents of oils and sugar was higher than their actual calorie contents.
Among the 32 typical foods, there was a significant gender difference in the estimation of the calories of 13 foods. Compared with the male students, a higher proportion of female students provided the accurate calorie estimation for cooked rice (p < 0.05), noodles (p < 0.01), sweet potatoes (p < 0.05), spinach (p < 0.05), mandarin orange (p < 0.05), and mackerel (p < 0.05). A higher proportion of female students provided calorie over-estimation for potato (p < 0.01) and milk (p < 0.01). For yogurt (p < 0.05), cooking oil (p < 0.001), butter (p < 0.05), mayonnaise (p < 0.05), and sugar (p < 0.05), a higher proportion of male students provided calorie overestimation than that of female students.
3.3. Relationship between the Calorie Estimation of Portion Size and Energy Intake, and BMI
The relationship between estimation of calorie content for portion size of food and energy intake, and also BMI is shown in Table 3. From the results of using total subjects, there were significant positive correlations between BMI and the calorie estimation level of noodles (p < 0.05), potato (p < 0.01), sweet potato (p < 0.05), kimchi (p < 0.05), orange juice (p < 0.05), cheese (p < 0.01), yogurt (p < 0.01), ice cream (p < 0.01), cooking oil (p < 0.05), and sugar (p < 0.05). In the male group, BMI had a significant positive relationship with the calorie estimation level of cooked rice (p < 0.05), potato (p < 0.05), sweet potato (p < 0.05), and orange juice (p < 0.05). In the female group, BMI had a significant positive relationship with the calorie estimation level of noodles (p < 0.05), cereal (p < 0.05), kimchi (p < 0.05), milk (p < 0.001), yogurt (p < 0.01), liquid yogurt (p < 0.05), ice cream (p < 0.05), cooking oil (p < 0.05), and mayonnaise (p < 0.05). There was no significant correlation between energy intake and calorie estimation level, for both males and females.
4. Discussion
In this study, we investigated the knowledge of the energy content of standard portion size of 32 typical Korean foods among middle-school adolescents in the current nutrition education environment in Korea. According to the results, the knowledge of the energy content of food was poor among the middle-school adolescents. The percentage of participants who accurately estimated the energy content of the standard portion size was calculated for each of the 32 typical foods, and then the total of these percentages (ranging from 0% for kimchi and
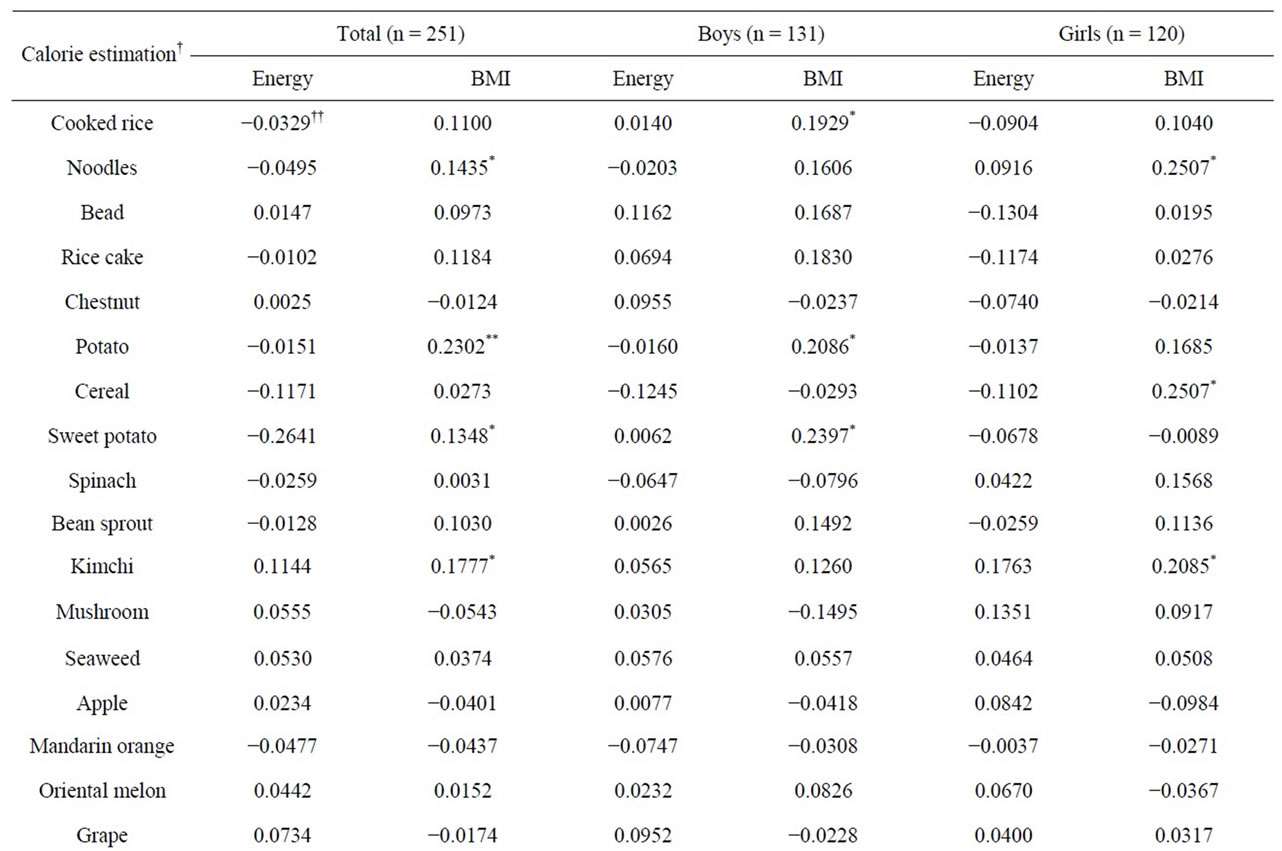
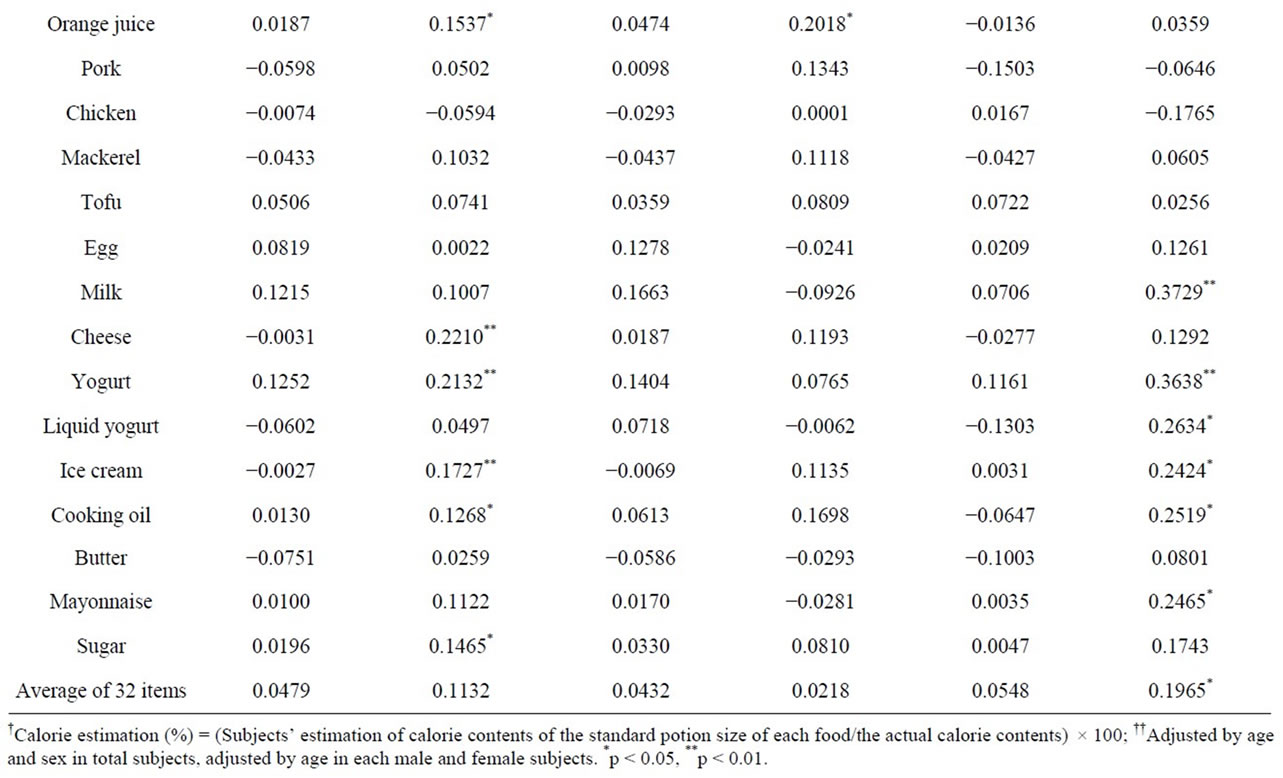
Table 3. Pearson’s partial correlation coefficient between estimation of calorie contents of portion size of foods and energy intake, and BMI.
mushroom to 35.5% for cooked rice) were averaged to be 15.3%. This finding suggests that knowledge of the energy content of food in middle school adolescent is undesirably lacking.
The participants’ knowledge of calorie content of the portion size tended to differ according to the various food groups. The food groups for which the most students provided the accurate estimation was grains/starches (25.6%), followed by dairy (22.5%) and protein foods (15.6%). Most of the students thought that the calorie contents of vegetables, oils and sugar, and fruits were higher than their actual calorie contents.
Regarding the grains/starches, about 36% of the students had knowledge of the calorie content of the standard portion size for a bowl of cooked rice. In the case of noodles and bread, over 50% of the participants estimated that the calorie content was lower than the actual calorie contents. According to the 2009 National Health and Nutrition Examination Survey (NHANES) in Korea, grains were the greatest source of energy for the Korean people [10]. In particular, people ate rice 2.6 times a day and consumed 182.3 g of rice a day, showing the greatest frequency and largest quantities among all foods. As such, the diet of the Korean people heavily depends on grains, but just 36% of this study subjects gave an accurate energy contents for rice, which may cause an imbalance of nutrients. Therefore, teenagers need to be taught about the standard portion size of grains/starches in order to consume carbohydrates, which are the major source of energy, in a balanced manner.
Particularly, kimchi is one of the most frequently consumed vegetables in Korea. However, most of the students overestimated the calorie content of kimchi, demonstrating little knowledge of the calorie content of this food. As for milk a relatively high percentage (about 30%) of the students accurately estimated the calorie content of milk. Due to recognizing the importance of dairy foods as a source of calcium, home and school meals frequently include milk to support proper growth in adolescents, and milk is usually served in a portion-size container including nutrition label, which may explain the relatively high knowledge of calorie content of milk.
An average of 97%, 90%, and 77% of the participants thought that the calorie contents of vegetables, oils and sugar, and fruits were higher than their actual calorie contents, respectively. Through these results, it can be inferred that the students thought that oils and sugar contained a high number of calories regardless of standard portion size; furthermore, they overestimated the calorie contents of vegetables and fruits due to the large portion size of these low calorie density foods. Therefore, in nutrition education programs for adolescents, both the proper portion size and calorie content of each food should be emphasized.
This study showed a significant gender difference in the calorie estimation levels of 19 items among the 32 foods. Regardless of statistical significance, the female students had a higher rate of accurate-estimation for 21 foods. This result was consistent with previous studies showing that the nutrition knowledge score of girls was higher than that of boys [11-13].
According to the recent studies, calorie awareness of food may affect the food choice. Roberto et al. found that participants who read posted calorie information ordered fewer calories [14], and Tandon et al. reported that awareness of calorie information had an effect on parents’ food choices for young children but no effect on the adults’ choice [15]. It was also found that customers who reported using the calorie information after chain restaurants were required to show the energy contents of all items on their menus purchased an average of 106 fewer calories compared with customers who did not see or did not use such information [16]. Even though the setting of these studies was restaurants, unlike the present study’s setting, calorie awareness of food can potentially affect energy intake and food choice by informed decision making. However, in this study, there was no significant relationship between the knowledge of calorie contents of portion size and energy intake, in both boys and girls. From these results, we infer the following: first, the adolescents’ knowledge of calorie contents of standard portion size of foods was too low to affect their energy intake; second, they may not apply the knowledge of calorie contents of portion size of foods to their actual dietary intake.
On the other hand, the relative % estimation of the energy contents of some foods had a significant positive relationship with BMI. Despite some differences in food items between boys and girls, students’ estimation of the calorie contents of some foods increased along with their BMI increase. This correlation analysis cannot distinguish the clear relationship between accuracy of estimation and BMI, but it does show that knowledge or awareness of calorie contents among middle school adolescents is associated with BMI. Carels et al. reported that adults in a weight loss program with a higher BMI were less accurate in energy estimation of individual foods than those with a lower BMI at baseline [17]. Also, the other study carried by Chen et al. showed BMI had a significant effect on students’ estimation of their recommended daily calorie needs as students with underweight/ normal BMI were more accurate [18].
This study has several limitations. First, the number of subjects was small compared with the initial number of respondents as we included only the subjects who provided non-missing valid data. Second, we did not ask whether the subjects actually knew the calorie contents of the portion size of 32 typical Korean foods or not, as we mainly focused on their estimation level of calorie contents of portion-size foods. Therefore, we could not exactly determine whether the subjects’ estimation level was based on knowledge or speculation. Third, we also did not survey whether the subjects used the knowledge of calorie contents when they chose the foods. As subjects’ motivation or willingness to apply their knowledge can affect their food choices, this limitation may be another reason for the non-significant relationship between energy intake and the calorie content of food.
5. Conclusion
We concluded from the results that the knowledge of energy contents of foods was poor among the middleschool adolescents, with some gender difference, and the relative % estimation of energy contents and BMI were positively correlated. Therefore, in the future, nutrition education programs should give greater attention to improving adolescents’ knowledge of calorie contents of foods and to helping them apply this knowledge in order to develop effective dietary plans. Furthermore, nutrition education programs should encourage the adolescents to apply this knowledge to make proper choices of foods so as to maintain ideal body weight.
REFERENCES
- J. H. Ledikwe, J. A. Ello-Martin and B. J. Rolls, “Portion Sizes and the Obesity Eepidemic,” Journal of Nutrition, Vol. 135, No. 4, 2005, pp. 905-909.
- J. O. Fisher, A. Arreola, L. L. Birch and B. J. Rolls, “Portion Size Effects on Daily Energy Intake in Low-Income Hispanic and African American Children and Their Mothers,” The American Journal of Clinical Nutrition, Vol. 86, No. 6, 2007, pp. 1709-1716.
- M. T. Kelly, J. M. W. Wallace, J. M. W. P. J. Robson, K. L. Rennie, R. W. Welch, M. P. Hannon-Fletcher, S. Brennan, A. Fletcher and M. B. E. Livingstone, “Increased Portion Size Leads to a Sustained Increase in Energy Intake over 4D in Normal-Weight and Overweight Men and Women,” The British Journal of Nutrition, Vol. 102, No. 3, 2009, pp. 470-477. doi:10.1017/S0007114508201960
- C. Gray, L. A. Lytle, R. Mays, G. Taylor, C. Perry and M. Story, “Foods on Students’ Trays When They Leave the Cafeteria Line as a Proxy for Foods Eaten at Lunch in a School-Based Study,” Journal of American Dietetic Association, Vol. 102, No. 3, 2002, pp. 407-409. doi:10.1016/S0002-8223(02)90094-5
- S. Y. Ko and K. W. Kim, “Nutrition Label Use, SelfEfficacy, Snacking and Eating Behavior of Middle School Students in Kyunggi Area,” Korean Journal of Community Nutrition, Vol. 15, No. 4, 2010, pp. 513-524.
- G. O. Kim and J. W. Lee, “Development and Evaluation of CAI Program on Food Guide Pagoda for Adolescents,” Chungnam Journal of Human Ecology, Vol. 19, No. 1, 2006, pp. 83-98.
- The Korean Nutrition Society, “Dietary Reference Intake for Korean,” Hanarum Publishing, Seoul, 2010. doi:10.3803/EnM.2010.25.2.98
- H. J. Sin, “A Study of Food Behavior and the Effectiveness of Nutrition Education Based on Food Weight in Middle School Male Student,” M.S. Thesis, Sookmyung Women’s University, Seoul, 1998.
- V. del Balzo, A. Scanu, S. Dernini, O. Palmieri and C. Cannella, “Mediterranean Lifestyle: Nutritional Education On-Line,” Annali Di Igiene, Vol. 21, No. 6, 2009, pp. 565-573.
- Ministry of Health and Welfare, Korea Centers for Disease Control and Prevention, “Korea Health Statistics 2009: Korea National Health and Nutrition Examination Survey (KNHANESIV-3),” Ministry of Health and Welfare, Seoul, 2010. doi:10.3886/ICPSR29022
- G. Turrell, “Determinants of Gender Differences in Dietary Behavior,” Nutrition Research, Vol. 17, No. 7, 1997, pp. 1105-1120. doi:10.1016/S0271-5317(97)00082-1
- K. Parmenter, J. Waller and J. Wardle, “Demographic Variation in Nutrition Knowledge in England,” Health Education Research, Vol. 15, No. 2, 2000, pp. 163-174. doi:10.1093/her/15.2.163
- M. E. Oakes and C. S. Slotterback, “Gender Differences in Perceptions of the Healthiness of Foods,” Psychology & Health, Vol. 16, No. 1, 2001, pp. 57-65. doi:10.1080/08870440108405489
- C. A. Roberto, P. D. Larsen, H. Agnew, J. Baik and K. D. Brownell, “Evaluating the Impact of Menu Labeling on Food Choices and Intake,” American Journal of Public Health, Vol. 100, No. 2, 2010, pp. 312-318. doi:10.2105/AJPH.2009.160226
- P. S. Tandon, J. Wright, C. Zhou, C. B. Rogers and D. A. Christakis, “Nutrition Menu Labeling May Lead to LowerCalorie Restaurant Meal Choices for Children,” Pediatrics, Vol. 125, No. 2, 2010, pp. 244-248. doi:10.1542/peds.2009-1117
- T. Dumanovsky, C. Y. Huang, C. A. Nonas, T. D. Matte, M. T. Bassett and L. D. Silver, “Changes in Energy Content of Lunchtime Purchases from Fast Food Restaurants after Introduction of Calorie Labelling: Cross Sectional Customer Surveys,” British Medical Journal, Vol. 343, 2011, p. d4464. doi:10.1136/bmj.d4464
- R. A. Carels, J. Harper and K. K. Konrad, “Qualitative Perceptions and Caloric Estimations of Health and Unhealthy Foods in Behavioral Weight Loss Participants,” Appetite, Vol. 46, No. 2, 2006, pp. 199-206. doi:10.1016/j.appet.2005.12.002
NOTES
*Corresponding author.