Food and Nutrition Sciences
Vol. 2 No. 8 (2011) , Article ID: 7881 , 6 pages DOI:10.4236/fns.2011.28110
Comparison of Response Surface Methodology and Artificial Neural Network in Predicting the Microwave-Assisted Extraction Procedure to Determine Zinc in Fish Muscles
![]()
Department of Chemistry, Faculty of Science, University of Zabol, Zabol, Iran.
Email: *m_khajeh@uoz.ac.ir
Received June 23rd, 2011; revised August 17th, 2011; accepted August 24th, 2011.
Keywords: Artificial Neural Network, Response Surface Methodology, Box-Behnken Design, Microwave-Assisted Extraction, Predictive Capability
ABSTRACT
In this paper, the estimation capacities of the response surface methodology (RSM) and artificial neural network (ANN), in a microwave-assisted extraction method to determine the amount of zinc in fish samples were investigated. The experiments were carried out based on a 3-level, 4-variable Box-Behnken design. The amount of zinc was considered as a function of four independent variables, namely irradiation power, irradiation time, nitric acid concentration, and temperature. The RSM results showed the quadratic polynomial model can be used to describe the relationship between the various factors and the response. Using the ANN analysis, the optimal configuration of the ANN model was found to be 4-10-1. After predicting the model using RSM and ANN, two methodologies were then compared for their predictive capabilities. The results showed that the ANN model is much more accurate in prediction as compared to the RSM.
1. Introduction
Microwave-assisted extraction (MAE) is an extraction technique which combines microwave and traditional solvent extraction. Study shows that the MAE has many advantages, such as shorter time, less solvent, higher extraction rate, and also better products with lower cost [1,2].
Response surface methodology (RSM) is a collection of mathematical and statistical techniques which are useful for the modeling and analysis of problems in which a response is influenced by several variables [3]. The most extensive application of RSM can be found in the industrial world, in situations where a number of input variables affect some performance measures, called the response, in ways that are not easy or unfeasible to depict with a rigorous mathematical formula-tion [4].
Artificial neural network (ANN) is a highly simplified model of the structure of a biological network [5]. The fundamental processing element of ANN is an artificial neuron (or simply a neuron). A biological neuron receives inputs from other sources, combines them, generally performs a non-linear operation on the result, and then outputs the final result [6]. The ability of the ANNs, to recognize and reproduce the cause-effect relationships through training for the multiple input-output systems makes them efficient to represent even the most complex systems [7]. The main advantages of ANN as compared to RSM include: 1) ANN does not require any prior specification of suitable fitting function, and 2) ANN also has a universal approximation capability to approximate almost all kinds of non-linear functions including quadratic functions, whereas RSM is useful only for quadratic approximations [8].
There are some studies in the literature where models were developed based on RSM and ANN using the same experimental design [8-12]. For example, Basri et al. (2007) reported the comparison of ANN and RSM in the lipase-catalyzed synthesis of palm-based wax ester, and they suggested the superiority of ANN over RSM. Both the ANN and RSM techniques were recently compared for their predictive and generalization capabilities, sensitivity analysis and optimization efficiency in fermentation media optimization [8]. It was found that the ANN predicted model has higher accuracy and better genera-lization capability than RSM, even with the limited number of experiments.
In this study, the RSM and ANN methodologies were applied for predicting the amount of zinc by flame atomic absorption spectrometry (FAAS) in fish samples. The results which were obtained through RSM were then compared with those through ANN.
2. Material and Methods
2.1. Materials
Nitric acid used was of the analytical reagent grade from Merck (Darmstadt, Germany). Reagent grade of zinc nitrate (from Merck) were of the highest purity available. A stock solution of the zinc was prepared by dissolving a proper amount of the zinc nitrate in doubly distilled water in a 10 mL flask. Dilute solutions were prepared by an appropriate dilution of the stock solution in doubly distilled water.
2.2. Apparatus
The measurements were performed with a Konik Won M300 (Barcelona, Spain) flame atomic absorption spectrometer equipped with a conventional pneumatic nebulizer, and a nebulization chamber was used for the analysis. Hollow cathode lamp for determination of zinc was used. The most sensitive wavelength for zinc at 213.9 nm was used. The flame composition was acetylene (flow rate, 1.5 L·min−1) and air (flow rate, 10.0 L·min−1). The nebulizer flow rate aspiration was kept between 5.0 and 5.5 mL·min−1.
2.3. MAE Procedure
The fish muscles were ground in a mechanical mill. An aliquot (1.0 g) of sample was transferred to the extraction vessel with 10 mL HNO3 as the extraction solvent. According to a preliminary experimental design, extractions were performed at various conditions of temperature ranging from 80˚C to 120˚C, irradiation time from 20 to 40 min, concentration of nitric acid from 1 to 3 mol·L−1, and irradiation power from 500 to 700 W. After extraction, the irradiated sample was transferred to a 10 mL volumetric flask and the volume was completed to the mark. The concentration of the analyte in this solution was analyzed by FAAS.
2.4. Experimental Design
2.4.1. Response Surface Methodology
A 3-level four factor Box-Behnken experimental design was used in this study. Irradiation power (500 W - 700 W), nitric acid concentration (1 - 3 mol·L−1), irradiation time (20 min - 40 min) and temperature (80˚C - 120˚C) were input variables, the factor levels were coded as −1 (low), 0 (central point), and 1 (high). The design of real experiments is given in Table 1.
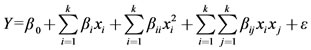
The behavior of the system is explained by the following quadratic Equation [13].
 (1)
(1)
here, Y is the process response or output (dependent variable), k is the number of the patterns, i and j are the index numbers for pattern, β0 is the free or offset term called intercept term, x1, x2, ···, xk are the coded independent variables, βi is the first-order (linear) main effect, βii is the quadratic (squared) effect, βij is the interaction effect, and ε is the random error or allows for description or uncertainties between predicted and measured value.
2.4.2. Artificial Neural Network
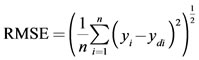
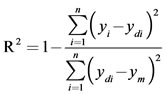
The same experimental data, which had been used for the RSM design, were also employed in designing the artificial neural network. A multi-layer perceptron (MLP) based feed-forward ANN, which makes use of the back propagation learning algorithm, was applied for modeling. The network consists of an input layer, one hidden layer and an output layer. The inputs for the network include irradiation power, nitric acid concentration, irradiation time and temperature; output is the amount of zinc in the samples. In order to determine the optimum number of hidden nodes, a series of topologies was used, in which the number of nodes was varied from 1 to 20. The structure of proposed ANN is shown in Figure 1. The hyperbolic tangent was used as the transfer function for the input and hidden layer nodes. The linear activation function is also used as the output layer activation function. The algorithm used to train ANN in this study is quick propagation (QP). This algorithm is belonging to the gradient descent backpropagation. The details of the algorithm have been reported elsewhere [14]. It was reported in literature that the quick propagation learning algorithm can be adopted for the training of all the ANN models [15]. The performance of the ANNs was statisticcally measured by the root mean squared error (RMSE), the coefficient of determination (R2) and the absolute average deviation (AAD) obtained as follows:
 (2)
(2)
 (3)
(3)
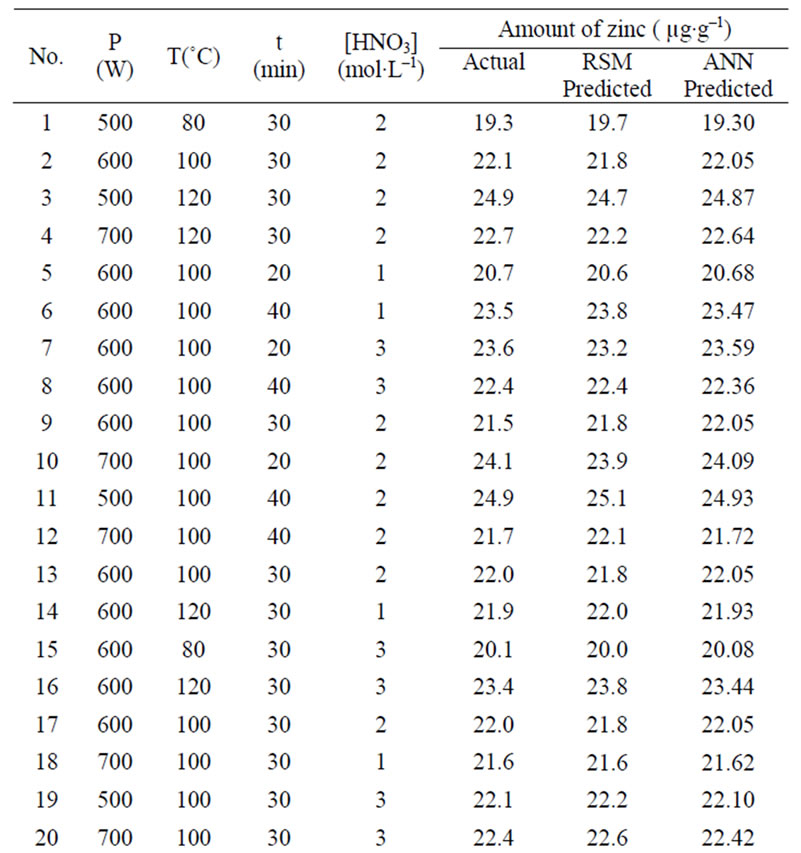
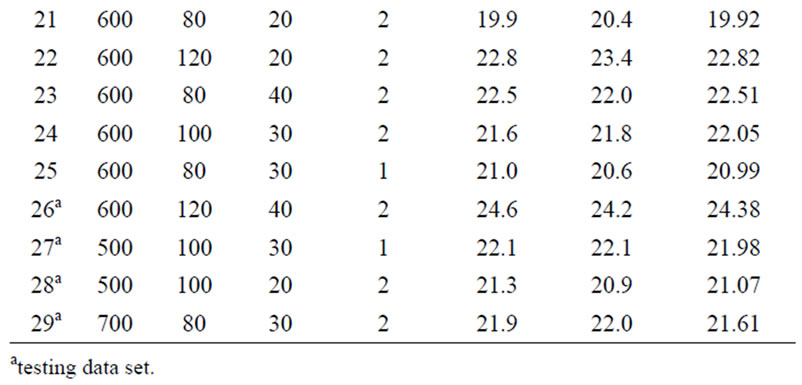
Table 1. Box-Behnken design matrix of four variables and the experimentally determined, RSM model predicted and ANN model predicted amount of zinc in the samples.
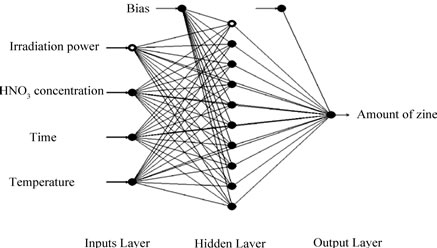
Figure 1. A multilayer feed-forward perceptron (MLP) network consisting of four inputs, one hidden layer with 10 neurons and one output.
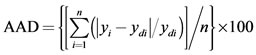 (4)
(4)
where n is the number of points, yi is the predicted value, ydi is the actual value, and ym is the average of the actual values.
3. Results and Discussion
3.1. RSM Modeling
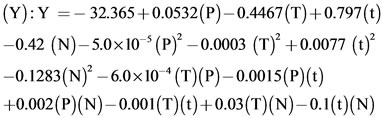
RSM was employed to develop the method for zinc determination by flame atomic absorption spectrometry in the fish samples after extraction by a microwave system. The equation below explains the relationship of the four variables, that is, irradiation power (P); irradiation time (t); concentration of nitric acid (N) and temperature (T) and amount of zinc in the samples
 (5)
(5)
Details of the RSM modeling have been published elsewhere [16].
3.2. ANN Modeling
Various topologies (from 1 to 20 hidden neurons) were examined using quick propagation (QP) algorithm. Decision on the optimum topology was based on the minimum error of testing. Each topology was repeated five times to avoid random correlation due to the random initialization of the weights [17]. After repeated trials, it was found that a network with 10 hidden neurons produced the best performance. Figure 2 illustrates the performance of the network for testing data versus the number
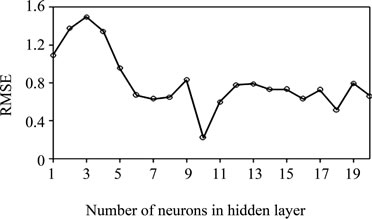
Figure 2. The performance of the network at different hidden neurons using quick propagation (QP) algorithm for testing data.
of neurons in the hidden layer. The results for training and testing data are summarized and presented in Table 2. The scatter diagram of predicted values versus actual values is also shown in Figure 3. It shows that the model prediction fits well with the experimental observations.
3.3. Comparison of RSM and ANN Models
The estimation capabilities of the techniques (RSM and ANN) were also examined in this study. For this purpose, the techniques were used to predict the responses at 29 experimental points (Box-Behnken design matrix). The predicted responses, obtained from RSM and ANN, were then compared with the actual values. The root mean squared error (RMSE), coefficient of determination (R2) and absolute average deviation (AAD) were used together to compare the RSM and ANN. The actual and predicted values for the Box-Behnken matrix are presented in Table 1.
The comparative values of RMSE, R2 and AAD are given in Table 3. The root mean squared error (RMSE) for the design matrix by RSM and ANN is 0.3124 and 0.1583, the coefficient of determination (R2) is 0.9477
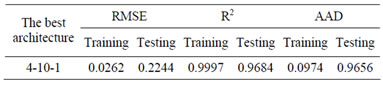
Table 2. Statistical measures and performance of QP algorithm for training, and testing data.
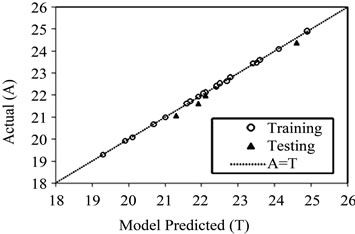
Figure 3. The scatter plot of ANN predicted values versus actual values for training and testing data set using quick propagation (QP) algorithm.
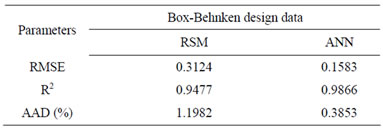
Table 3. Comparison of RSM and ANN.
and 0.9866, and the absolute average deviation (AAD) is 1.1982 and 0.3853. Figure 4 shows the comparative parity plot for the two models predictions for the BoxBehnken design matrix. The error against observation order of both the models is compared in Figure 5. These results indicate that the RSM model prediction has a greater deviation than the prediction made using the ANN model. This also means that the experimental data has been fitted with a high accuracy using the ANN model.
3.4. Analytical Aapplication
The optimized MAE method was applied to determine the amount of zinc in Schizothorax samples. The results obtained are showed in Table 4.
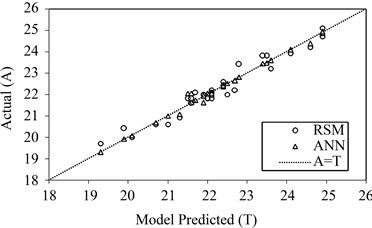
Figure 4. The scatter plot of RSM and ANN model predicted values versus actual values for Box-Behnken design matrix.
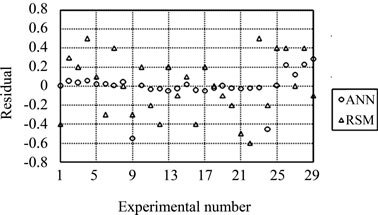
Figure 5. Comparison of observation order with residuals for Box-Behnken design matrix.
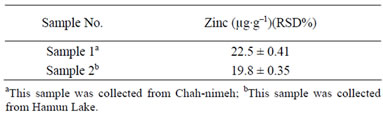
Table 4. Determination of zinc in the Schizothorax zarudnyi fish.
4. Conclusions
This paper has described the use of Box-Behnken design matrix for conducting experiments. Two models were developed for predicting the amount of zinc in the fish samples using response surface methodology (RSM) and artificial neural network (ANN). First, RSM was used for predicting the amount of zinc in the samples. Then, the independent variables, namely power, nitric acid concentration, time and temperature were fed as inputs to an artificial neural network while the output of the network was the amount of zinc. A multilayer feed-forward network was trained by the sets of input-output patterns using quick propagation algorithm. Finally, two methodologies were compared for their predictive capabilities. The present work indicates that the ANN is much more accurate in predicting the amount of zinc in comparison to the RSM.
REFERENCES
- J. Y. Hao, W. Han, S. Huang, B. Xue and X. Deng, “Micro-Wave Assisted Extraction of Artemisinin from Artemisia annua L.” Separation and Purification Technology, Vol. 28, No. 3, 2000, pp. 191-196. doi:10.1016/S1383-5866(02)00043-6
- M. Soylak, M. Tuzen, A. S. Souza, M. G. A. Korn and S. L. C. Ferreira, “Optimization of Microwave Assisted Digestion Procedure for the Determination of Zinc, Copper and Nickel in Tea Samples Employing Flame Atomic Absorption Spectrometry,” Journal of Hazardous Materials, Vol. 149, No. 2, 2007, pp. 264-268. doi:10.1016/j.jhazmat.2007.03.072
- D. C. Montgomery, “Design and Analysis of Experiments,” Wiley, Hoboken, 2004.
- P. Sharma, L. Singh and N. Dilbaghi, “Optimization of Process Variables for Decolorization of Disperse Yellow 211 by Bacillus Subtilis Using Box-Behnken Design,” Journal of Hazardous Materials, Vol. 164, No. 2-3, 2008, pp. 1024-1029. doi:10.1016/j.jhazmat.2008.08.104
- D. Bas and I. H. Boyaci, “Modeling and Optimization II: Comparison of Estimation Capabilities of Response Surface Methodology with Artificial Neural Networks in a Biochemical Reaction,” Journal of Food Engineering, Vol. 78, No. 3, 2007, pp. 846-854. doi:10.1016/j.jfoodeng.2005.11.025
- B. Manohar and S. Divakar, “An Artificial Neural Network Analysis of porcine Pancreas Lipase Catalysed Esterification of Anthranilic Acid with Methanol,” Process Biochemistry, Vol. 40, No. 10, 2005, pp. 3372-3376. doi:10.1016/j.procbio.2005.03.045
- V. K. Pareek, M. P. Brungs, A. A. Adesina and R. Sharma, “Artificial Neural Network Modeling of a Multiphase photodegradation System,” Journal of Photochemistry and Photobiology A, Vol. 149, 2002, pp. 139-146.
- K. M. Desai, S. A. Survase, P. S. Saudagar, S. S. Lele and R. S. Singhal, “Comparison of Artificial Neural Network (ANN) and Response Surface Methodology (RSM) in Fermentation Media Optimization: Case Study of Fermentative Production of Scleroglucan,” Biochemical Engineering Journal, Vol. 41, No. 3, 2008, pp. 266-273. doi:10.1016/j.bej.2008.05.009
- M. Basri, R. R. Zaliha, A. Ebrahimpour, A. B. Salleh, E. R. Gunawan and M. B. Abdul-Rahman, “Comparison of Estimation Capabilities of Response Surface Methodology (RSM) with Artificial Neural Network (ANN) in LipaseCatalyzed Synthesis of Palm-Based Wax Ester,” BMC Biotechnology, Vol. 7, 2007, pp. 53-63. doi:10.1186/1472-6750-7-53
- W. Lou and S. Nakai, “Application of Artificial Neural Networks for Predicting the Thermal Inactivation of Bacteria: A Combined Effect of Temperature, pH and Water Activity,” Food Research International, Vol. 34, No. 7, 2001, pp. 573-591. doi:10.1016/S0963-9969(01)00074-6
- J. Bourquin, H. Schmidli., P. V. Hoogevest and A. Leuenberger, “Advantages of Artificial Neural Networks (ANNs) as Alternative Modeling Technique for Data Sets Showing Non-Linear Relationships Using Data from a Galenical Study on a Solid Dosage Form,” European Journal of Pharmaceutical Sciences, Vol. 7, No. 1, 1998, pp. 5-16. doi:10.1016/S0928-0987(97)10028-8
- S. Agatonovic-Kustrin, M. Zecevic, L. G. Zivanovic and I. G. Tucker, “Application of Artificial Neural Networks in HPLC Method Development,” Journal of Pharmaceutical and Biomedical Analysis, Vol. 17, No. 1, 1998, pp. 69-76. doi:10.1016/S0731-7085(97)00170-2
- E. Bayraktar, “Response Surface Optimization of the Separation of DL-Tryptophan Using an Emulsion Liquid Membrane,” Process Biochemistry, Vol. 37, No. 2, 2001, pp. 169-175. doi:10.1016/S0032-9592(01)00192-3
- A. Ghaffari, H. Abdollahi, M. R. Khoshayand and I. Soltani Bozchalooi, “Performance Comparison of Neural Networks,” Environmental Science & Technology, Vol. 42, No. 21, 2008, pp. 7970-7975. doi:10.1021/es801372q