Food and Nutrition Sciences
Vol. 2 No. 7 (2011) , Article ID: 7229 , 8 pages DOI:10.4236/fns.2011.27095
Characterization of Vegetable Oils by Fluorescence Spectroscopy
![]()
1Laboratory of Spectroscopy of Atomic & Molecular and Applications (LSAMA), Faculty of Sciences of Tunis, University of Tunis, Tunis, Tunisia; 2Centre for Atomic Molecular Physics and Quantum Optics (CEPAMOQ), Faculty of Science, University of Douala, Douala, Cameroon; 3Laboratoire U2S Ecole Nationale d'Ingénieurs de Tunis, University of Tunis, Tunis, Tunisia.
Email: *yvonmbesse@yahoo.fr
Received March 23rd, 2011; revised July 11th, 2011; accepted July 18th, 2011.
Keywords: Vegetable Oils, Oxidation, Refined and Unrefined Oils, Unsaturated Fatty Acid, Fluorescence Spectroscopy and Principal Component Analysis (PCA)
ABSTRACT
Results presented in this paper show the ability to analyze vegetable oils with very cheap and easy method based on fluorescence spectroscopy. We have recorded, with a very simple experimental set up, fluorescence spectra for several vegetable oils at excitation wavelength lex = 370 nm. After deconvolution, using a Lorentzian profile, and identi-fication of the stripes forming the spectra, a normalization of the intensities was made with respect to the vitamin E band with l = 525 nm taken as reference. A statistical method based on Principal Component Analysis (PCA) is used to emphasize differences between refined and unrefined oils. We also noticed a significant difference between fluorescence of the argan cosmetic oil and edible argan oil due to the heating of the second one during its preparation. Stability to thermal oxidation of high oleic sunflower oil compared to the extra virgin olive, argan cosmetic and refined corn oils is also shown.
1. Introduction
Vegetable oils are the main source of fatty acid, which are predominantly triglycerides (95% - 98%), the remaining (5% - 2%) consists of complex mixtures of minor compounds in a wide range of chemical classes [1]. The proportion of saturated and unsaturated fatty acid has an important role on the behaviour of vegetable oils. The degradation of vegetable oil quality is essentially caused by the unsaturated fatty acid oxidation which is a complex phenomenon that generates mainly hydroperoxides but also volatile compounds through a three-phase processfg: initiation, propa-gation and termination [2].
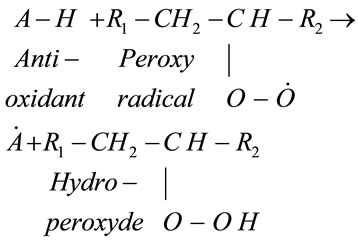
The initiation phase involves homolytic breakdown of hydrogen bond (reaction 1) triggered by initiators such as heat, free radicals, light, photosensitizing pigments and metal ions [2,3].
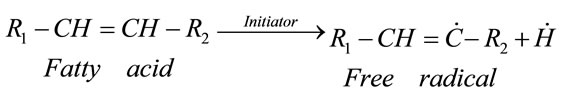 (1)
(1)
This process results in the formation of the two free radicals, both are very unstable. The first one in Reaction (1) is responsible for the production of the peroxyradicals through the following reaction with oxygen:
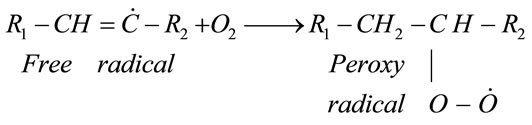 (2)
(2)
Thereafter the number of peroxyradicals grows rapidly in all oxygen-bearing systems [2] and these peroxyradicals take out hydrogen atom from an unsaturated fatty acid to form hydroperoxide (primary oxidation compound) and another free radical (reaction 3), replenishing then reaction (2).
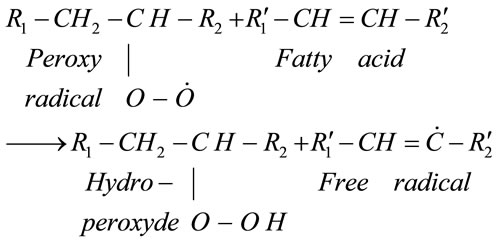 (3)
(3)
The concentration of hydroperoxide increase during this propagation stage (Reactions (2) and (3)). During the termination phase, the oxidation process continues with the transformation of hydroperoxides into secondary nonradical oxidation compounds (Reaction (4)).
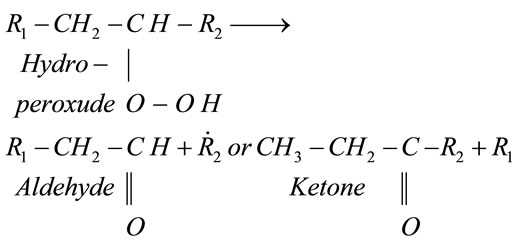 (4)
(4)
There are numerous decomposition processes [2] which lead to the formation of hydrocarbons, aldehydes, alcohols and volatile ketones through the formation of vinyl radicals. Other non-volatile secondary compounds are also formed, including non-volatile aldehydes, oxidized triglycerides and their polymers. The scenario of the oxidation of the fatty acid, resumed above, depends strongly [2] on the type of scission of double bonds in the fatty acid chain (Reaction (1)).
Natural antioxidant products exist in vegetable oils to counteract the oxidation process described above. We mention here the most important: vitamin E, phenol compounds and carotenoids [2]. Reaction (5) shows the basic mechanism which eliminates the peroxyradicals where “A-H” refers to the antioxidants.
 (5)
(5)
We use in this work the vitamin E for several reasons: it is present in important proportion in all the samples analyzed in this work as it is quite visible in all the spectra. In addition, besides it loses his antioxidant efficiency, the vitamin E is immediately regenerated by other compounds [2]. Thus the rate of vitamin E could act as a scorer for the diagnosis of the vegetable oil. Moreover the vitamin E is well documented [4] and its region of emission clearly identified.
The UV spectroscopy and the gas and liquid chromatography are the standard techniques used for oil analysis [3,5]. Several works based on techniques as: Fourier Transform Infrared Spectroscopy and Raman and Nuclear Magnetic Resonance spectroscopy [3] including fluorescence spectroscopy [6,7] have also been widely used. These different techniques require a delicate preparation of the samples and very expensive experimental set up. The objective of the present work is to show the ability of fluorescence spectroscopy to characterize vegetable oils and detect the alteration of their quality through measurements of the proportion of the oxidation and antioxidant products without any preparation of the sample and with a cheap apparatus. The effect of the temperature on the oil quality is also analyzed in detail.
2. Experimental
2.1. Samples
Several vegetable oils, coming from different regions have been analyzed in this work: sweet almond oil, corn oil, sesame oil, high oleic sunflower oil, extra virgin olive oil, argan oil, cotton seed oil, soybean oil, refined palm oil, palmist oil, rape seed oil, walnut oil, pears oil and grape seed oil. These products have been bought on the local markets or provided by the producer (in the case of extra virgin olive oil), and protected from light exposition. Fluorescence spectra were recorded without pretreatment and without dilution of the samples.
2.2. Materials and Method
Each sample was put in quartz vat and excited by a LED emitting continuously at l = 370 nm through an optical fiber, which was also used to collect the fluorescence sent to a spectrometer (OceanOptics USB 2000) coupled to a CCD array. This spectrometer can detect signal between 179 nm and 876 nm with a 0.33 nm resolution. The spectra were recorded in the 400 to 800 nm region, sheltered from the light source and using software (OOIBase 32). To insure the validity of the comparison between the different measures, each spectrum represents the average of 10 scans recorded after 100 s of excitation. We use these parameters for all the samples in order to measure in the same experimental conditions. Data analyses were done using the software Igor Pro 6.01. The statistical method based on Principal Component Analysis (PCA) is also used.
3. Results and Discussion
The spectra of all oils are gathered in the Figure 1. They present similar peaks of emission which can be regrouped in three regions associated to the emission of:
– Region I: oxidation products [7];
– Region II: vitamin E (around 525nm) [4,7];
– Region III: chlorophyll [4,7].
Identification of each region is made after deconvolution using a Lorentzian profile (Figure 2). Several tests were made with different positions for each peak present in the spectra for different sample of same oil. The wave-
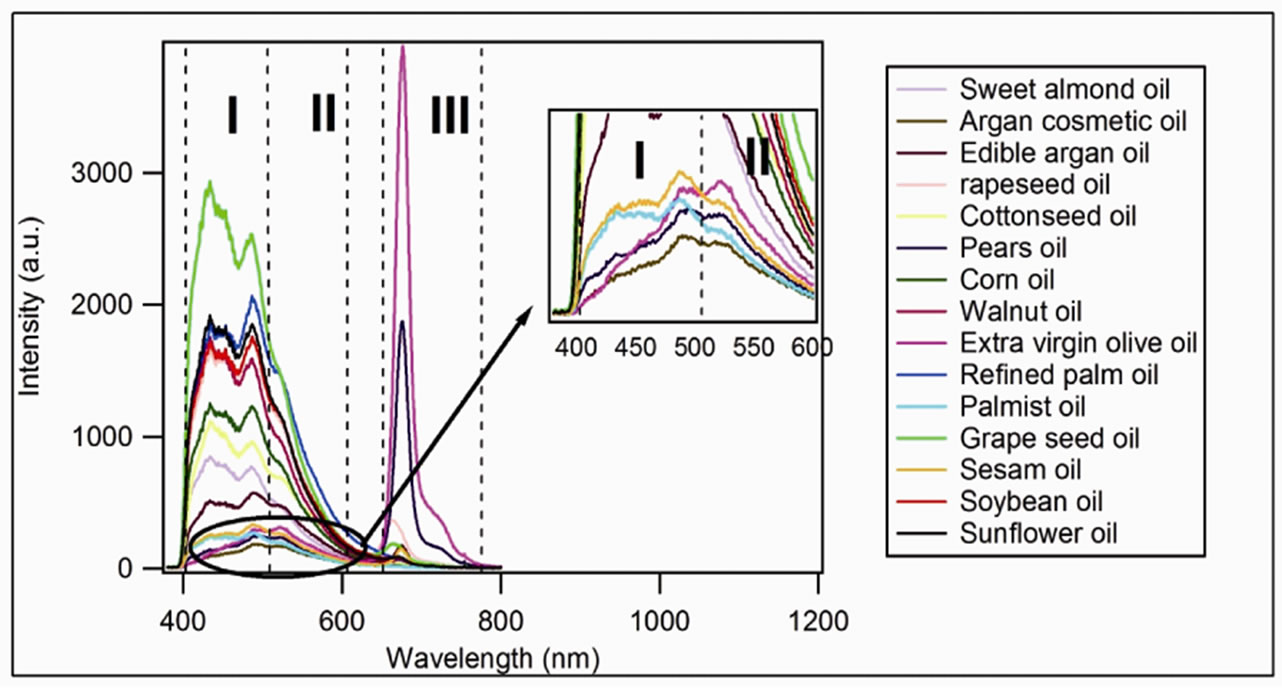
Figure 1. Oils spectra for the complete set of sample showing the different regions, I: 400 nm to 500 nm; II: 500 nm to 600 nm; III: 650 nm to 730 nm.
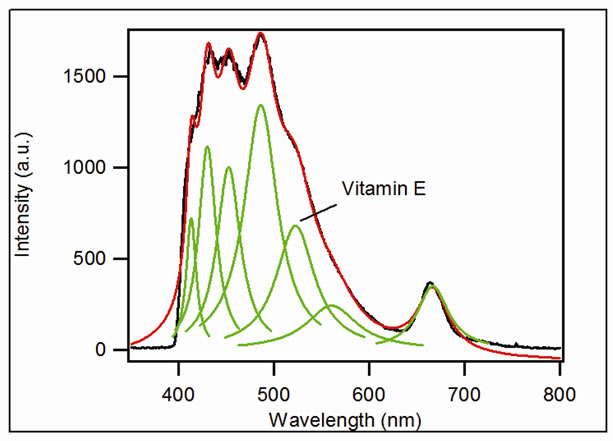
Figure 2. An example of deconvolution: rapeseed oil spectrum.
lengths which correspond to the emission of molecules present in the sample are given in Table 1.
The lines obtained by deconvolution are bands of emission including several molecular lines from the same family. The central position of these lines is largely influenced by the most intense internal line which corresponds to a given molecule. This may explain the large differences observed within the same column in Table 1. These observations allow us to define large spectral regions correspon-ding to the emission of the same molecular families.
We consider two regions for our study: the region of the vitamin E which is an antioxidant and the region of the oxidation products as for these two regions we expect the same behavior (phenomenon of lipid oxidation) for all oil. The relative intensities of the lines, obtained after deconvolution, are characteristic of the concentration of the emitting molecule. In order to compare the different oil spectra, we have normalized the peaks intensities at 432, 452 and 487 nm (oxidation products) of each spectrum to the peak at 525 nm (vitamin E) of the same spectrum (Figure 3).
This allowed us to minimize the number of parameters effect that affects the fluorescence intensity and also to make a better comparison of the spectra. The calculation is conducted in the following way:
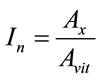
In: Relative intensity.
Ax: area of Lorentzian peak for the oxidation products emission.
Avit: area of Lorentzian peak for the vitamin E emission.
We note on Figure 3 the presence of two groups: the upper-most corresponds to the refined oils while the other corresponds to the unrefined oils. We note also a high value of the relative intensities of the oxidation products for the refined oils, which can be explained as
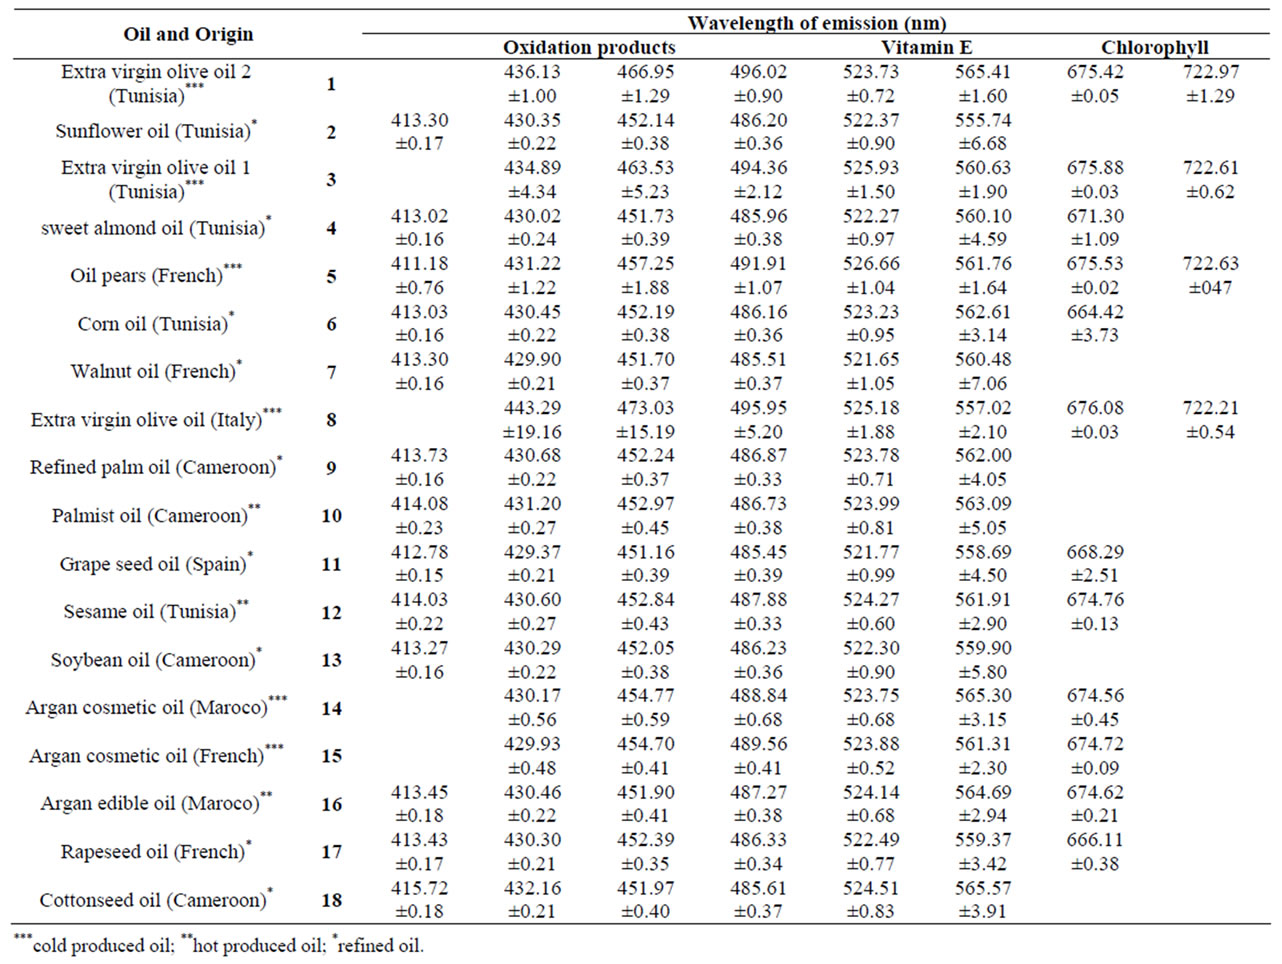
Table 1. Emission wavelengths obtained by deconvolution.
follows the refinement processes heat oils to high temperatures (~200˚C) and induce chemical transformations. The final products lose a large part of its minor compounds having antioxidant character, including the vitamin E. Oil becomes more vulnerable that leads to a growth of oxidation products observed by the fluorescence at 432, 452 and 487 nm.
On the other hand, for the unrefined oils, the relative intensities of these lines are weak, and even weaker for the extra virgin olive oil, newly and cold produced. Actually these oils are generally manufactured by the mechanical pressing, which preserves the quasi-totality of their antioxidants. This can be observed for argan oil in the Figure 4, where are shown the spectra of cosmetic argan (Figure 4(a)) and edible argan oil (Figure 4(b)).
A net difference between the two spectra in the strip of emission of the oxidation product (400 to 500 nm) is noted. The difference is originated in the first step of the manufacture of this last one, compared to the cosmetic argan oil, obtained by a pure mechanical cold process. Moreover, for the edible argan oil the seeds are roasted before undergoing the same process than the precedent. The passage through an elevated temperature causes a thermal oxidation that is set in evidence on the Figure 4(c)) where one can notice the increased intensity of the oxidation products for the edible argan oil.
3.1. Statistical Method
The statistical method based on Principal Component Analysis (PCA) is used here to, in one hand, emphasized the behavior and strengthen the interpretations made directly from the fluorescence spectra and in the other hand, to limit the number of parameters to take into account in arriving at these interpretations. The work presented here is based on two parameters: first the line intensity normalized to the vitamin E (525 nm) line and second the distance of the peak’s wavelength in respect to the average wavelength position, namely the Average Variation (AV_ λi). For the intensity parameter we chose the variables R_1, R_2, R_3 and R_5 that correspond to relative intensity of
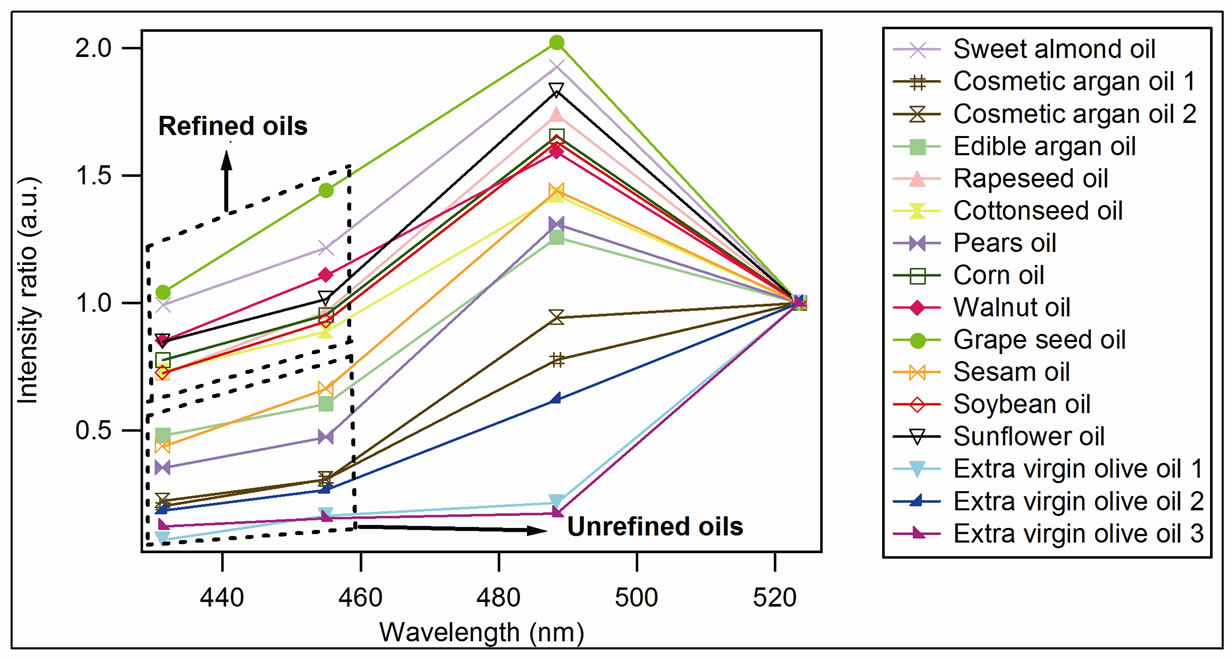
Figure 3. Intensity of oxidation product normalized to the intensity of vitamin E.
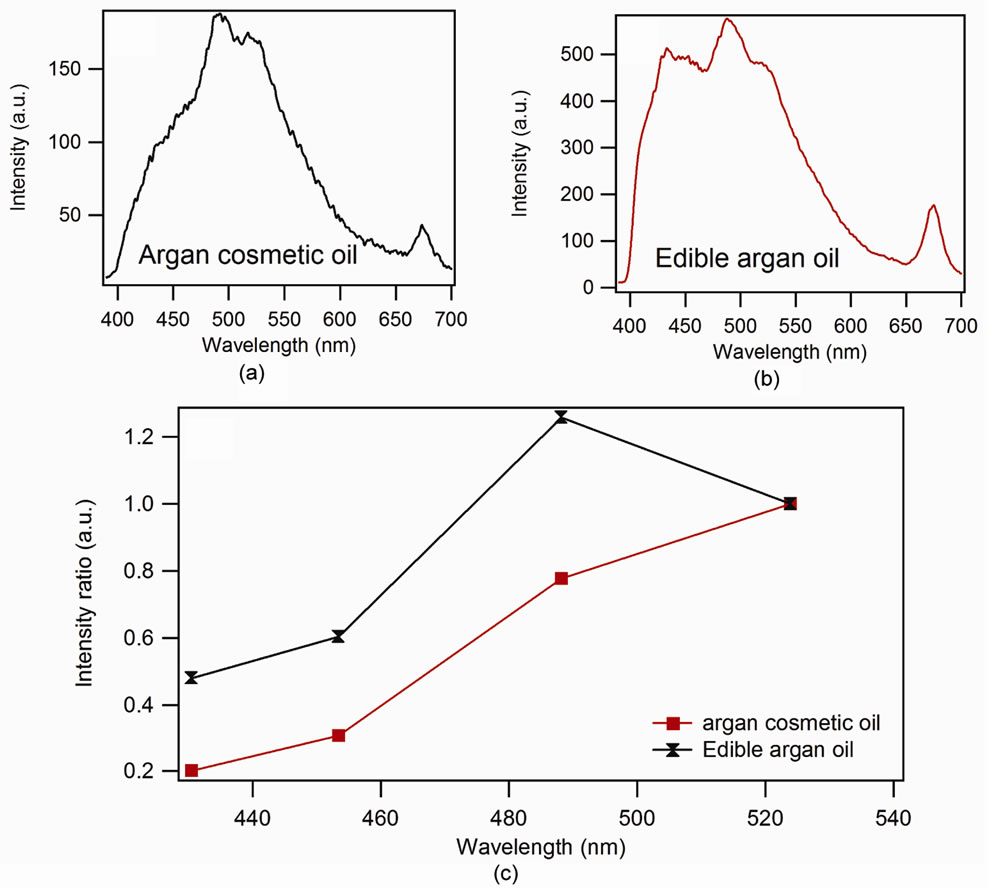
Figure 4. Comparison between the spectrum of argan cosmetic oil (a) and edible argan oil (b) and the relative intensity compared to (c) the vitamin E of edible argan oil and argan cosmetic oil.
lines 432, 452, 487 and 560 nm respectively. For the second parameter we define the variables AV_λ1, AV_λ2, AV_λ3, AV_λ4 et AV_λ5 that correspond to the position of the lines 432, 452, 487, 525 et 560 nm respectively. The different oils are considered as individuals in this analysis and refer, in Figures 5 and 6, by their number (second colon in Table 1).
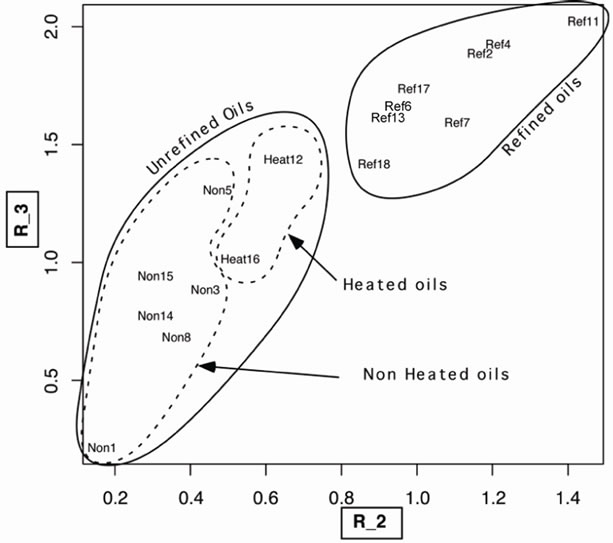
Figure 5. Position of the oils in the (R_2, R_3) space. We distinguish clearly two groups: refined and unrefined oils and inside the unrefined oils we distinguish two other groups: heated and non heated oils. In instance the “Ref7” designates the refined Walnut oil; “Non8” designates Extra virgin olive oil and so on.
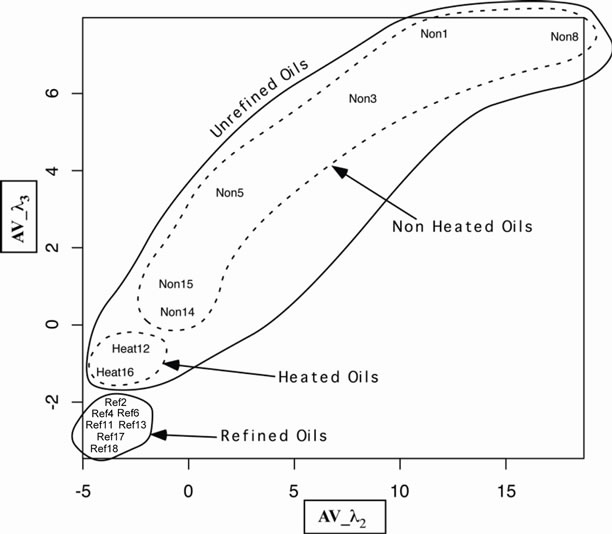
Figure 6. Position of the oils in the (AV_l2, AV_l3) space. We distinguish clearly two groups: refined and unrefined oils. Inside the unrefined oils we distinguish two other groups: heated and non heated oils.
3.1.1. Lines intensities
The plot of the circle of variables correlation (Figure 7) shows strong correlation between variables R_1, R_2 and R_3. These variables correspond to the peaks of oxidation products. On the other hand the variable R_5 which is a peak of anti-oxidant shows a strongly uncorrelated behavior of the three others.
This indicates that the oxidation process is similar for all vegetable oils. Moreover, the perfect superposition of the variables R_1 and R_2 shows that it is possible to use either of these two variables to discriminate the behavior of different oils. Furthermore the variable R_2 is slightly better represented on the circle of correlation than the variable R_1. All this considerations allow use to retain the variables R_2 and R_3 for the representation of our batch of oil samples.
We clearly distinguish in Figure 5 two groups. That of refined oils, designed by “Ref”, and that of the unrefined oils, designed by “Non”. Moreover, within the group of unrefined oils, we distinguish also the group of cold produced oil and those hot produced designed by “Heat”.
3.1.2. Wavelength
The analysis of these oils with the Average Variation of wavelengths indicates a very similar behavior to the one obtained with the intensities with the same oxidation products corresponding to peak 2 (λ = 452 nm) and 3 (λ = 487 nm).
The variables used here is the difference of peak wavelength relative to the wavelength averaged for all oils for given peak. For example, for the first peak of the spectrum,
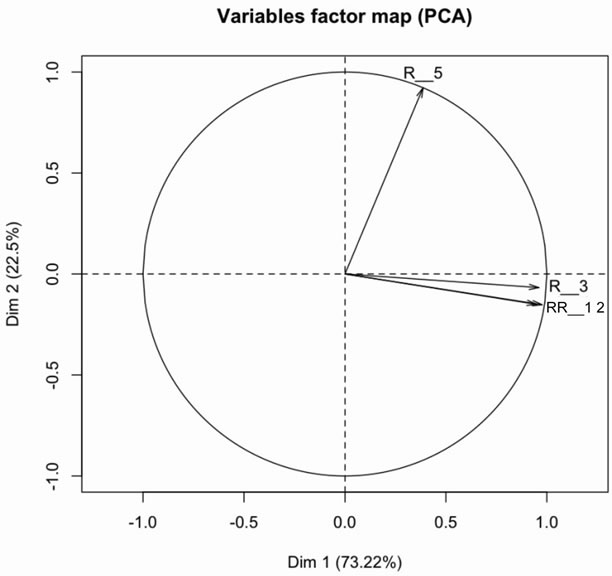
Figure 7. Correlation circle of intensity ratio of lines emitting at 432 nm (R_1), 452 nm (R_2), 487 nm (R_3) et 560 nm (R_5) compare to one of vitamin E.
the value averaged over all oil (see Table 1) is <λ1> = 431,762 nm and variable AV_λ1 = λ1 – <λ1>. We define the variables AV_λ1, AV_λ2, AV_λ3 and AV_λ5 for the five peaks obtained by deconvolution. Based on the circle of correlation, the variable AV_l2 and AV_l3 show strong correlation and are best represented than the others. In consequence we choose these to variables to describe the system. The results are shown in Figures 6 and 8. These results confirm the interpretation made directly from the spectra. They also show that it is possible to limit the analysis to second and third fluorescence peaks corresponding to oxidation products to discriminate between refined and unrefined oils and between hot produced oils and cold produced oils. We also see that heated produced oils tend toward the refined oils.
3.2. Temperature Effect
In order to the effect of the temperature, we have heated during one hour extra virgin olive oil, cosmetic argan oil, refined corn oil and refined sunflower oil at 60˚C, 90˚C, 150˚C, 170˚C and 190˚C. We used a fryer full of oil to insure the homogeneity of the temperature, and spectra were recorded after cooling at ambient temperature. We
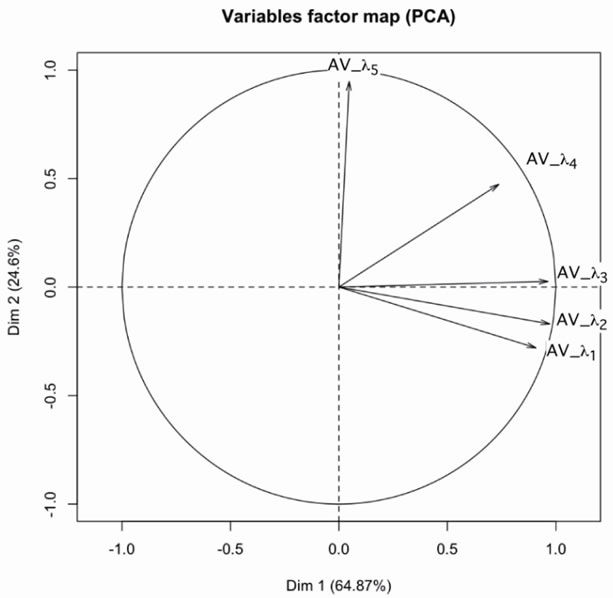
Figure 8. Correlation circle of Average Variation AV_l1 (432 nm), AV_l2 (452 nm), AV_l3 (487 nm), AV_l4 (487 nm) et AV_l5 (560 nm).
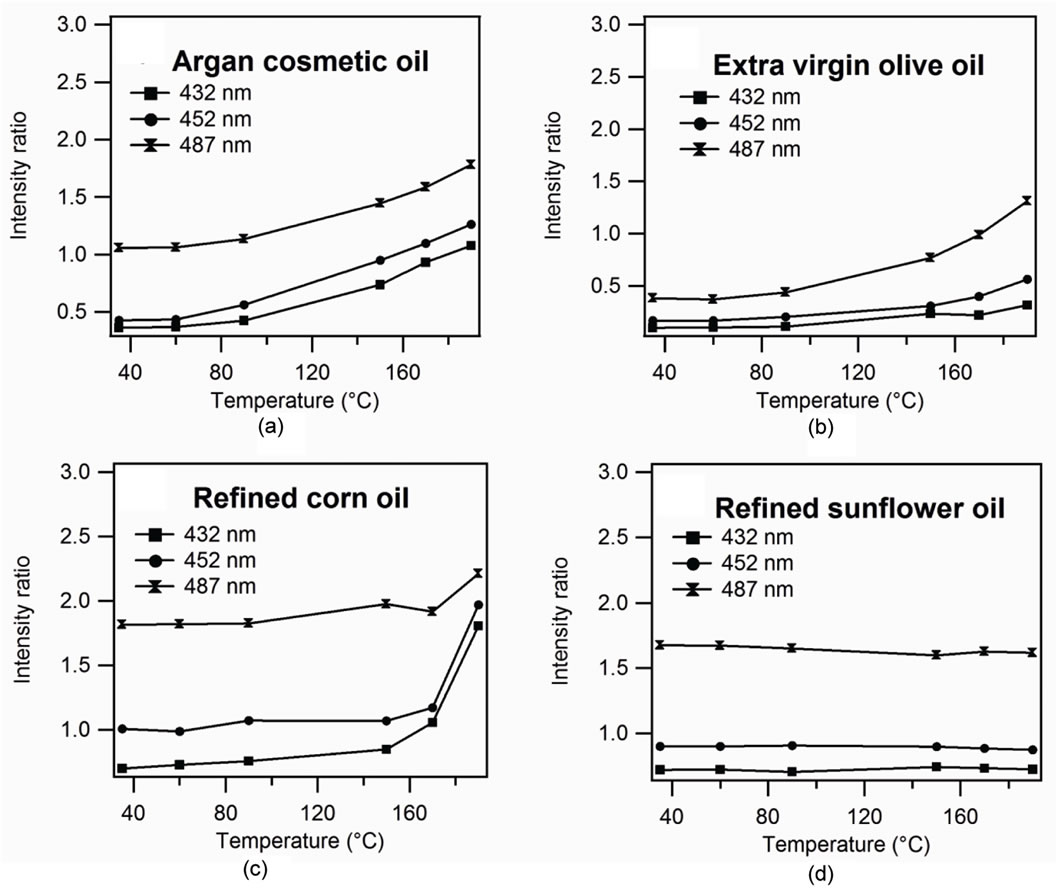
Figure 9. Relative intensity according to temperature. (a) argan cosmetic oil, (b) extra virgin olive oil, (c) refined corn oil, (d) refined sunflower oil.
used the refined high oleic sunflower oil which contains 5% of poly-unsaturated fatty acid [8], extra virgin olive oil, argan cosmetic oil and refined corn oil which contain respectively around 21%, 30% and 56% of poly-unsaturated fatty acid [8,9]. We note that the intensities of the lines shapes corresponding to oxidations products increase with temperature for the oil rich in poly-unsaturated fatty acid (Figures 9(a)-(c)). Figure 9(d) shows evolution of a different variation with temperature of the peak of oxidation product compared to temperature and: there is no variation with temperature because the high oleic sunflower is very stable during the thermal oxidation [8]. The spectrum of the extra virgin olive oil before heating presents weak peaks in oxidation products [4]. The spectra of both cosmetic argan oil and virgin extra olive oil before heating have a similar profile. This similarity is due to the fact that these oils are cold produced. After heating, the peaks of the oxidation products become very intense for the cosmetic argan oil showing the increase of the concentration of these products. The curves of the relative intensities compared to the vitamin E show a considerable variation of the lines of the oxidation products and the evolution of these lines according to the temperature (Figure 9(a)) shows a very fast growth from 150˚C. Figure 9 suggests a possible classification for these oils according to stabilities to thermal oxidation. The stabilities increase when the rate of polyunsaturated fatty acid decreases.
4. Conclusions
Some properties of vegetable oils have been studied with the use of cheap material and without preparation of the samples. A distinction between the refined and unrefined oils has been carried out and the possibility to detect the deterioration of oils under effect of heating has been shown. The study shows the possibility to make easily an analysis of the quality of oils and to detect if they are cold produced or hot produced. It also shows the possibility to detect alteration of some coveted oils as the argan or the extra virgin olive oils, with a very simple experimental apparatus. The influence of the poly-unsaturated fatty acid on the stability of oils is also shown. This last point needs to be assessed more precisely.
5. Acknowledgements
The authors acknowledge the collaboration of Prof. Guy Taieb from LPPM laboratory. We also thank ICTP which partially supported this work through NET-45 project.
REFERENCES
- E. Sikorska, A. Romaniuk, I. V. Khmelinskii, R. Herance, J. L. Bourdelande, M. Sikorski and J. Koziol, “Characterization of Edible Oils Using Total Luminescence Spectroscopy,” Journal of Fluorescence, Vol. 14, No. 1, 2004, pp. 25-35. doi:10.1023/B:JOFL.0000014656.75245.62
- M. Laguerre, J. Lecomte and P. Villeneuve, “Evaluation of the Ability of Antioxidants to Counteract Lipid Oxidation: Existing Methods, New Trends and Challenges,” Progress in Lipid Research, Vol. 46, No. 5, 2007, pp. 244-282. doi:10.1016/j.plipres.2007.05.002
- F. Guimet, R. Boque and J. Ferre, “Cluster Analysis Applied to the Exploratory Analysis of Commercial Spanish Olive Oils by Means of Excitation-Emission Fluorescence Spectroscopy,” Journal of Agricultural and Food Chemistry, Vol. 544, 2005, pp. 143-152.
- N. B. Kyriakidis and P. Skarkalis, “Fluorescence Spectra Measurement of Olive Oil and Other Vegetable Oils,” Journal of AOAC International, Vol. 83, No. 6, 2000, pp. 1435-1439.
- F. Guimet, R. Boque and J. Ferre, “Rapid Detection of Olive-Pomace Oil Adulteration in Extra Virgin Olive Oils from the Protected Denomination of Origin Siurana Using Excitation-Emission Fluorescence Spectroscopy and Three-Way Methods of Analysis,” Analytica Chimica Acta, Vol. 52, 2004, pp. 6673-6679.
- S. B. Engelsen, “Explorative Spectrometric Evaluations of Oil Deterioration,” Journal of the American Oil Chemists’ Society, Vol. 74, No. 12, 1997, pp. 1495-1508. doi:10.1007/s11746-997-0068-2
- A. Sayago, M. T. Morales and R. Aparicio, “Detection of Hazelnut Oil in Virgin Olive Oil by a Spectrofluorimetric Method,” European Food Research and Technology, Vol. 218, No. 5, 2004, pp. 480-483. doi:10.1007/s00217-004-0874-9
- S. A. Smith, R. E. King, B. David and B. D. Min, “Oxidative and Thermal Stabilities of Genetically Modified High Oleic Sunflower Oil,” Food Chemistry, Vol. 102, No. 4, 2007, pp. 1208-1213.
- R. Cheikhousman, M. Zude, D. Jouan-Rimbaud Bouveresse, C. L. Léger, D. N. Rutledge and I. Birlouez-Aragon, “Fluorescence Spectroscopy for Monitoring Deterioration of Extra Virgin Olive Oil during Heating,” Analytical and Bioanalytical Chemistry, Vol. 382, No. 6, 2005, pp. 1438- 1443. doi:10.1007/s00216-005-3286-1