Social Networking
Vol.3 No.1(2014), Article ID:42387,10 pages DOI:10.4236/sn.2014.31002
Dynamic Social Network Analysis with Heterogeneous Sensors in Ambient Environment
1Faculty of Engineering, Information and Systems, University of Tsukuba, Tsukuba, Japan
2School of Science and Technology, Kwansei Gakuin University, Nishinomiya, Japan
3Graduate School of Information Science and Technology, Osaka University, Osaka, Japan
4Graduate School of Information Science, Nara Institute of Science and Technology, Nara, Japan
5Research Institute of Electronics, Shizuoka University, Shizuoka, Japan
6Research Institute of Electrical Communication, Tohoku University, Sendai, Japan
Email: s-tugawa@cs.tsukuba.ac.jp
Copyright © 2014 Sho Tsugawa et al. This is an open access article distributed under the Creative Commons Attribution License, which permits unrestricted use, distribution, and reproduction in any medium, provided the original work is properly cited. In accordance of the Creative Commons Attribution License all Copyrights © 2014 are reserved for SCIRP and the owner of the intellectual property Sho Tsugawa et al. All Copyright © 2014 are guarded by law and by SCIRP as a guardian.
Received November 19, 2013; revised December 21, 2013; accepted January 6, 2014
KEYWORDS
Social Network; Ambient Environment; Dynamic Social Network Analysis; Centrality
ABSTRACT
This paper presents our vision of large-scale, dynamic social network analysis in real environments, which we expect to be enabled by the introduction of large-scale heterogeneous sensors in the ambient environment. We address challenges in realizing large-scale dynamic social network analysis in real environments, and discuss several promising applications. Moreover, we present our design and implementation of a prototype system for quasi-realtime social network construction. We finally present preliminary experimental results of dynamic social network analysis for six-person social gatherings in a real environment, and discuss the feasibility of dynamic social network analysis and its effectiveness.
1. Introduction
In network science, and particularly at its intersection with the social sciences, research analyzing the topological structures of social networks has been actively performed for further understanding complex social phenomena that involve interactions among a large number of people [1-3]. Such research is called social network analysis [4-7]. Because social ties are invisible and difficult to measure, sociologists have generally constructed one-time snapshots of social networks by using questionnaires, often for very small groups [1]. Conventional social network analysis in the social sciences has therefore focused on smallscale and static social networks in real environments.
Internet-based communication through email and bulletin boards, however, enables construction of large-scale social networks because of the availability of communication logs [5,8,9]. Internet-based communication logs are rich in terms of size and timing availability, and thus overcome several limitations of questionnaire-based social network construction. This represents dramatic progress in social network analysis, in that Internet-based communication logs can be used to construct large-scale and dynamic social networks in virtual environments [5,8-10].
On the contrary, recent advances in sensing technologies allow accurate monitoring of human-to-human interactions in real environments. For instance, human-tohuman interactions can be monitored with a badge-shaped device that continuously tracks items such as utterances and changes in body direction in the MIT Media Lab. [11] and the Socio Patterns project [12]. Many heterogeneous sensors can also be embedded in the ambient environment for accurate and non-intrusive monitoring of many types of human activities [13,14].
With the aid of heterogeneous sensors in the ambient environment, we anticipate that large-scale and dynamic social network analysis in real environments will soon become possible. As discussed above, trends in social network analysis are shifting from small-scale static analysis in real environments to large-scale dynamic analysis in virtual environments. We expect this trend to continue toward large-scale dynamic analysis in real environments (Figure 1).
This paper presents our vision of large-scale, dynamic social network analysis in real environments, which we expect to be enabled by the introduction of large-scale heterogeneous sensors in the ambient environment. We address challenges in realizing large-scale dynamic social network analysis in real environments, and discuss several promising applications. Moreover, we present our design and implementation of a prototype system for quasi-realtime social network construction. As the first step to realize large-scale dynamic social network analysis in real environment, we finally present preliminary experimental results of dynamic social network analysis for six-person social gatherings in a real environment. Although our experiments are small-scale, our preliminary results with the prototype system show the feasibility and effectiveness of dynamic social network analysis.
The remainder of this paper is organized as follows. In Section 2, we discuss challenges in realizing large-scale dynamic social network analysis in real environments. Section 3 describes promising applications of dynamic social network analysis in real environments. We introduce our implementation of a prototype system for quasi-realtime social network construction in Section 4. Case studies using our prototype system for quasi-realtime social network construction are shown in Section 5. Finally, Section 6 gives our conclusions and a discussion of future work.
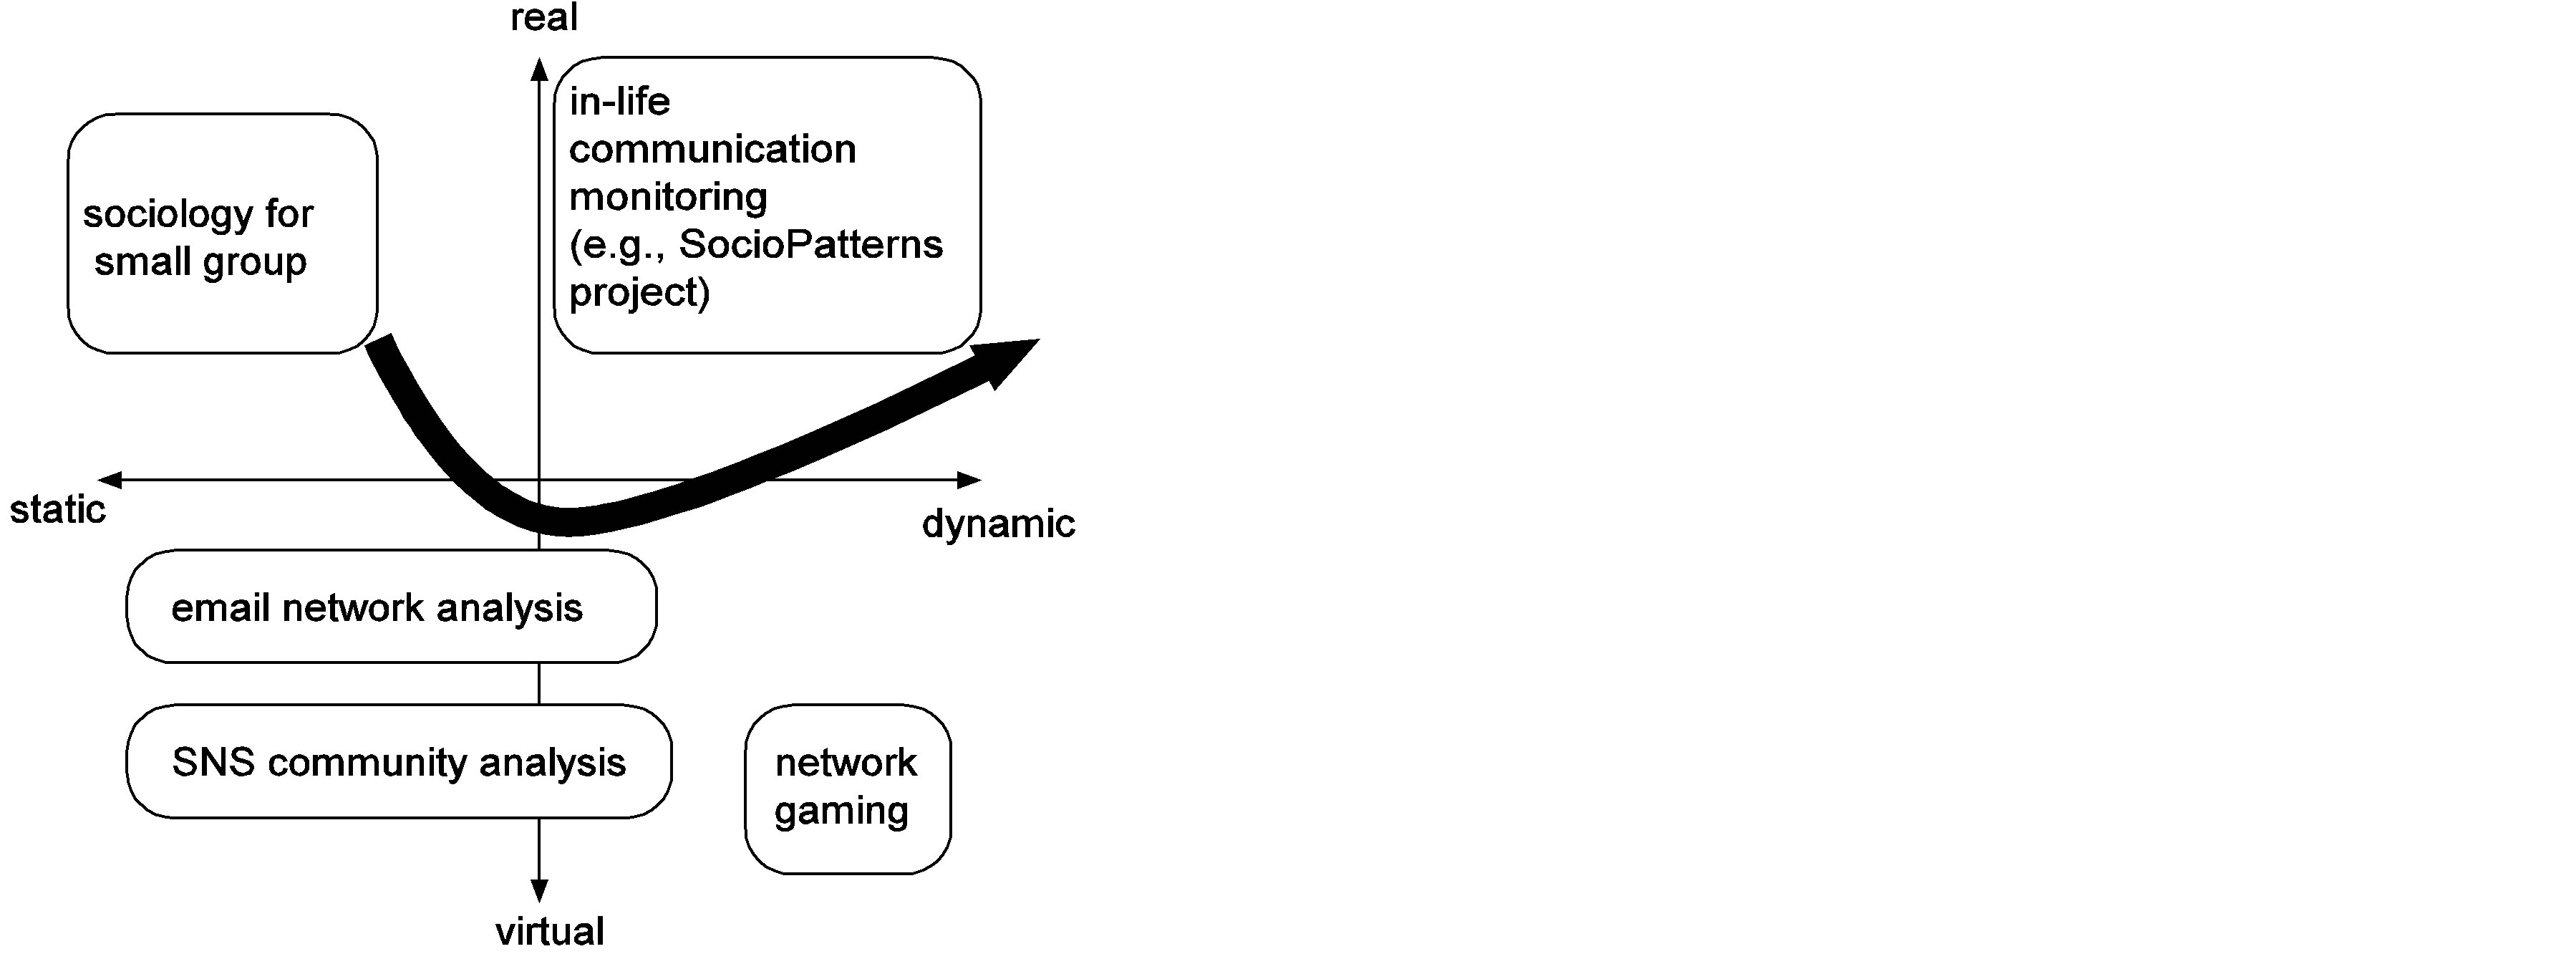
Figure 1. Trend toward large-scale, dynamic social network analysis in real environments; classification of several social network analyses in terms of network dynamics and environment type.
2. Challenges
For realizing large-scale, dynamic social network analysis in real environments, social network construction should be rapid, accurate, reliable and secure. In this section, we discuss five major challenges in achieving this goal.
2.1. Individual Identification
In real environments, individual identification is necessary for social network analysis. Several sensing technologies such as RFID (radio frequency identification) [15], image recognition [16], and biometric identification [17] can be utilized. For non-intrusive sensing, RFID and image recognition technologies are promising. Humans in real environments move about, and thus individual identification requires movement tracking.
2.2. Individual Positioning
The position of each person must be tracked. Two-dimensional positioning is required at a minimum, and threedimensional positioning is required in some cases such as in multistory buildings. Position tracking is possible using RFID devices [15], ultrasonic waves [18], and image recognition [16]. Although basic social network analysis can be performed from only body position, more advanced analysis become possible if the position of individual body parts is measurable, because head, hand, and leg movements give nonverbal cues for analyzing interactive communication.
2.3. Communication Detection
The most important yet most difficult task is the detection of social ties. Constructing a social network requires identification of, at a minimum, the direction, strength, and duration of communication. Moreover, in multi-party communication, whether communication is one-to-one or one-to-many must be identified, for which several types of sensing data are required. For instance, head and body direction, as well as the content of communication obtained through voice recognition, can be used for communication detection.
2.4. Communication Classification
In simple social network analysis, construction of a social network with single-valued social ties is sufficient. For example, social ties can be simply represented by the frequency of communication between pairs of individuals. However, thanks to the availability of heterogeneous sensors, one can now create social networks with multi-valued social ties, enabling more detailed social network analysis. For instance, social ties can be represented by several communication attributes such as utterance loudness, emotional tone, and communication context. One challenge is measurement or estimation of such communication attributes through the use of heterogeneous sensors. As an example, temperature sensors, biometric sensors, and image recognition could be utilized for communication classifications.
2.5. Privacy and Security Concerns
Since social network analysis in a real environment is based on personal information, privacy and security concerns should be given a high priority. Large-scale dynamic social network analysis naturally requires the collection of a large amount of personal information. In many cases, sensor data should be pre-filtered to protect privacy by, for example, private data deletion or data anonymization. Also, online storage that directly or indirectly receives sensor information must be reliable and secure.
In addition to the five challenges discussed above, there are several unresolved issues regarding individual sensors (e.g., quality assurance, which involves accuracy, timeliness, and outlier management) and regarding cooperative sensors (e.g., redundancy, reliability, and conflict resolution for contradictory sensing data). Moreover, if heterogeneous sensors are battery-powered, energy efficiency is vital.
3. Promising Applications
The following is a discussion of several promising applications of large-scale, dynamic social network analysis in real environments.
3.1. Social Network Evolution Analysis
One promising application is sociological analysis of community formation. For instance, large-scale, dynamic social networks accurately represent the dynamics of socialization, which can be used to study the mechanism of social network evolution.
3.2. Interactive Communication Analysis
Interactive communications can be represented as a dynamic social network. Hence, another promising application is behavioral psychological analysis of interactive communication. Detailed analysis of interactive communication requires construction of a social network with multi-valued social ties to capture the detailed behavior of each person.
3.3. Communication Assistance
Large-scale, dynamic social network analysis should help build applications that assist communications. Once the dynamics of communication are represented as a dynamic social network, several conventional tools for social network analyses can be applied. For instance, cluster detection algorithms [19,20] can detect communities in the network, and centrality measures [21,22] can discover key persons. Such information could indicate the state of communication. We can therefore design an application that assists communication in real environments.
3.4. Interactive Art
Large-scale, dynamic social networks constructed from heterogeneous sensors can be used for interactive art. With conventional network visualization software, social networks can be quickly visualized in a number of ways. In particular, changes in communication can be quickly reflected in a visualized social network, which could enable a new type of interactive art.
3.5. Multi-Party Gaming
Multi-party gaming is another promising and interesting application. Large-scale, dynamic social networks accurately capture activity in a place. As with interactive art, this information can be used for new types of multi-party gaming. For instance, a game application can make decisions based on the results of dynamic social network analysis.
4. Quasi-Realtime Social Network Construction
For examining the feasibility of dynamic social network analysis, we have designed and implemented a prototype system for quasi-realtime social network construction. The system is built in our proposed Ambient Suite, which is a room-shaped environment with heterogeneous sensors [13] (Figure 2). Ambient Suite has microphones, 3D trackers, and acceleration sensors to sense participant utterances, head positions, and hand gestures, respectively. We utilize these sensors to realize quasi-realtime social network construction. Refer to [13] for a detailed explanation of the Ambient Suite.
For quasi-realtime social network construction, each person was equipped with a head-mounted marker and a sensor-equipped cup [23]. The head-mounted marker was continuously tracked with multiple infrared cameras (OptiTrack FLEX: V100R2) in the Ambient Suite. The sensor-equipped cup (equipped with a fourth generation Apple iPod Touch) monitored utterance and gestures of a person with a microphone and an accelerometer. All sensor data were quickly transferred to the management server; infrared cameras and the management server were connected with USB cables, and sensor-equipped cups with 54 Mbit/s WiFi.
From among the several types of information obtained

Figure 2. Ambient Suite, a room-shaped ambient information environment equipped with a number of heterogeneous sensors.
from the heterogeneous sensors, we used the head position, head direction, and volume of utterance of each person for quasi-realtime social network construction.
Our system constructs social network utilizing these information. Occurrences of communications among arbitrary pairs are detected based on the positions and angles of their heads. A social tie is inferred from the loudness of utterance, head position, and head direction of each person. We used a simple threshold-based communication detection that assumes two individuals are talking to each other when they are within a predetermined distance from each other, facing each other within a predetermined angle, and utterances exceed a predefined threshold loudness. Specifically, a social tie from person i to j is created when the distance between i and j is less than x [m], the relative head angle is less than θ, and the loudness of i’s utterance exceeds V [dB]. The weight of a link (the strength of a social tie) is defined as the accumulated duration of conversation.
Our implementation instantly constructs dynamic social networks from sensor data, which implies the feasibility of quasi-realtime social network analysis applications such as interactive communication analysis, interactive art, and multi-party gaming.
Moreover, our implementation almost instantly calculates several network analysis measures such as nodelevel measures of degree, betweenness, closeness, and eigenvector centrality [21,24], and graph-level measures such as graph centrality [25], density, diameter, average path length, and clustering coefficient [26]. Such information could indicate the state of communication. We can therefore design an application that assists communication in real environments.
Our implementation supports quasi-realtime social network visualization. A dynamic social network is drawn every construction interval. Detailed information from heterogeneous sensors such as the position and the direction of each person can be overlaid on the visualization. Snapshots of the dynamic social network can be exported into several formats used in popular network analysis tools such as Pajek, NetMiner, and Cytoscape. Hence, a variety of conventional social network analysis tools can be utilized for quasi-realtime social network analysis.
5. Experiments in Ambient Suite
5.1. Overview
In this section, we present preliminary experimental results for dynamic social network analysis of six-person social gatherings in a real environment. Analysis is performed using our system for quasi-realtime social network construction. Sensor data were obtained for quasi-realtime social network construction for six individuals, who were asked to freely communicate with others in the Ambient Suite. For each person, the utterance loudness and the position and direction of the head were periodically obtained via sensors. The sensing intervals for the head position, the head direction, and the utterance loudness were 100 ms, 100 ms, and 250 ms, respectively. We used threshold volume V = −43 dB, distance threshold x = 3 m, and facing angle threshold θ = π/3 for communication detection.
We repeated a 12-min experiment 17 times with nonoverlapping participants. Each group consisted of six individuals, and thus 101 participants (51 men and 50 women; one woman was absent) took part in the experiment. Each group consisted of three men and three women who had never met each other before the experiment. All participants were Japanese graduate or undergraduate students whose ages ranged from 18 to 24 years (average 21.7 years). Detailed settings of Ambient Suite are explained in [13].
Several snapshots of a real dynamic social network are shown in Figure 3. The thickness of each edge (social tie) represents its weight (duration of communication).
5.2. Relation between Centrality Measure and Leadership Strength
We first investigate the relation between centrality measure of a node (a participant in the experiment) and the strength of that participant’s leadership. In social network analyses, centrality measures such as degree, closeness, and betweenness centralities [21] are widely used to discover an individual who plays a central role in a community or to infer the leadership strength of that person [27-29]. Therefore, several analyses to investigate the relation between leadership strength of a person and centrality measure have been performed [30-32]. For instance, Freeman et al. analyzed the relation between leadership and degree centrality, closeness centrality, and betweenness centrality through problem-solving experiments [30]. We performed similar experiments utilizing our system.
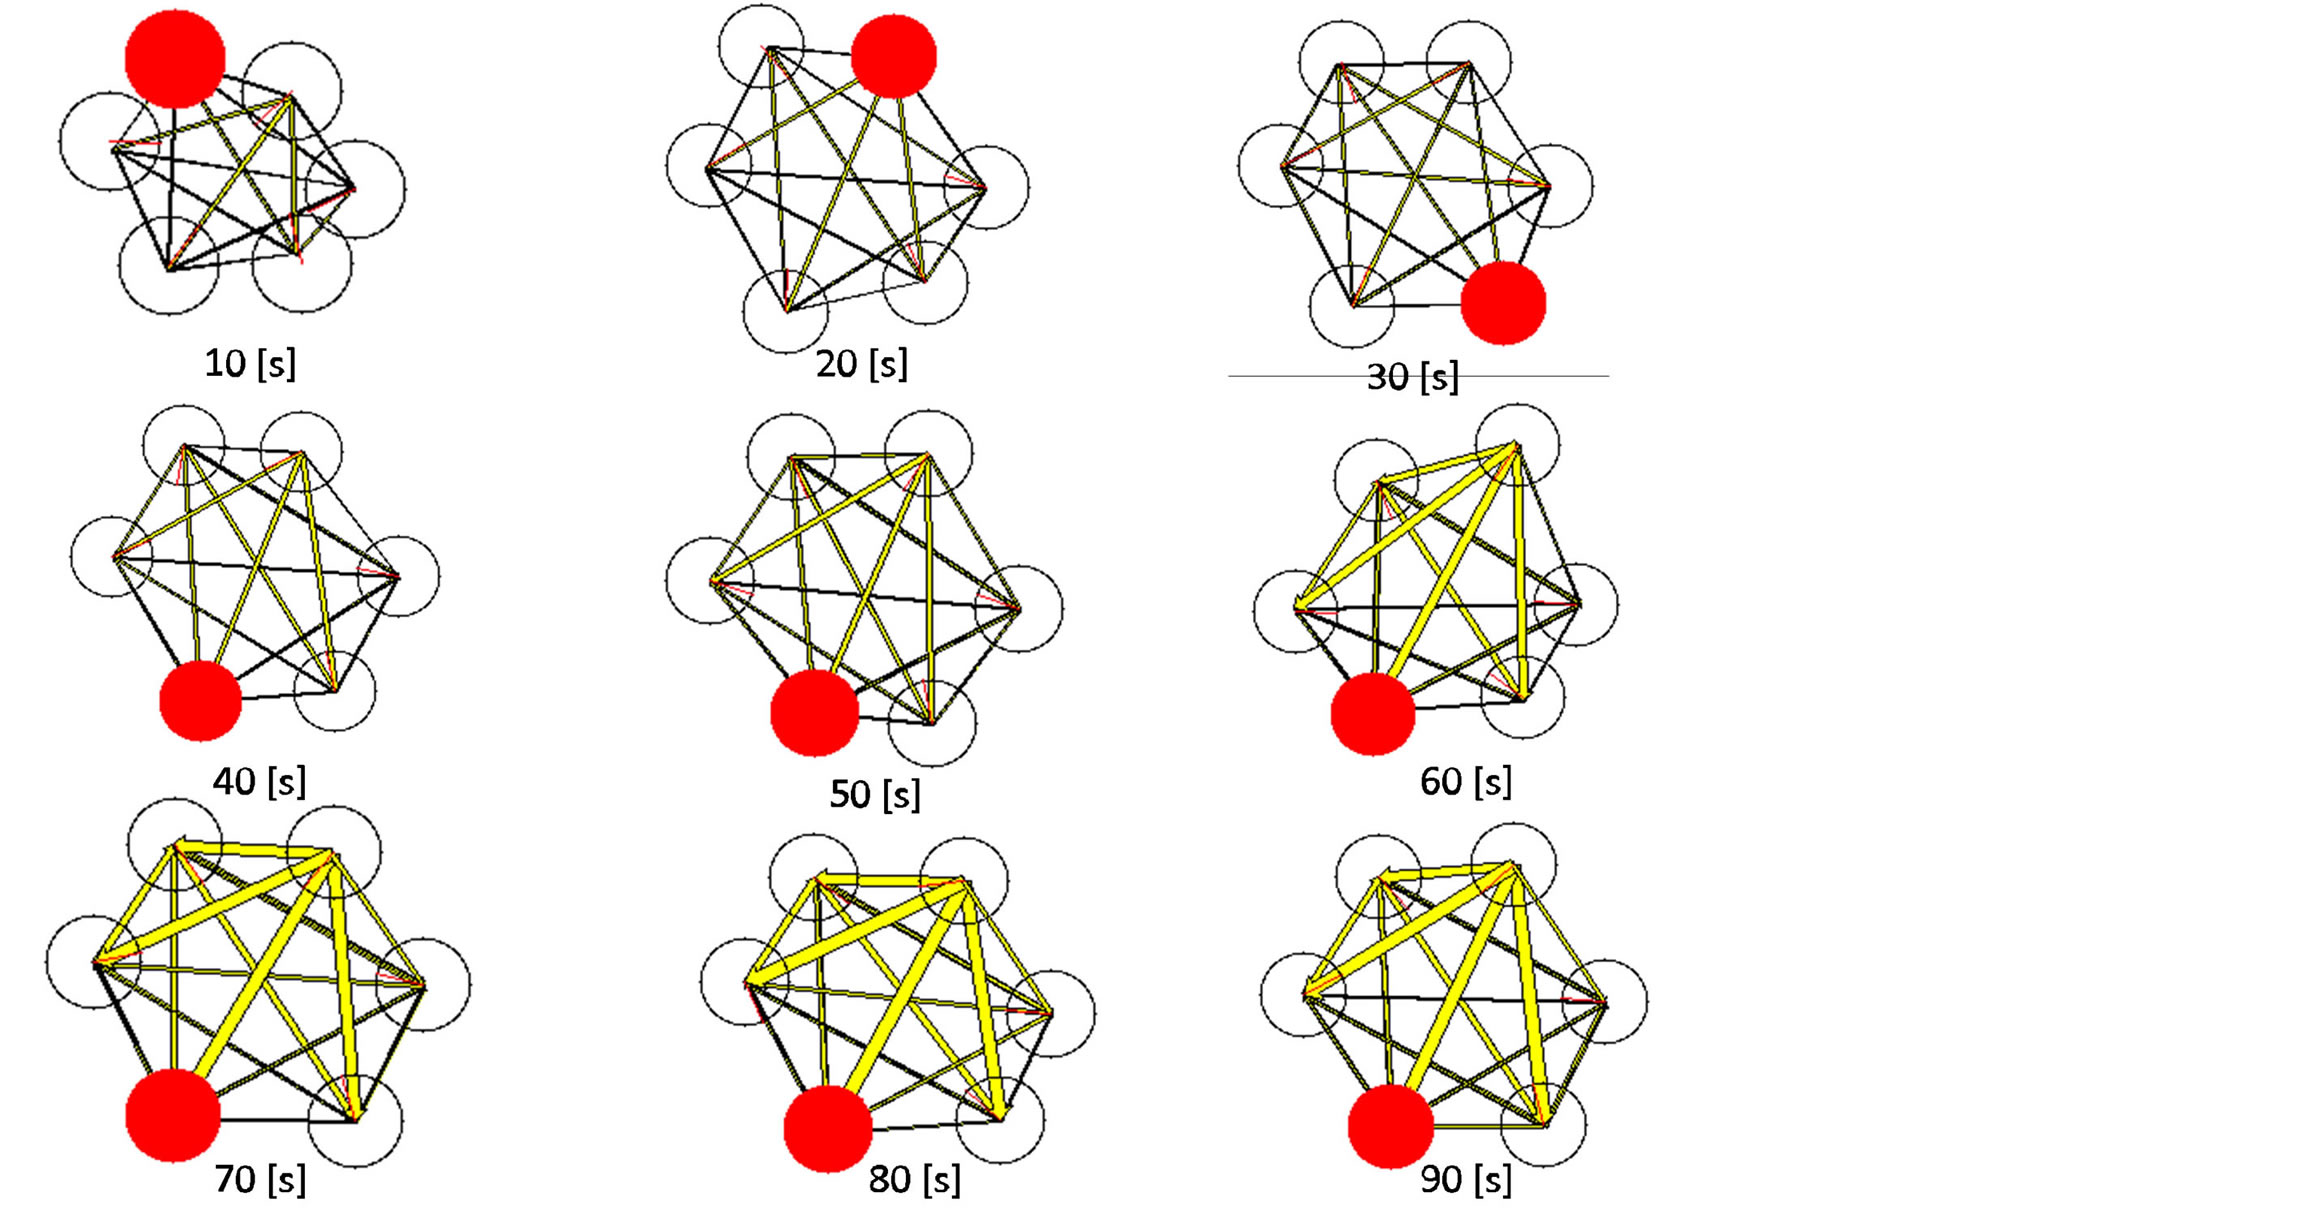
Figure 3. Snapshots of a real dynamic social network constructed and visualized when six individuals (circles) are freely talking with others; lines between pairs indicate social ties, and line thicknesses represent the duration of communication. Individuals with the highest betweenness [21] (a centrality measure obtained from social network analysis) are shown in red.
We calculated degree, closeness, and betweenness centralities of each participant every 2 min during the experiments. We constructed a weighted directed graph from sensor data at 2 min intervals, and calculated the in-degree, out-degree, closeness, and betweenness centralities of each participant. Node i represents a participant, link (i, j) represents communication from participant i to j, and link weight wi,j represents accumulated duration of communication from participant i to j. Node i’s in-degree centrality is defined as the sum of the link weights of incoming links of node i, and out-degree centrality is defined as the sum of the weights of outgoing links of node i. For calculating closeness centrality and betweenness centrality, the distance between nodes i and j is defined as 1/wi,j [7].
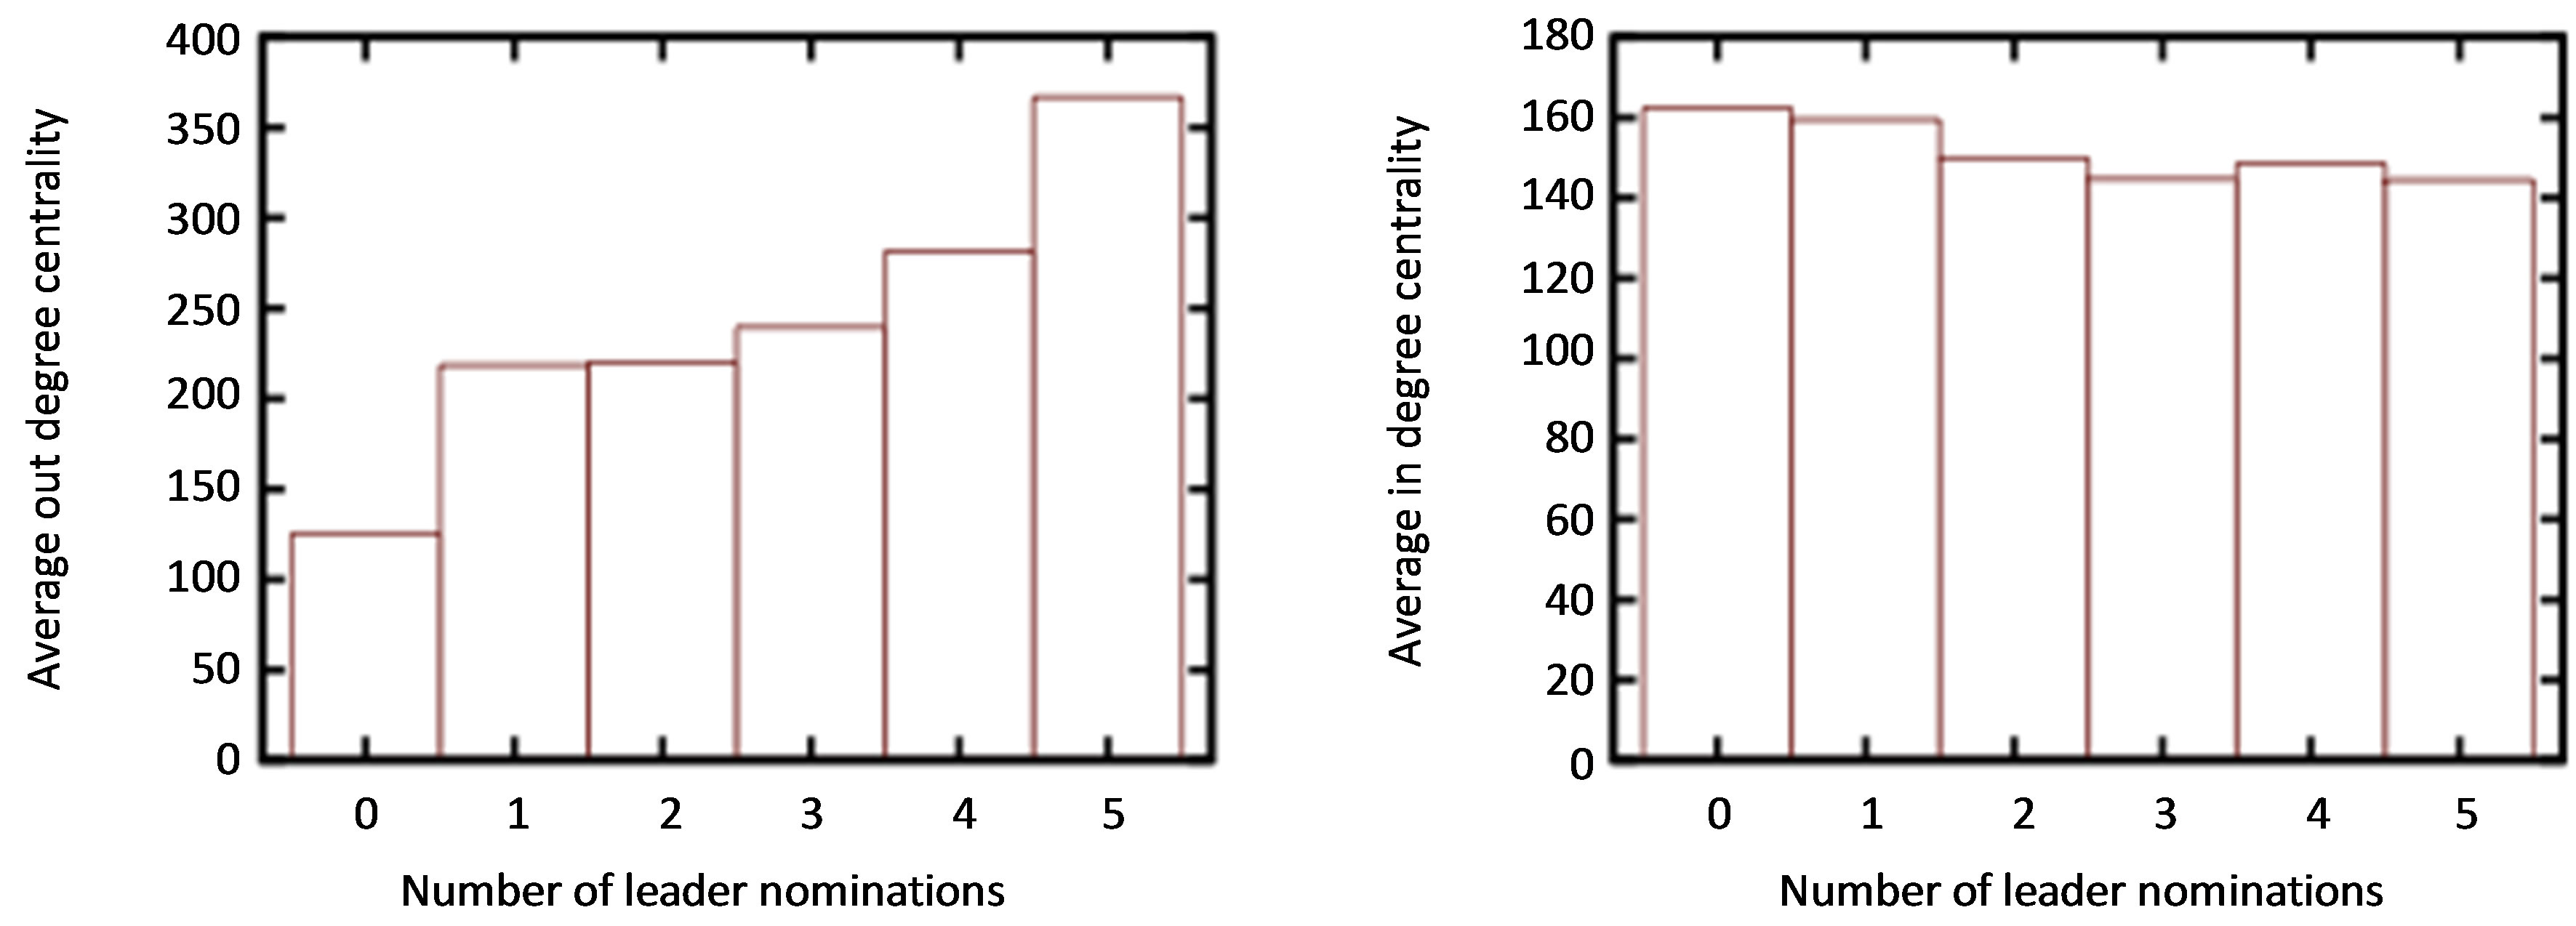
Each participant is asked to subjectively select a leader among other participants for every 2 min in the experiments using our constructed sensor-equipped cup [23]. We categorize participants by the number of nominations as leader by other participants, and calculated the average of centrality measures for each category. Figure 4 shows the average of centrality measures of participants for each category based on their number of nominations as a leader.
Figure 4 shows that participants with more nominations as leader tended to have higher centrality scores, except in-degree centrality. This result suggests that there is a strong correlation between the leadership strength of a participant and his or her centrality score in a social gathering. Low correlation between in-degree centrality and leadership strength suggests that a participant who listens to others is rarely considered to be a leader in a social gathering.
5.3. Relation between Structure of Social Network and Activity of Conversation
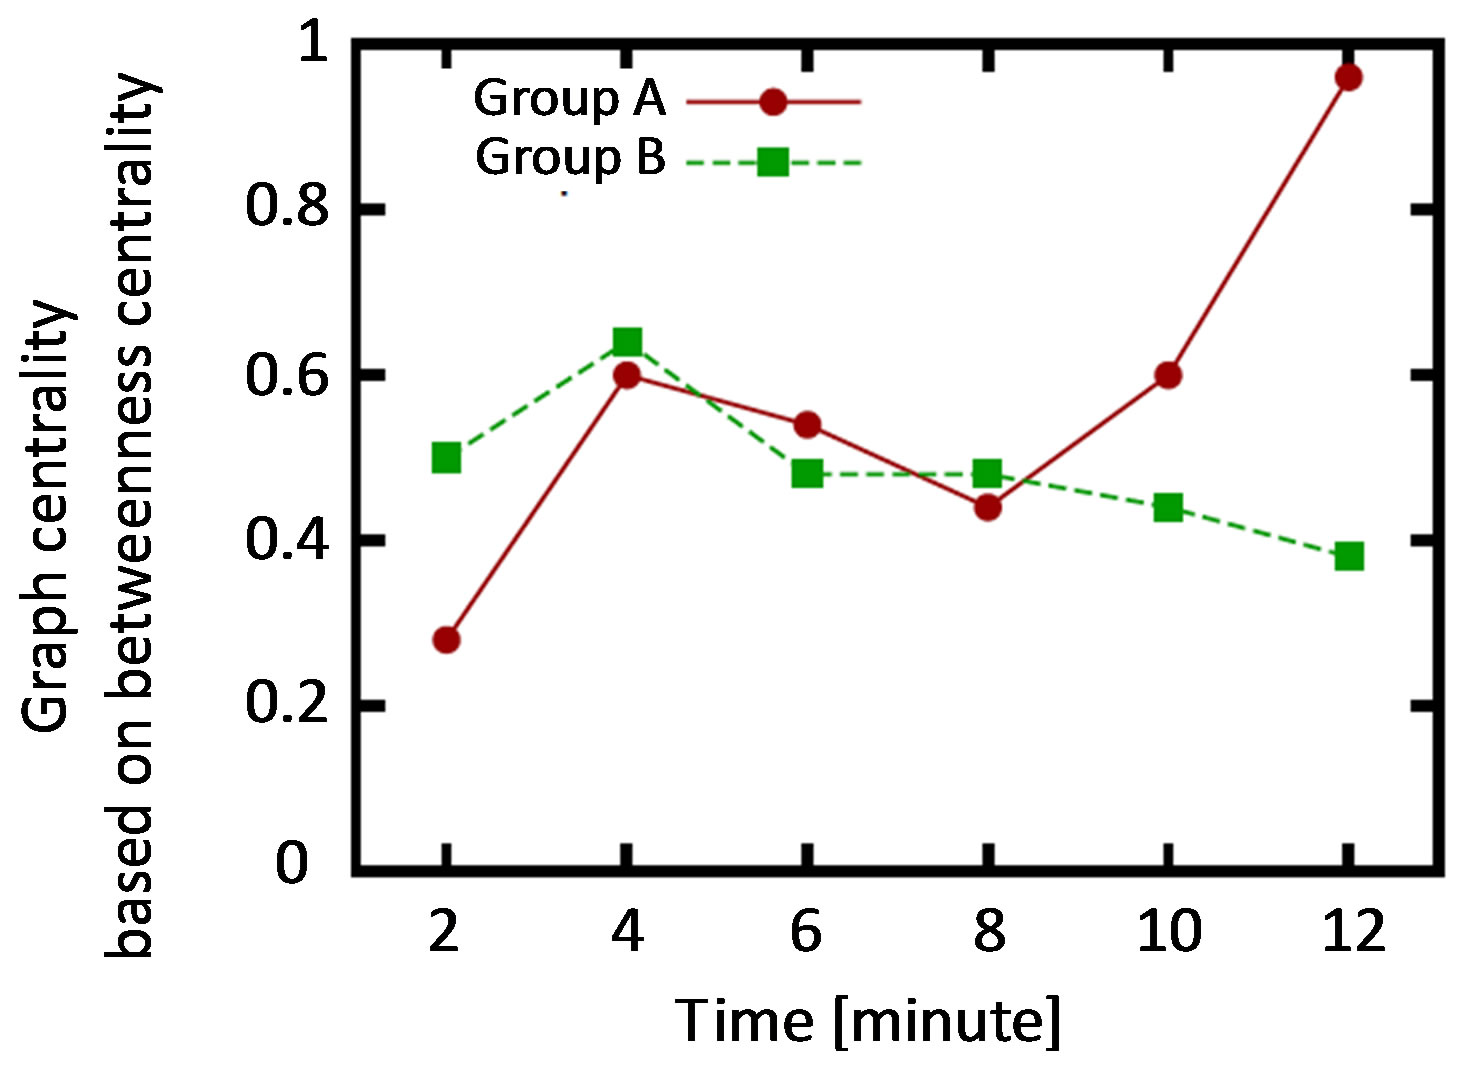
We next obtained several popular measures in social network analysis, and investigated their evolution. As an example, Figure 5(a) shows the evolution of graph centrality based on the betweenness centrality [25] in two dynamic social networks. In this case, graph centrality can be thought of as a metric for measuring how the communications among people are balanced; graph centrality is lower if everyone has similar betweenness centrality. During the experiment, all individuals were asked to subjectively grade the activity of their communications in five levels. Evolutions of average activity scores subjectively given by six individuals are shown in Figure 5(b).
Comparison of Figures 5(a) and (b) indicates a correlation among those evolutions. Note that Figure 5(a)was obtained from only sensor data from heterogeneous sensors, whereas Figure 5(b) was obtained from participant questionnaires. These results suggest that in these two groups, network measures may be effective to infer activity scores subjectively given by participants. More detailed analysis (i.e., analysis using all groups’ data) is given in Section 5.5.
5.4. Analysis of Burstiness
In recent years, it has been found that many human activities show interesting patterns, for instance, the inter-event
 (a)
(a)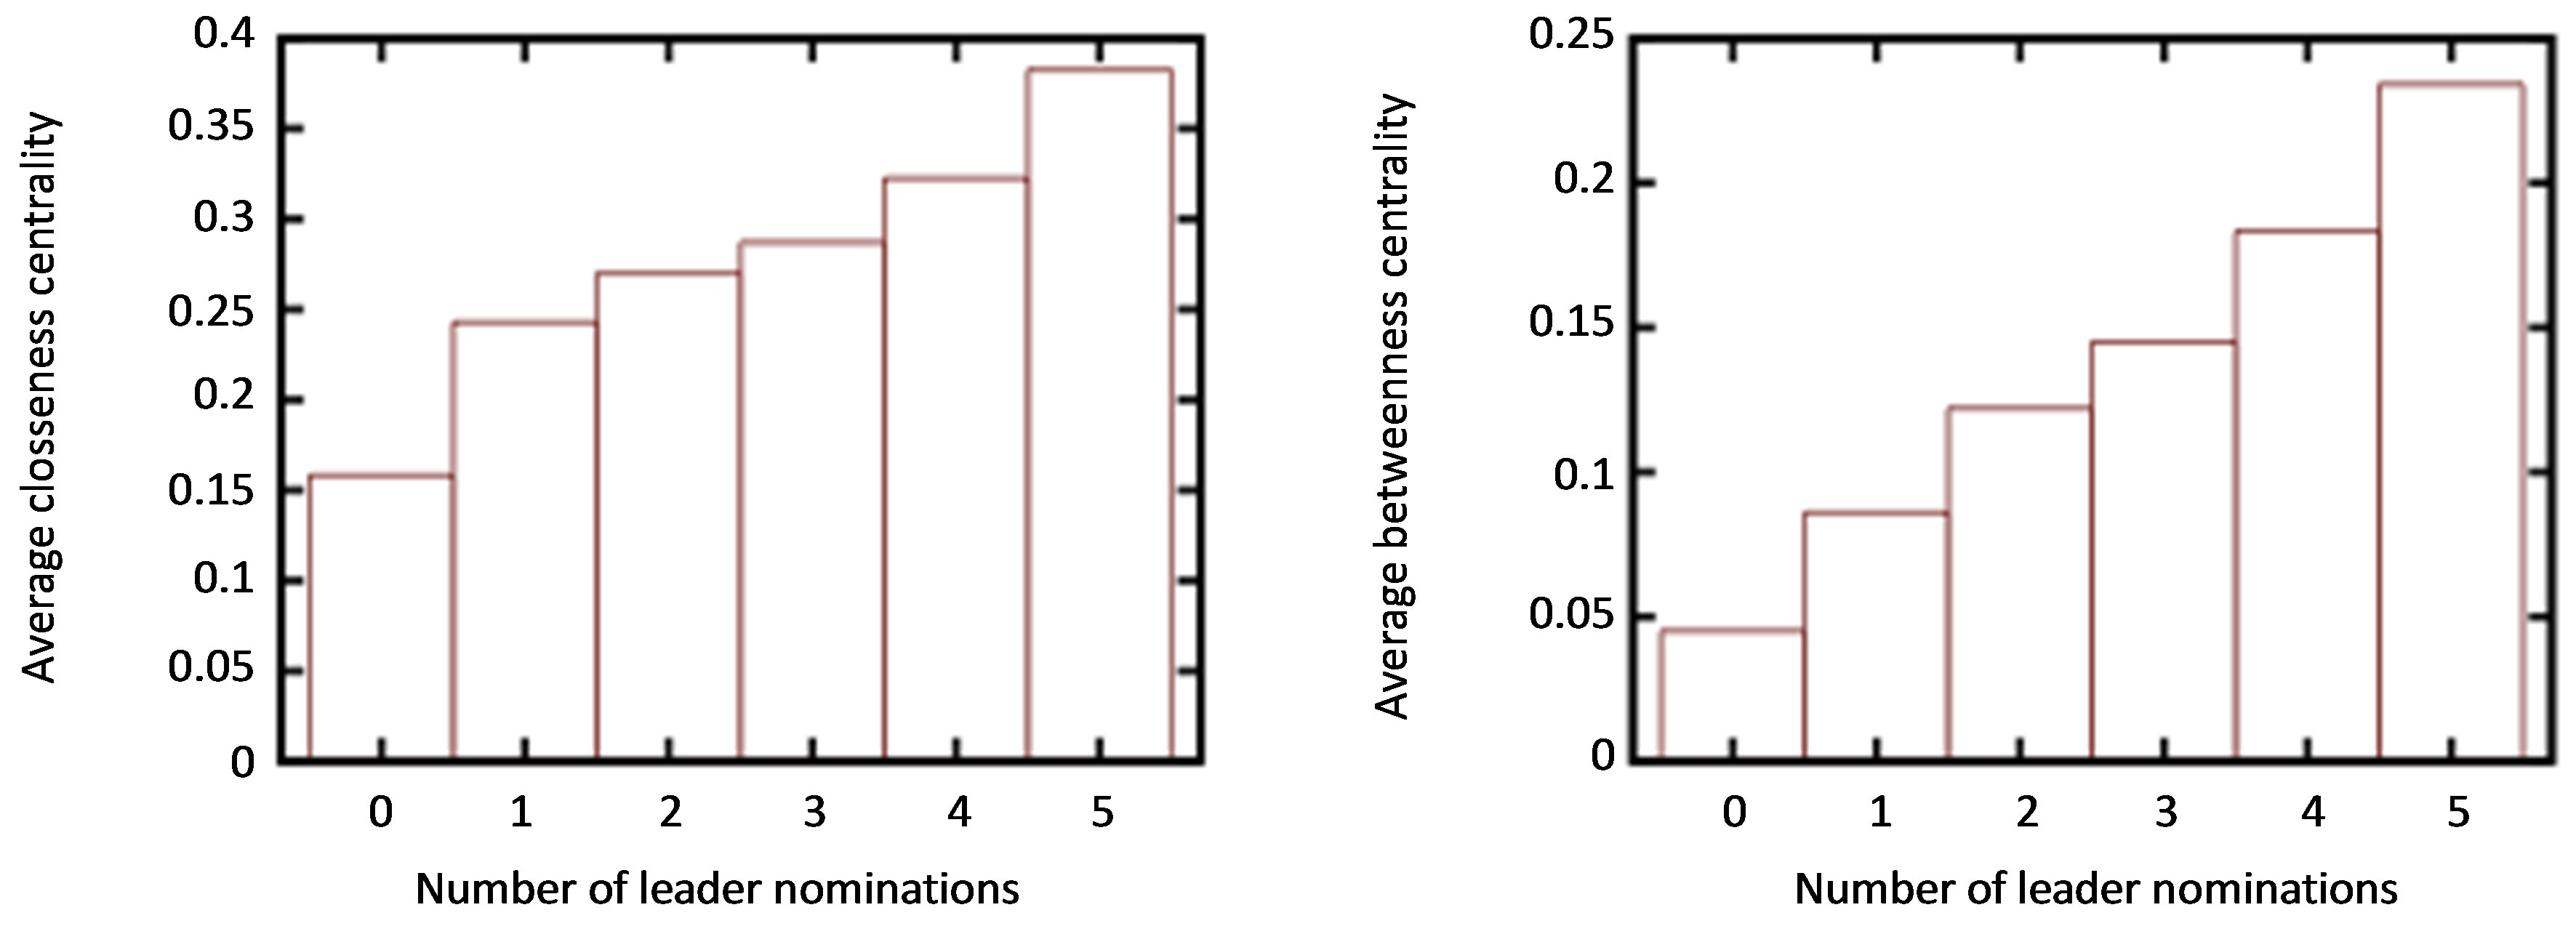 (b)
(b)
Figure 4. Average of centrality measures of participants for each category based on number of nominations as leader by other participants. (a) Average out-degree centrality; (b) Average in-degree centrality; (c) Average closeness centrality; (d) Average betweenness centrality.
 (a)
(a)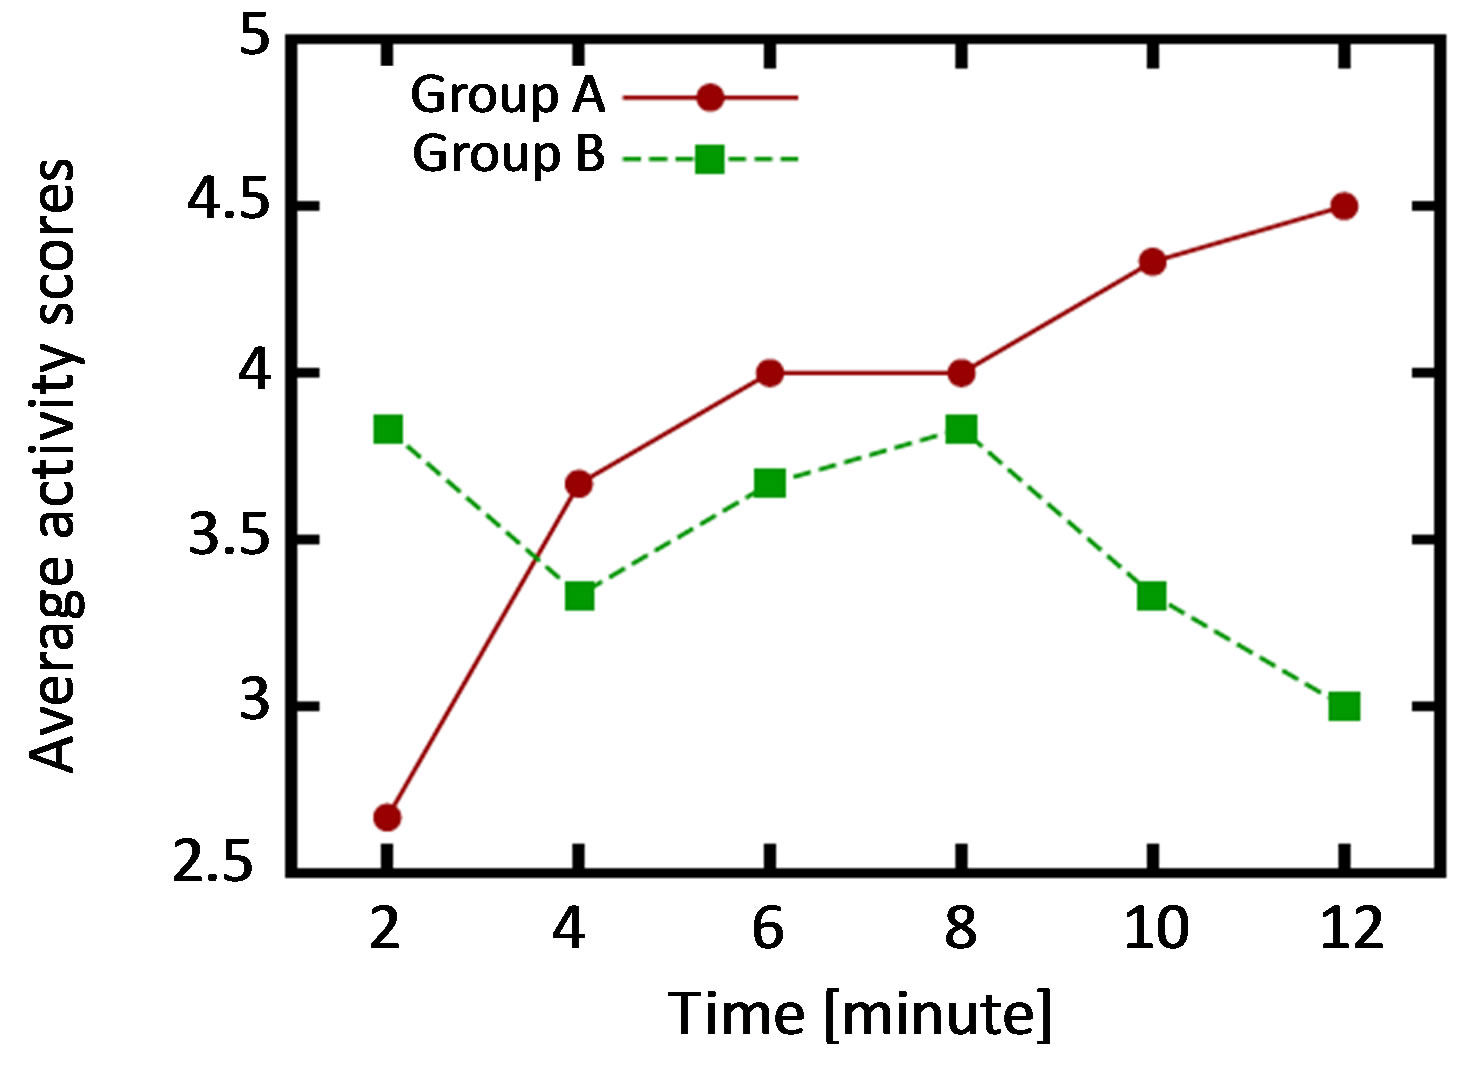 (b)
(b)
Figure 5. An example analysis of social networks, which are constructed with our system, for six-person social gatherings in a real environment other participants. (a) Evolution of graph centrality based on betweenness centrality; (b) Evolution of average activity scores subjectively given by six individuals.
time distribution follows a power law [33,34]. This bursty nature of human activities has attracted the attention of many researchers [33-36]. As examples, the inter-communication times of email messages, phone calls, and SMS messages have been analyzed [34]. Our system can monitor the events of face-to-face communication over very short time scales. We can therefore analyze interevent time of face-to-face communications with our system.
Figure 6 shows a relative frequency distribution of ∆ti,j , the inter-event time of face-to-face communications between participants i and j.
Figure 6 shows that inter-event time of face-to-face communications in our experiments follows a heavytailed distribution, like a power law distribution. A heavytailed distribution of inter-event time is observed in several types of human activities [34,37]. Our result provides evidence that supports the hypothesis that such a heavytailed distribution of inter-event time is a universal characteristic of human activity.
5.5. Estimation of Activity with Multiple Regression Analysis
Our system for dynamic social network construction can be used to construct a model for estimating the activity level of a conversation. We can obtain various measures of dynamically changing social networks. By analyzing the relation between such measures and activity levels, we can construct a model to estimate the activity level. Since estimating the current state of group is a key technique for realizing ambient environments, constructing a model to estimate activity level should be of great value.
In this section, we perform multiple regression analysis. As independent variables, we use the six variables shown in Table 1. As the dependent variable, we use the average of activity scores subjectively given by six participants.
Before performing multiple regression analysis, we calculate correlation coefficients among independent and dependent variables. Table 2 shows a correlation matrix of independent and dependent variables.
Table 2 shows that there are moderate correlations among independent variables such as Closeness and Outdegree. Therefore, it is expected that using all independent variables does not provide a good regression model.
We therefore perform stepwise selection to find appropriate variables, and construct a multiple regression model. Regression coefficients for each variable in the constructed model are shown in Table 3. The relation between predicted activity score with the model and the actual activity score is shown in Figure 7.
Table 3 shows the model can explain the activity level with coefficient of determination R2 = 0.28. Moreover, this result shows that variables In-degree and Duration are good indicators for estimating activity level. This result suggests that people feel conversations become
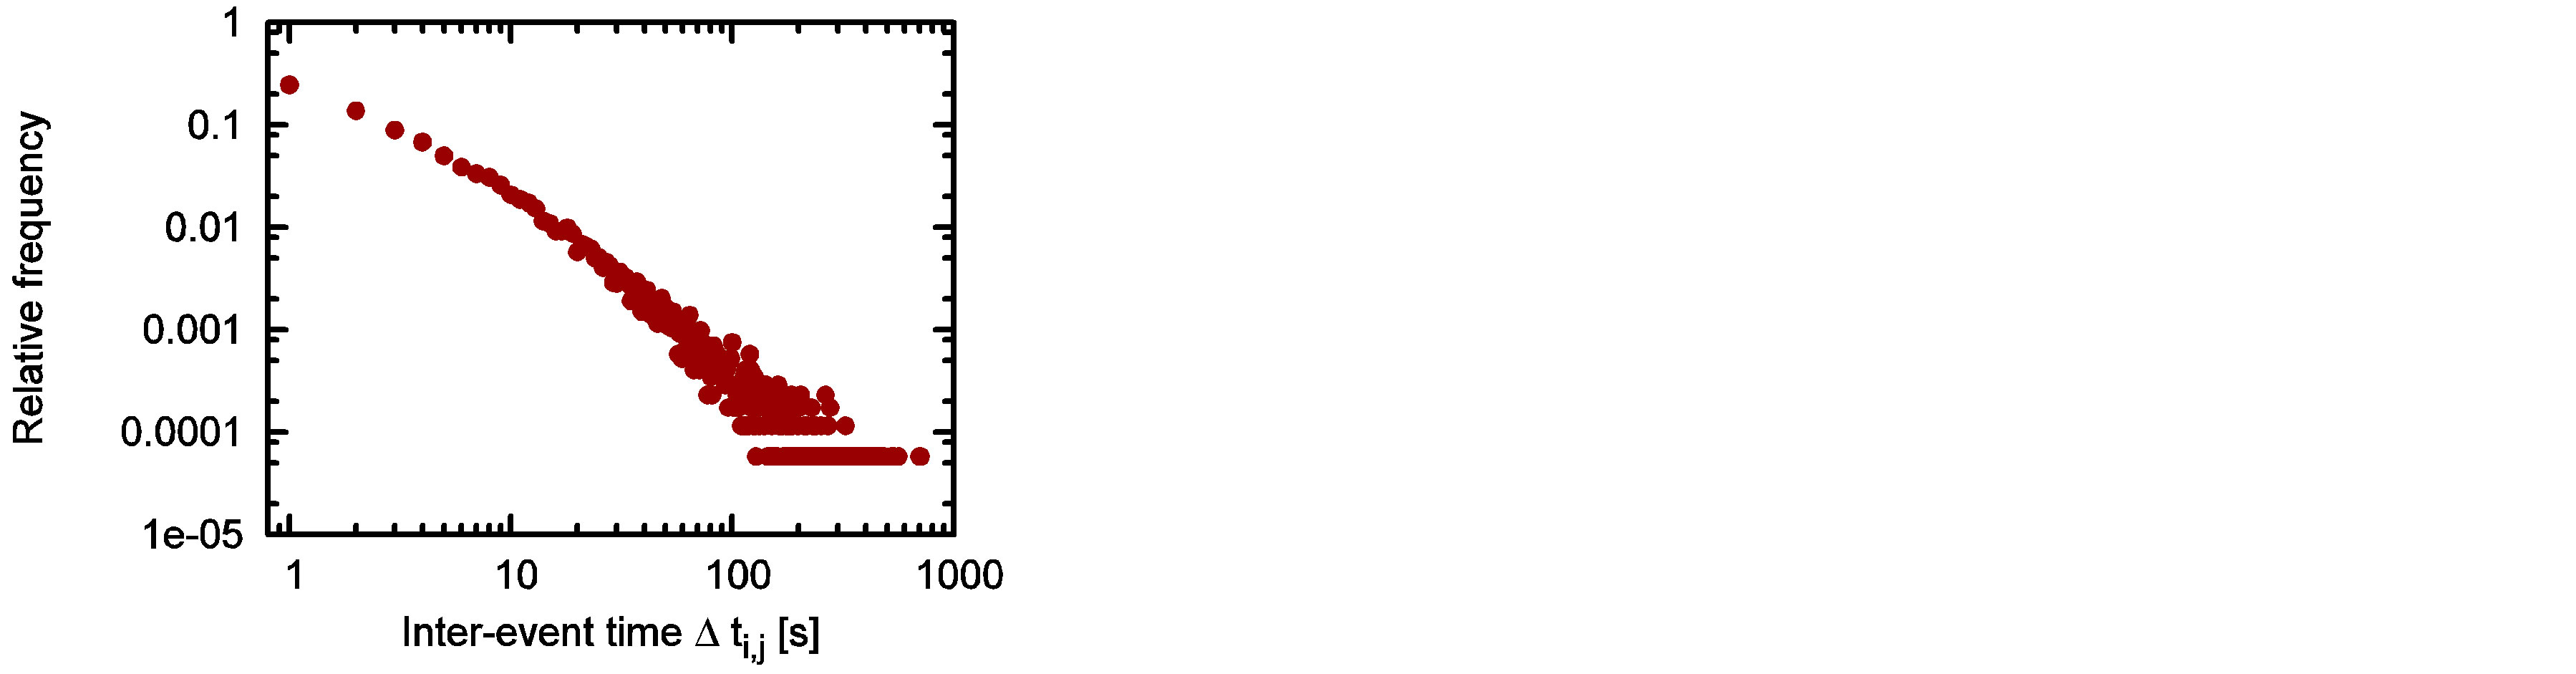
Figure 6. Relative frequency distribution of ∆ti,j, the inter-event time of face-to-face communications between participants i and j.
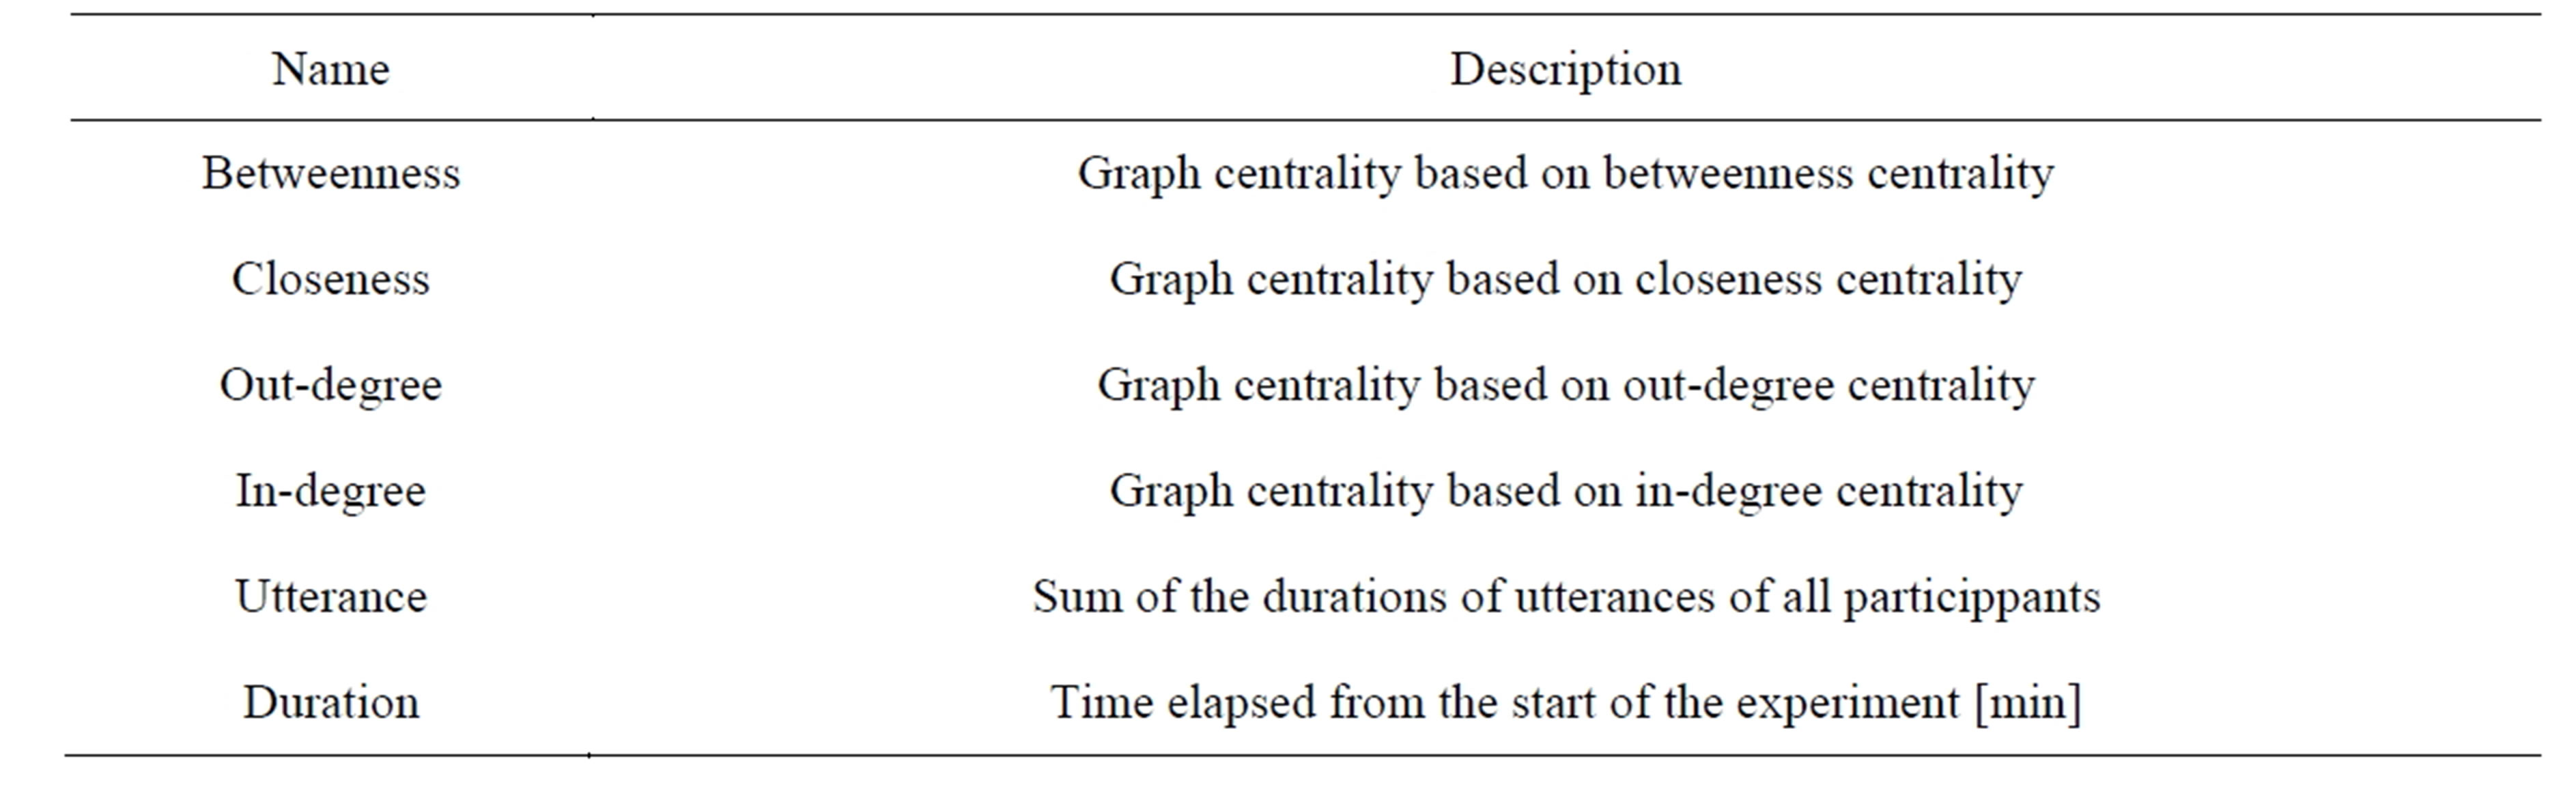
Table 1. Independent variables of multiple regression analysis.
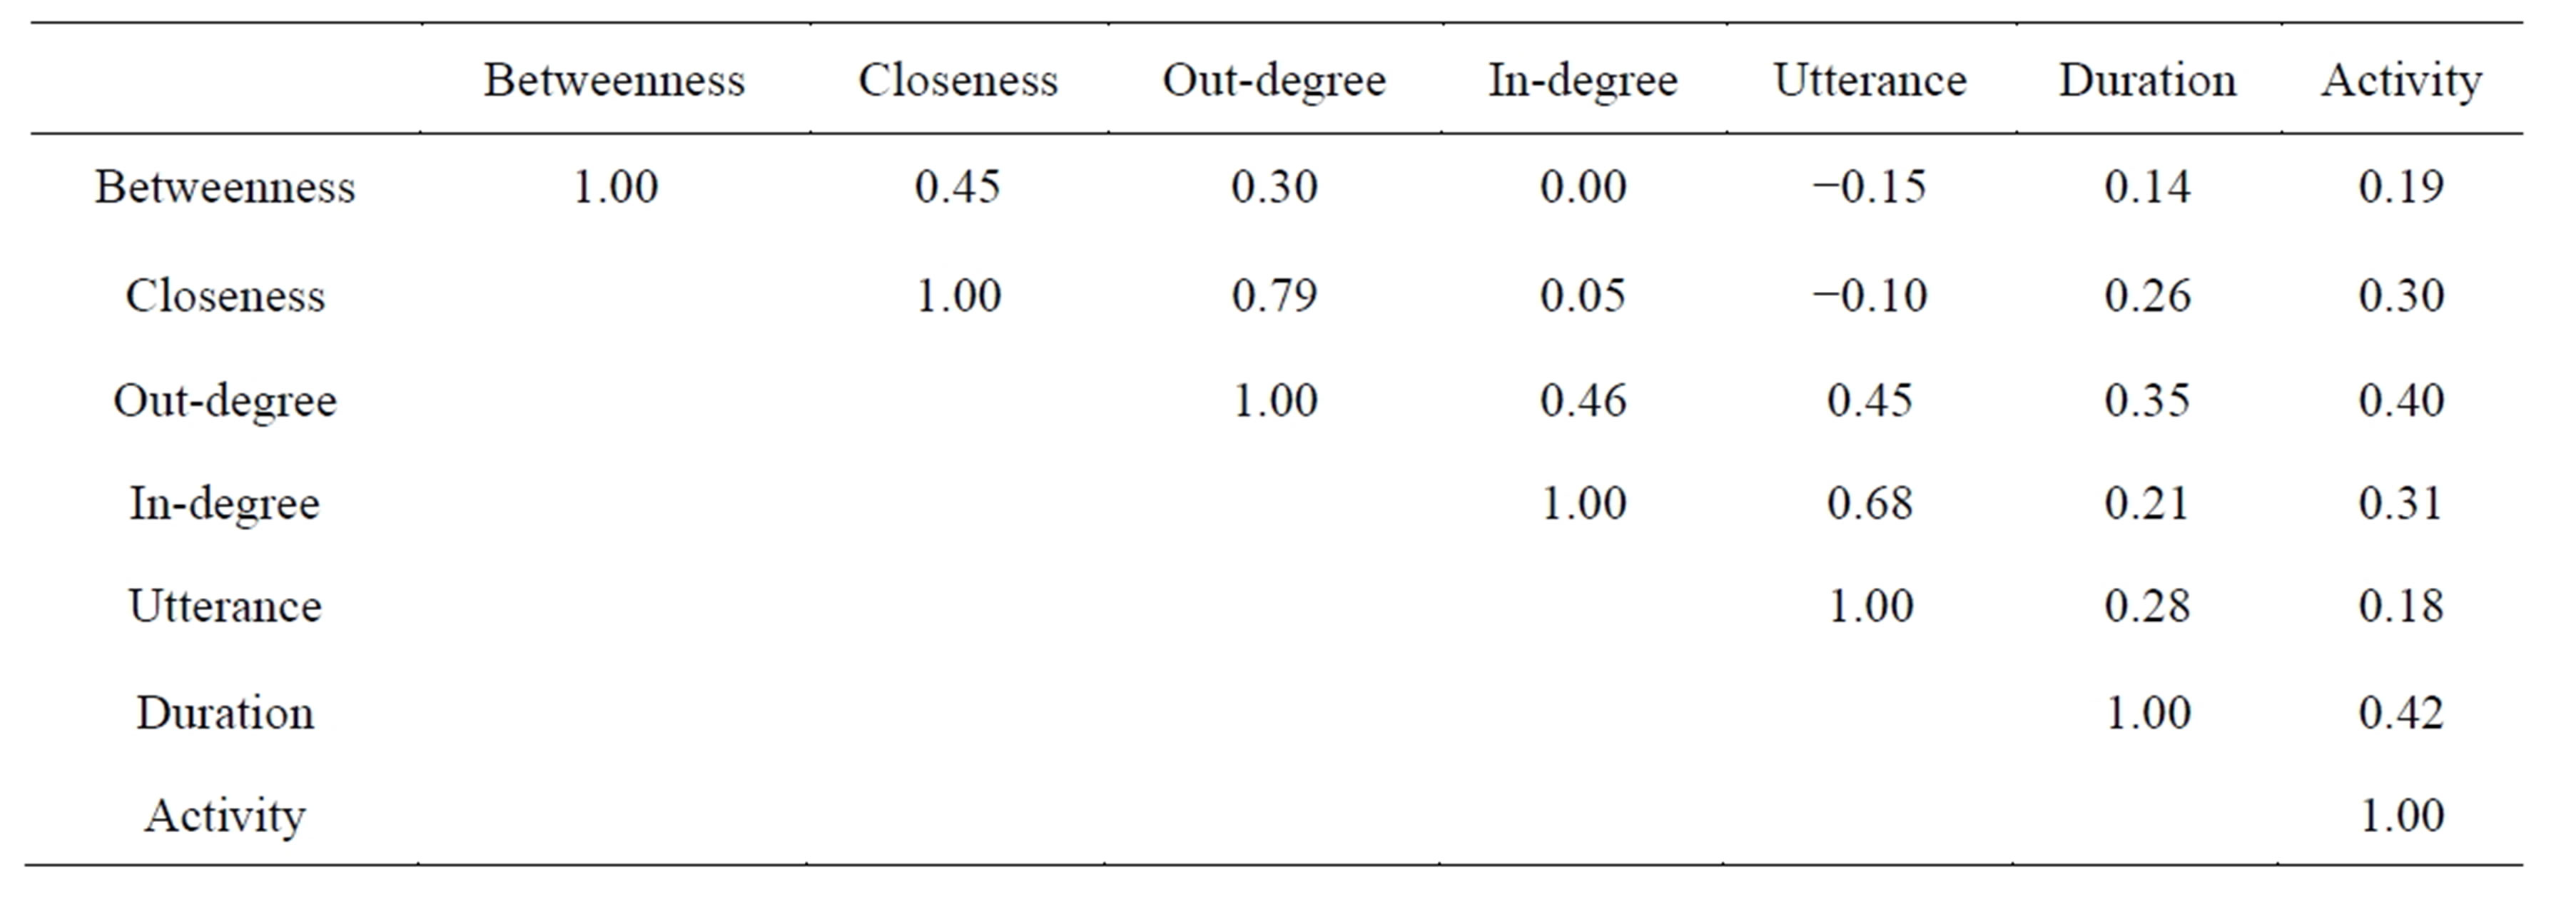
Table 2. Correlation matrix of independent and dependent variables in multiple regression analysis.

Table 3. Regression coefficients for each variable in the multiple regression model to estimate the activity level of conversation (coefficient of determination R2 = 0.28, **p < 0.01, *p < 0.05).
more active as time elapses. High graph centrality based on in-degree centrality implies the existence of a participant who listens to others. Therefore, it is expected that existence of such a participant activates conversations. This finding should be useful for promoting face-to-face conversation among people who has never met each other before.
Figure 7 shows moderate correlation between estimated and actual activity scores. This result suggests that a constructed model is effective for estimating the activity level of social gatherings in a real environment. However, we should investigate the effectiveness of this model by application to other groups. It is important future work to investigate the robustness of this model by applying it to different groups with different numbers of participants.
6. Conclusions and Future Work
This paper presented our vision of large-scale, dynamic social network analysis in real environments, which is expected to be enabled by the introduction of large-scale heterogeneous sensors to ambient environments. We have addressed challenges in realizing large-scale, dynamic social network analysis in real environments, and discussed several promising applications. Moreover, we have presented our design and implementation of a prototype system for quasi-realtime social network construction. Preliminary experimental results with the prototype system indicate the feasibility and effectiveness of quasi-realtime social network analysis.
For future work, we plan to analyze dynamically changing large-scale social networks with our implementation. In this paper, we have shown that our current prototype system works for small-scale social networks. However, to realize large-scale social network analysis, we need more large-scale experiments. Our current implementation uses infra-red camera for individual identification and positioning. For more large-scale environment, more scalable techniques such as RFID or AR (Augmented Reality) markers are suitable.

Figure 7. Relation between predicted activity score with the model and the actual activity score (correlation coefficient r = 0.53).
Acknowledgements
This research was partly supported by “Global COE (Centers of Excellence) Program” of the Ministry of Education, Culture, Sports, Science and Technology, Japan.
REFERENCES
- D. J. Watts, “A Twenty-First Century Science,” Nature, Vol. 445, No. 7127, 2007, pp. 489-489. http://dx.doi.org/10.1038/445489a
- S. P. Borgatti, A. Mehra, D. J. Brass and G. Labianca, “Network Analysis in the Social Sciences,” Science, Vol. 323, No. 5916, 2009, pp. 892-895. http://dx.doi.org/10.1126/science.1165821
- J. Scott, “Social Network Analysis: Developments, Advances, and Prospects,” Social Network Analysis and Mining, Vol. 1, No. 1, 2011, pp. 21-26. http://dx.doi.org/10.1007/s13278-010-0012-6
- D. Hinds and R. M. Lee, “Social Network Structure as a Critical Success Condition for Virtual Communities,” Proceedings of the 41st Annual Hawaii International Conference on System Sciences (HICSS’08), Hawaii, 7-10 January 2008, pp. 323-323.
- E. Holger, M. Lutz-Ingo and B. Stefan, “Scale-Free Topology of E-Mail Networks,” Physical Review E (Statistical, Nonlinear, and Soft Matter Physics), Vol. 66, 2002, Article ID: 035103.
- J. Xu, Y. Gao, S. Christley and G. Madey, “A Topological Analysis of the Open Source Software Development Community,” Proceedings of the 38th Annual Hawaii International Conference on System Sciences (HICSS’05), Hawaii, 3-6 January 2005, p. 198a.
- M. E. J. Newman, “Scientific Collaboration Networks. II. Shortest Paths, Weighted Networks, and Centrality,” Physical Review E, Vol. 64, No. 1, 2001, Article ID: 016132.
- G. Kossinets and D. J. Watts, “Empirical Analysis of an Evolving Social Network,” Science, Vol. 311, No. 5757, 2006, pp. 88-90. http://dx.doi.org/10.1126/science.1116869
- K. Goh, Y. Eom, H. Jeong, B. Kahng and D. Kim, “Structure and Evolution of Online Social Relationships: Heterogeneity in Unrestricted Discussions,” Physical Review E, Vol. 73, No. 6, 2006, Article ID: 066123.
- Y. Jin, C.-Y. Lin, Y. Matsuo and M. Ishizuka, “Mining Dynamic Social Networks from Public News Articles for Company Value Prediction,” Social Network Analysis and Mining, Vol. 2, No. 3, 2012, pp. 217-228. http://dx.doi.org/10.1007/s13278-011-0045-5
- D. O. Olguın, B. N. Waber, T. Kim, A. Mohan, K. Ara and A. Pentland, “Sensible Organizations: Technology and Methodology for Automatically Measuring Organizational Behavior,” IEEE Transactions on Systems, Man, and Cybernetics, Part B: Cybernetics, Vol. 39, No. 1, 2009, pp. 43-55. http://dx.doi.org/10.1109/TSMCB.2008.2006638
- L. Isella, J. Stehle, A. Barrat, C. Cattuto, J.-F. Pinton and W. V. den Broeck, “What’s in a Crowd? Analysis of Face-To-Face Behavioral Networks,” Journal of Theoretical Biology, Vol. 271, No. 1, 2011, pp. 166-180. http://dx.doi.org/10.1016/j.jtbi.2010.11.033
- K. Fujita, Y. Itoh, H. Ohsaki, N. Ono, K. Kagawa, K. Takashima, S. Tsugawa, K. Nakajima, Y. Hayashi and F. Kishino, “Ambient Suite: Enhancing Communication among Multiple Participants,” Proceedings of the 8th International Conference on Advances in Computer Entertainment Technology (ACE 2011), Lisbon, 8-11 November 2011, pp. 25:1-25:8.
- B. de Ruyter and E. Aarts, “Ambient Intelligence: Visualizing the Future,” Proceedings of the Working Conference on Advanced Visual Interfaces, Gallipoli, 25-28 May 2004, pp. 203-208. http://dx.doi.org/10.1145/989863.989897
- C. M. Roberts, “Radio Frequency Identification (RFID),” Computers & Security, Vol. 25, No. 1, 2006, pp. 18-26. http://dx.doi.org/10.1016/j.cose.2005.12.003
- S. J. McKenna, S. Jabri, Z. Duric, A. Rosenfeld and H. Wechsler, “Tracking Groups of People,” Computer Vision and Image Understanding, Vol. 80, No. 1, 2000, pp. 42- 56. http://dx.doi.org/10.1006/cviu.2000.0870
- A. Jain, L. Hong and S. Pankanti, “Biometric Identification,” Communications of the ACM, Vol. 43, No. 2, 2000, pp. 90-98. http://dx.doi.org/10.1145/328236.328110
- A. Ward, A. Jones and A. Hopper, “A New Location Technique for the Active Office,” IEEE Personal Communications, Vol. 4, No. 5, 1997, pp. 42-47. http://dx.doi.org/10.1109/98.626982
- M. E. J. Newman and M. Girvan, “Finding and Evaluating Community Structure in Networks,” Physical Review E, Vol. 69, No. 2, 2004, Article ID: 026113. http://dx.doi.org/10.1103/PhysRevE.69.026113
- A. Clauset, M. E. J. Newman and C. Moore, “Finding Community Structure in Very Large Networks,” Physical Review E, Vol. 70, No. 6, 2004, Article ID: 066111. http://dx.doi.org/10.1103/PhysRevE.70.066111
- L. C. Freeman, “Centrality in Social Networks Conceptual Clarification,” Social Networks, Vol. 1, No. 3, 1979, pp. 215-239. http://dx.doi.org/10.1016/0378-8733(78)90021-7
- V. Latora and M. Marchiori, “A Measure of Centrality Based on Network Efficiency,” New Journal of Physics, Vol. 9, No. 6, 2007, p. 188. http://dx.doi.org/10.1088/1367-2630/9/6/188
- Y. Hayashi, Y. Itoh, K. Takashima, K. Fujita, K. Nakajima, I. Daibo and T. Onoye, “Cup-le: A Cup-Shaped Device for Conversational Experiment,” Proceedings of the 1st International Workshop on Ambient Information Technologies (AMBIT 2012), Orange County, 5 March 2012, pp. 36-37.
- P. Bonacich, “Power and Centrality: A Family of Measures,” The American Journal of Sociology, Vol. 92, No. 5, 1987, pp. 1170-1182. http://dx.doi.org/10.1086/228631
- L. C. Freeman, “A Set of Measures of Centrality Based on Betweenness,” Sociometry, Vol. 40, No. 1, 1977, pp. 35-41. http://dx.doi.org/10.2307/3033543
- D. J. Watts and S. H. Strogatz, “Collective Dynamics of ‘Small-World’ Networks,” Nature, Vol. 393, No. 6684, 1998, pp. 440-442. http://dx.doi.org/10.1038/30918
- S. P. Borgatti, “Identifying Sets of Key Players in a Social Network,” Computational & Mathematical Organization Theory, Vol. 12, No. 1, 2006, pp. 21-34. http://dx.doi.org/10.1007/s10588-006-7084-x
- D. Batallas and A. Yassine, “Information Leaders in Product Development Organizational Networks: Social Network Analysis of the Design Structure Matrix,” IEEE Transactions on Engineering Management, Vol. 53, No. 4, 2006, pp. 570-582. http://dx.doi.org/10.1109/TEM.2006.883706
- S. Tsugawa, H. Ohsaki and M. Imase, “Inferring Leadership of Online Development Community Using Topological Structure of Its Social Network,” Journal of the Infosocionomics Society, Vol. 7, No. 1, 2012, pp. 17-27.
- L. C. Freeman, D. Roeder and R. R. Mulholland, “Centrality in Social Networks: II. Experimental Results,” Social Networks, Vol. 2, No. 2, 1979, pp. 119-141. http://dx.doi.org/10.1016/0378-8733(79)90002-9
- B. Mullen, C. Johnson, and E. Salas, “Effects of Communication Network Structure: Components of Positional Centrality,” Social Networks, Vol. 13, No. 2, 1991, pp. 169- 185. http://dx.doi.org/10.1016/0378-8733(91)90019-P
- D. J. Brass, “Being in the Right Place: A Structural Analysis of Individual Influence in an Organization,” Administrative Science Quarterly, Vol. 29, No. 4, 1984, pp. 518- 539. http://dx.doi.org/10.2307/2392937
- A. L. Barabasi, “The Origin of Bursts and Heavy Tails in Human Dynamics,” Nature, Vol. 435, No. 7039, 2005, pp. 207-211. http://dx.doi.org/10.1038/nature03459
- K. I. Goh and A. L. Barabasi, “Burstiness and Memory in Complex Systems,” EPL (Europhysics Letters), Vol. 81, No. 4, 2008, Article ID: 0610233.
- N. Masuda, J. S. Kim and B. Kahng, “Priority Queues with Bursty Arrivals of Incoming Tasks,” Physical Review E, Vol. 79, No. 3, 2009, Article ID: 036106. http://dx.doi.org/10.1103/PhysRevE.79.036106
- M. Karsai, K. Kaski and J. Kertesz, “Correlated Dynamics in Egocentric Communication Networks,” PLoS ONE, Vol. 7, No. 7, 2012, p. e40612. http://dx.doi.org/10.1371/journal.pone.0040612
- C. Cattuto, W. Van den Broeck, A. Barrat, V. Colizza, J. Pinton and A. Vespignani, “Dynamics of Person-ToPerson Interactions from Distributed RFID Sensor Networks,” PLoS ONE, Vol. 5, No. 7, 2010, p. e11596. http://dx.doi.org/10.1371/journal.pone.0011596