International Journal of Medical Physics, Clinical Engineering and Radiation Oncology
Vol.3 No.1(2014), Article ID:42560,5 pages DOI:10.4236/ijmpcero.2014.31002
Evaluation and Commissioning of Commercial Monte Carlo Dose Algorithm for Air Cavity
1Miyakojima IGRT Clinic, Osaka, Japan
2Department of Medical Physics & Engineering, Osaka University Graduate School of Medicine, Osaka, Japan
Email: *hide-miura@osaka-igrt.or.jp
Copyright © 2014 Hideharu Miura et al. This is an open access article distributed under the Creative Commons Attribution License, which permits unrestricted use, distribution, and reproduction in any medium, provided the original work is properly cited. In accordance of the Creative Commons Attribution License all Copyrights © 2014 are reserved for SCIRP and the owner of the intellectual property Hideharu Miura et al. All Copyright © 2014 are guarded by law and by SCIRP as a guardian.
Received December 3, 2013; revised January 2, 2014; accepted February 1, 2014
KEYWORDS
Monte Carlo; Pencil Beam; Air Cavity; Treatment Planning
ABSTRACT
The purpose of this study was to compare the Pencil Beam (PB) with Monte Carlo (MC) calculated dosimetric results using phantoms for air cavity region. Measurements in Tough water phantom with air gaps were used to verify the calculated dose. The plane-parallel ionization chamber was moved from 2 mm to 20 mm behind air gap. Calculations were performed for various air gaps (1.0, 2.0, 3.0 and 4.0 cm) and field sizes (4.2 × 4.2, 6.0 × 6.0 and 9.8 × 9.8 cm2). The lateral missing tissue measurement was performed using the radiochromic RT-QA film. Dose difference between PB and chamber measurement near an air gap was greater for smaller field size, larger air gap thickness, and shallower depth behind air gap. As the distance from the phantom edge became shorter, the dose differences of the PB calculation and film measurement became larger. MC calculations were found within 3% agreement to the measured dose distributions. Our results demonstrate an excellent agreement between ionization chamber and radiochromic RT-QA film measurements and MC calculations.
1. Introduction
The effect of heterogeneous corrections is an important issue that has increasingly drawn the attention of the medical physics community for last several years. In the report of Task Group No. 65 of the Radiation Therapy Committee of the American Association of Physicists in Medicine, inhomogeneity correction algorithms were categorized according to the level of anatomy sampled for scatter calculation and the inclusion or exclusion of electron transport [1]. The two photon dose algorithms available with the iPlan RT Dose (Brainlab, Munich, Germany) are the Pencil Beam (PB) and the Monte Carlo (MC) algorithms. Hurkmans et al. reported the limitations of dose calculations in the case of head & neck tumor using the PB algorithm [2]. MC algorithm was able to predict the dose distributions with a higher accuracy [3]. Many researchers have investigated the effect of air cavities on the dose distribution and dose reduction near air cavity, depending on geometry, beam energy, and field size using various MC codes in water equivalent phantoms [4-7].
Fragoso et al. performed an experimental verification of the iPlan v. 4.1 MC algorithm, using water-, lungand bone-equivalent materials to investigate the differences between measured and calculated dose distributions [8]. However, reports of PB and MC calculations for air cavity using commercial treatment planning system are lacking. The purpose of this study was the evaluation and commissioning of iPlan RT MC Dose algorithm for air cavity region. We compared the calculated dosimetric results between PB and MC algorithms using phantoms. In addition, we also compared the results of dose differences between PB and MC algorithms for maxillary cancer patient.
2. Materials and Methods
Figure 1 shows the schematic of the experimental setup for dose measurements. Tough Water phantom of 3 and 20 cm thickness was used above and below the air gap, respectively. Source-to-surface distance (SSD) was set at 950 mm. Tube voltage of 120 kV was used in the computer tomography scans to produce a group of images of 512 × 512 pixels, with the slice thickness of 1.25 mm. Markus parallel-plate ionization chamber (PTW, Freiburg) was used to measure depth dose distributions and dose profiles were measured using Gafchromic RTQA film. The plane-parallel ionization chamber was moved in 1 mm steps from 2 mm to 10 mm and in 2 mm steps from 10 mm to 20 mm behind the air gap. Central axis depth doses were measured with two different approaches. At first, the field size was kept constant to 4.2 × 4.2 cm2 and thickness of air gap was varied from 1.0 cm to 4.0 cm with the increments of 1.0 cm. Then, the thickness of air gap was kept fixed to 3.0 cm for field sizes of 4.2 × 4.2, 6.0 × 6.0 and 9.8 × 9.8 cm2.
The radiochromic RTQA (ISP Corp, Wayne NJ, USA) film was inserted into Tough Water phantoms using a constant field size of 9.8 × 9.8 cm2. Epson Expression 1680 desktop flat-bed document scanner was used. Calibration curve was created in the following fashion: One sheet of film was cut into 3.0 × 3.0 cm2 pieces and 6 pieces of film were irradiated to establish each calibration curve. Pieces of film were exposed to 50, 100, 150, 200, 250, 300 monitor units, respectively.
The plan was calculated with the iPlan RT Dose ver. 4.1.2 treatment planning system. Monitor units (MU) were determined from the prescribed dose to the isocenter, based on the PB algorithm. The plan was recalculated using MC algorithm while keeping the same planning parameters for beam arrangement, leaf positions, isocenter, position, and monitor unit, using the full MLC
 (a) (b)
Figure 1. Schematic of the phantoms used in the chamber and film experiments. (a) The black box represents the plane-parallel ionization chamber; (b) The black line represents the RT-QA film.
geometry simulation ‘Accuracy Optimized Model’ with a spatial resolution of 2 mm and variance of 1%. The 6 MV photon beam energy was used from Novalis shaped beam radiosurgery unit (Brainlab, Munich, Germany). The charge for 200 MU was measured three times for each position of the ionization chamber and the average of these measured values was used.
We selected the treatment plan of a patient who had been treated with Intensity-modulated radiation therapy (IMRT) for squamous cell carcinoma of maximally sinus. The gross tumor volume (GTV) was defined as the visualization of any gross disease. The clinical target volume (CTV) was defined as the GTV plus a 1 mm margin. The planning target volume (PTV) was defined as the CTV plus a 2 mm margin to account for tumor motion and setup uncertainty. GTV, CTV and PTV sizes were 1.5, 2.7 and 4.4 cc, respectively. A dose of 50 Gy in 10 fractions was prescribed to 95% of the PTV (D95) with PB algorithm in this case. We recalculated the planned dose using MC algorithm while keeping the same number of MU per beam. A dose-volume histogram (DVH) analysis was performed for GTV, CTV and PTV. The brainstem, optic chiasm, eyes, and optic nerves were contoured as organs at risk (OARs). The following dose indices were used to evaluate the plan quality.
a) PTV D95; the minimum relative dose that covers 95% of the volume of the PTV.
b) PTV V95; the relative volume of PTV that receives at least 95% of the prescribed dose.
c) GTV D99 CTV D99; the minimum relative dose that covers 99% of the volume of the GTV and CTV, respectively.
3. Results
Figure 2 shows the dose distributions in a water phantom for 4.2 × 4.2 cm2 field size with air gap. Significant dose difference can be observed between PB and MC calculations in re-build up region.
Figure 2. Dose distributions calculated using (a) PB and (b) MC algorithms in a Tough water phantom for 4.2 × 4.2 cm2 field size with air gap. Compared to PB, MC calculations provide substantially lower doses to the air gap and rebuildup region.
Figure 3 shows the calculated and measured data for various field sizes with a fixed air gap of 3 cm. A direct relationship can be observed between calculated dose and field size with fixed air gap. PB calculated results did not match the measured data in re-build up regions. At 2 mm depth, the calculated results by the PB algorithm were 16.1% higher, whereas, MC calculated results were only 0.8% higher than measured dose with field size of 4.2 × 4.2 cm2.
Figure 4 shows the calculated and measured data for various air gaps with a fixed field size of 4.2cm. An inverse relationship can be observed between calculated dose and air gap with fixed field size. PB calculated results did not match the measured data in re-build up regions. At 2 mm depth, the calculated results by the PB algorithm were 20.4% higher, whereas, MC calculated results were only 3.8% higher than measured with air gap of 3.0 cm.
Figure 5 shows the dose distributions calculated using PB and MC algorithms, and calculated and measured dose profiles in a water phantom for 9.8 × 9.8 cm2 field size with lateral missing. Significant dose difference can be observed between PB and MC calculations near to the air gap. The PB results were 7.5% higher and MC results were 1.3% higher than measured dose at 10 mm from the phantom edge. As the distance from the phantom edge became shorter, the dose differences of the PB calculations became larger. The MC calculations and film measurements were in good agreement.
Figure 6 shows the comparison of dose distributions and DVHs for the PB and MC calculated plans. For PB calculated plan, the dose distribution was more homogeneous than MC calculated plan. The Table 1 compares the PB and MC calculated plans with regard to the PTV, CTV and GTV. D95 of the PTV, D99 of the GTV and D99 of the GTV using the MC algorithm were on average 26.4%, 30.7% and 25.8% lower than those with the PB algorithm, respectively. For OARs, the dose difference between PB and MC calculations is small.
4. Discussions
The results of the present study indicate the calculated dose differences between PB and MC algorithms. For both algorithms, the calculated dose increases with increasing field size. For MC algorithm, this effect is more significant in re-build up region showing a non-linear curve. For PB algorithm, this effect is comparatively less
Figure 3. Depth dose in a Tough water phantom for 4.2 × 4.2 cm2, 6.0 × 6.0 cm2, and 9.8 × 9.8 cm2 field sizes with 3 cm air gap. Solid lines show the PB calculations. Dashed lines represent the MC calculations. Measured values are shown by dots.
Figure 4. Depth dose in a tough water phantom for 1 - 4 cm air cavities with 4.2 × 4.2 cm2 field size. Solid lines show the PB calculations. Dashed lines represent the MC calculations. Measured values are shown by dots.
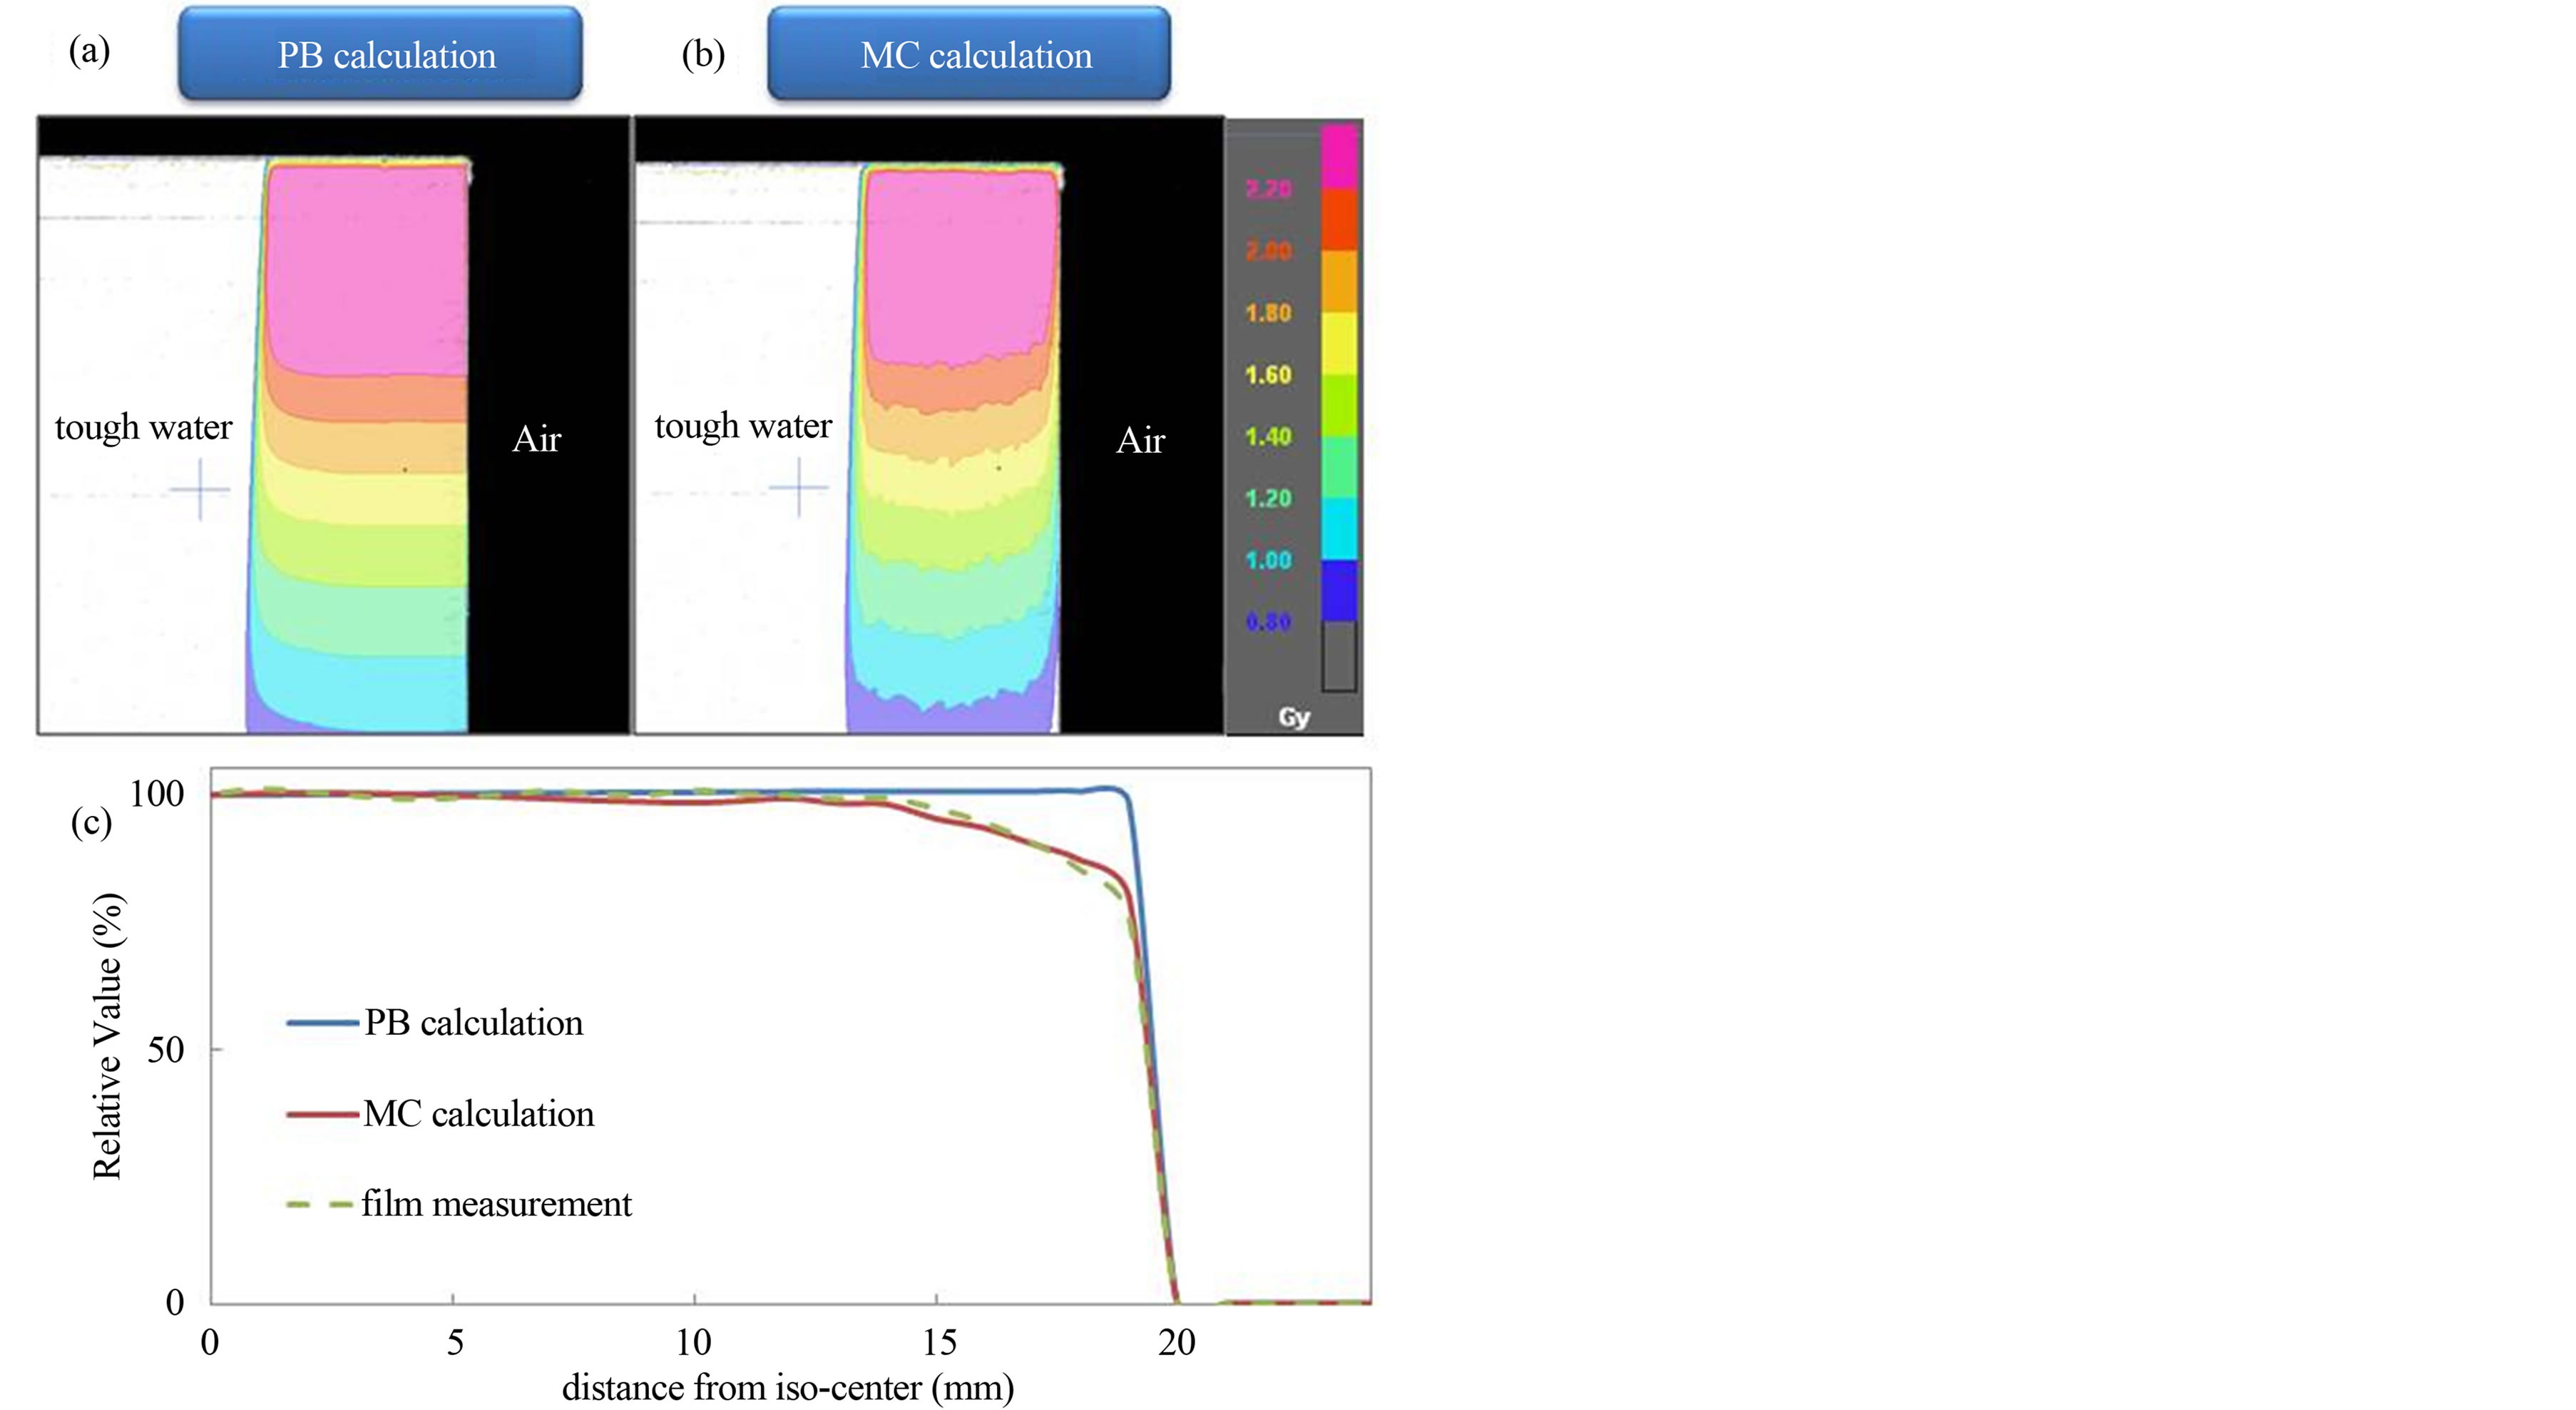
Figure 5. Dose distributions using (a) PB and (b) MC algorithms, and (c) calculated and measured dose profiles for the lateral missing phantom. Compared to PB, MC calculations provide substantially lower doses in the close proximity to the air.
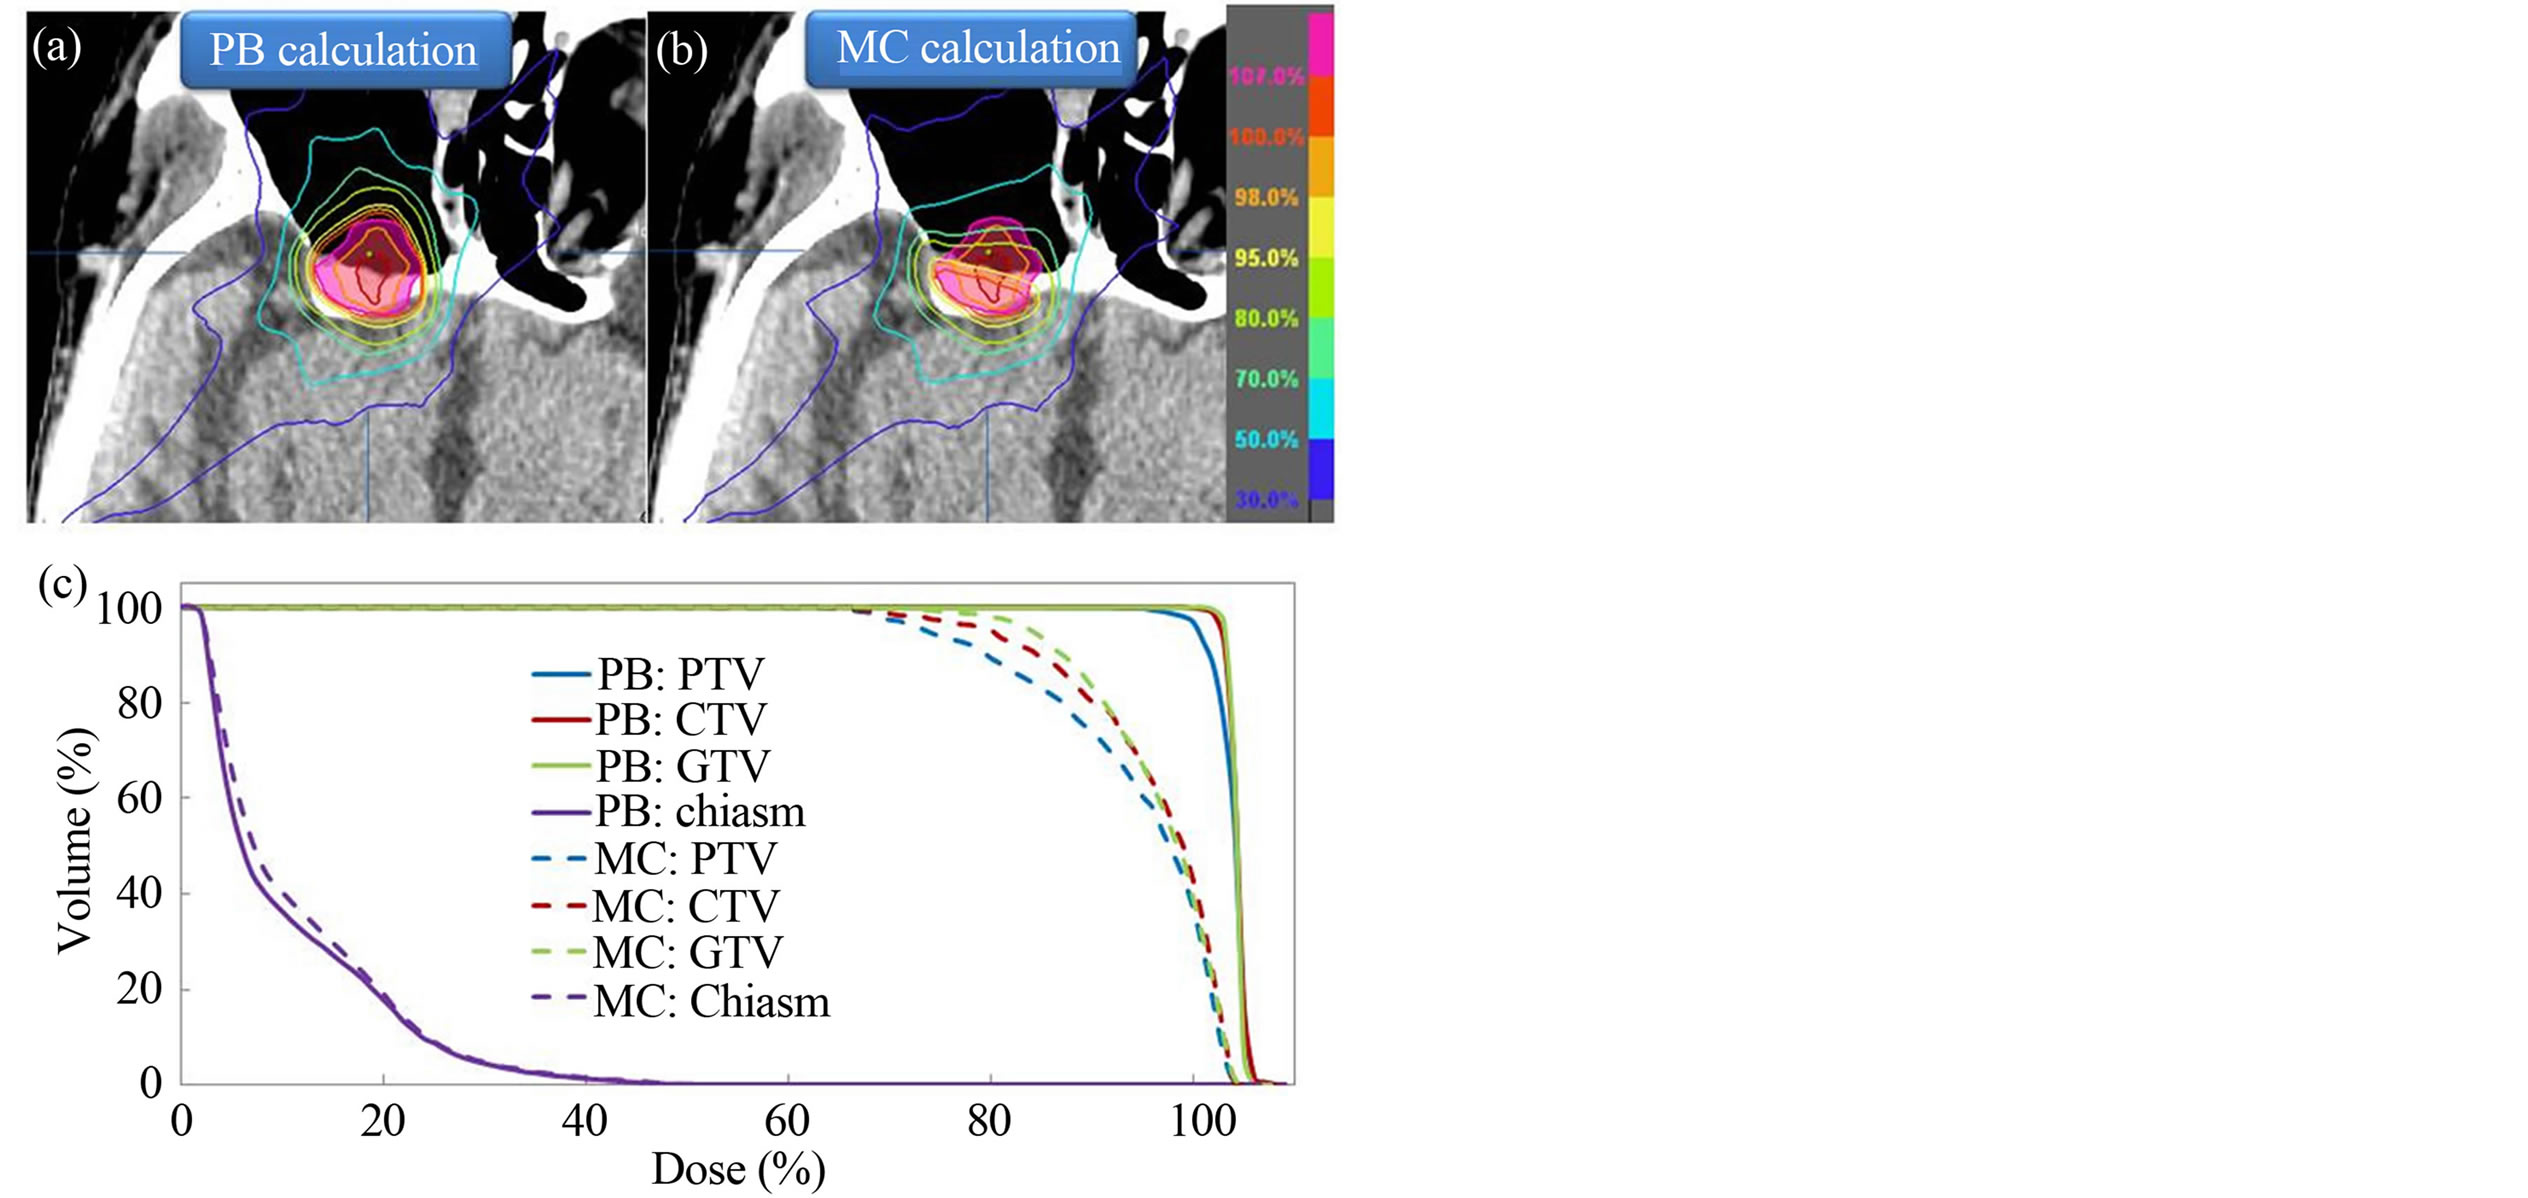
Figure 6. Planned dose distributions calculated by (a) PB and (b) MC algorithms for a patient with maximally sinus cancer; (c) comparison of dose volume histograms (DVHs) between PB (solid line) and MC (dashed line) calculated plans for the same patient. The PTV is shown as a translucent pink region.
prominent in re-build up region showing a linear curve. The PB calculated dose show a minor linear decrease in re-build up region with increase in the thickness of air gap. However, MC calculated dose reduces more significantly in re-build up region with increase in the size of
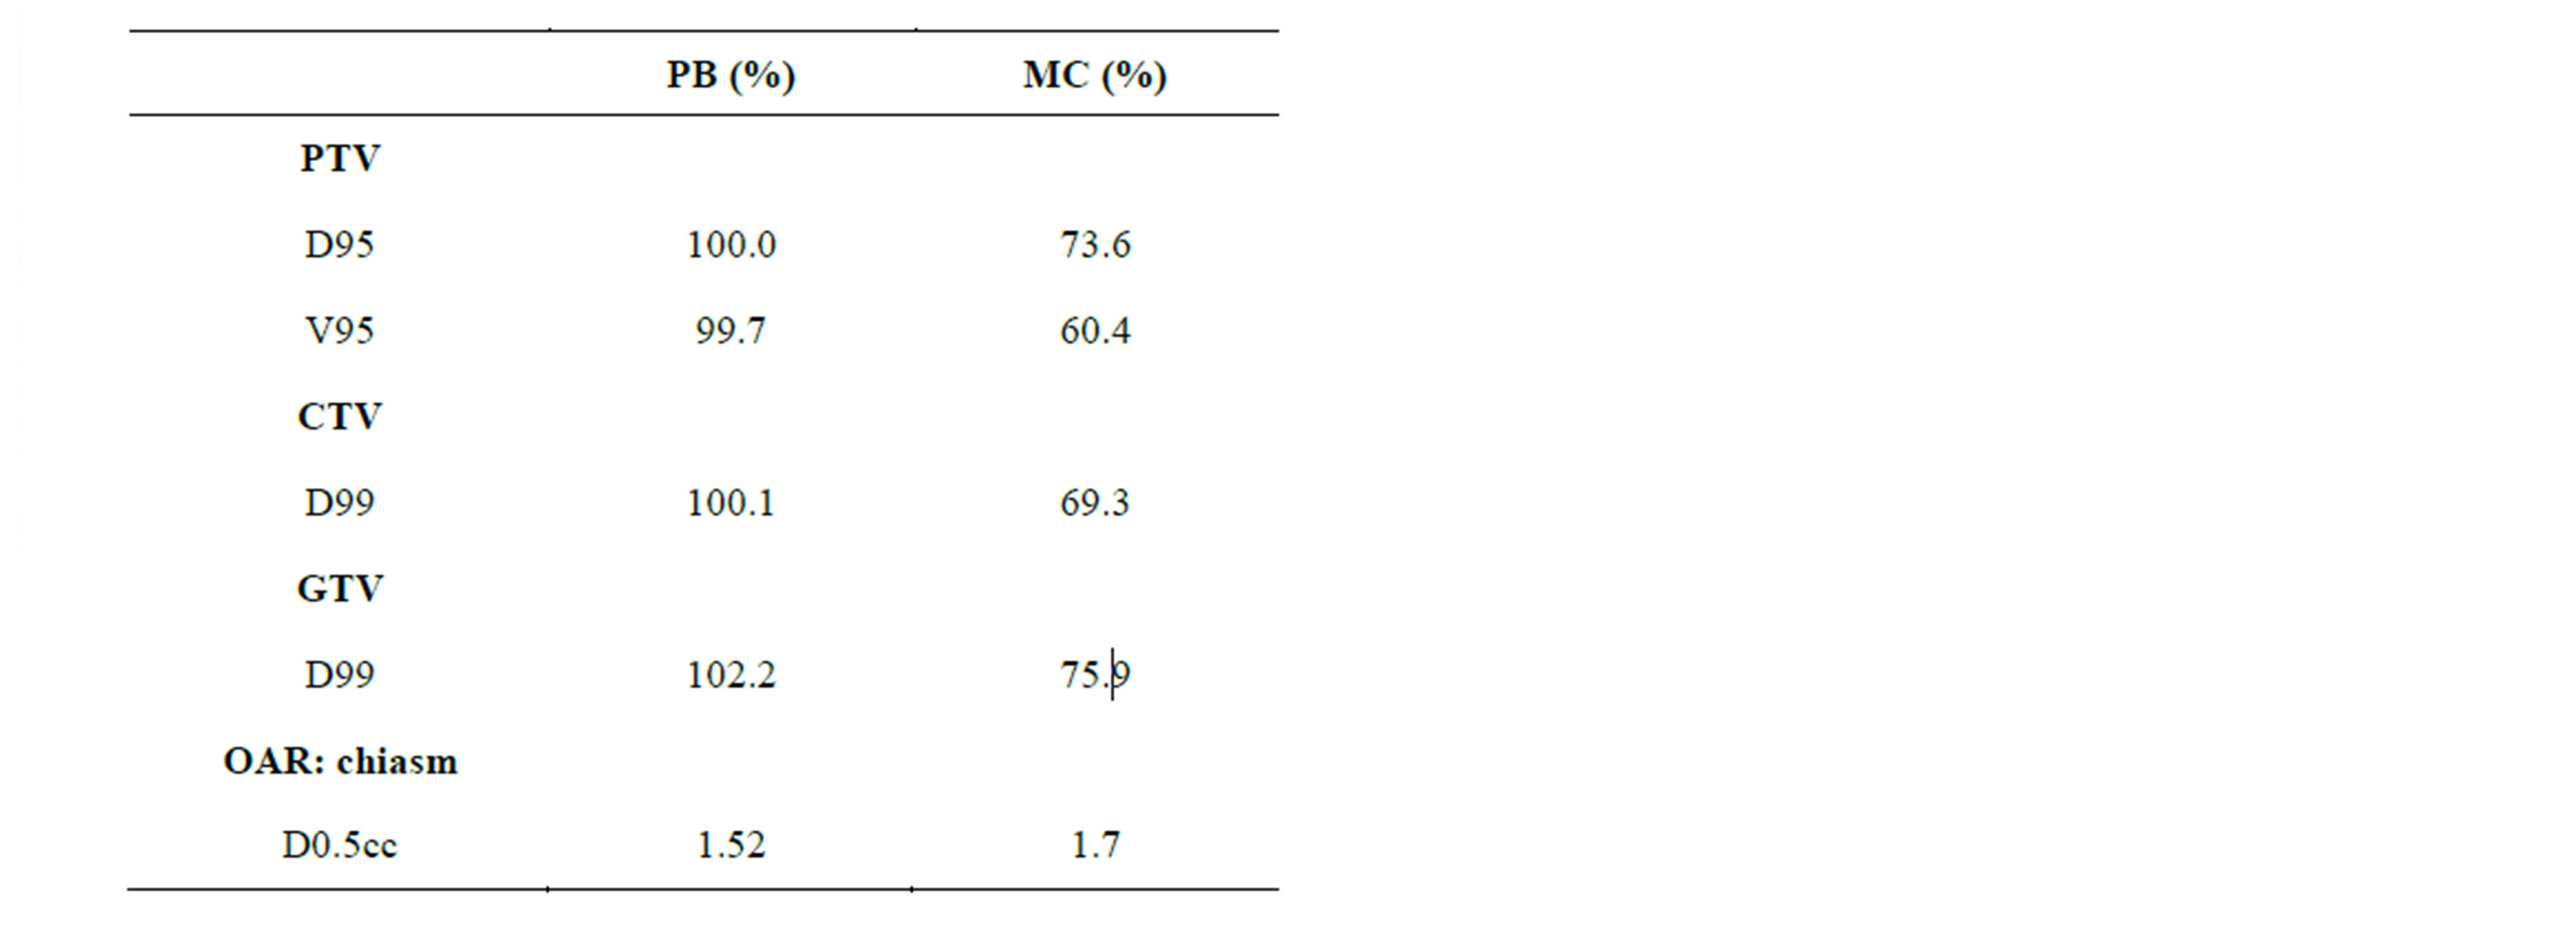
Table 1. Dosimetric comparison between PB and MC calculated plans.
air gap showing a non-linear curve. The PB algorithms are able to account for the change of primary transmission in heterogeneous media with relatively simple algorithms, but cannot account for loss of electronic equilibrium at near tissue-air interfaces. MC algorithms model the actual physical processes leading to a dose deposition, including secondary electron distribution [9]. The reduction in dose to the points located beyond the air gap is due to a reduction in scattered radiation, produced in the material placed before the air gap. The loss in scatter contribution to the point of measurement is due to the lateral spread of the scattered radiation within the air gap. A re-build up region occurs as electrons are once again generated in water-equivalent material. Allen et al. reported that the dose reduction near an air cavity was greater for smaller field size, higher energy, larger air cavity size, and shallower depth in water where the air cavity was situated [10]. Klein et al. results showed that following a 2.0 cm wide air channel for a 4 MV X-ray with 4 × 4 cm2 field, there was an 11% under dose at the distal interface, while a 2.0 cm cubic cavity yielded only a 3% loss [4]. Petoukhova et al. reported an excellent agreement of i Plan RT Dose MC calculation with the experimental data for phantoms with air cavities [11].
Behrens reported that the build-down effect was much smaller than the build-up effect and therefore not as important [12]. The dose reduction near an air cavity would have a negative clinical impact in a treatment if the region adjacent to the cavity consists of the target. Wang et al. employed the MC algorithm to assess the degree to which tissue inhomogeneities in the head & neck affect static field conformal treatment plans. They concluded that the pencil-beam calculation corrected for primary attenuation by the equivalent path-length is a sufficiently accurate method for head & neck treatment planning using 6-MV photons [13]. Yoon M et al. showed that when the beams pass through the oral cavity in anthropomorphic head & neck phantom, the average dose difference becomes significant, revealing about 10% dose difference to prescribed dose at the isocenter [14]. Waldron et al. reported significant local recurrence rate of malignant disease in two separate retrospective trials involving 29 ethmoid sinus and 110 maxillary antrum cancer cases treated with curative intent. In these studies they expressed concern about the risk of local control of disease due to potential under dose of the target because of the physical uncertainties of the dose distribution achieved in irradiating large air cavities [15,16]. The limitation of this study was to use one beam irradiations. However, in a realistic therapy, a combination of multiple numbers of sub-fields within fields from multiple beam directions is used. Thus, the magnitude of interface dose reductions will likely be smaller than those for the limited number of radiation fields used in this study.
5. Conclusion
In conclusion, comparison of the depth dose and dose profiles between the measurements and MC calculations near air gap demonstrates excellent agreement concerning different air gaps and field sizes. We recommend that MC algorithm should be employed for accurate dose calculations in the presence of air cavity.
Conflict of Interest
None.
REFERENCES
- Task Group No. 65, the Radiation Therapy Committee of the American Association of Physicists in Medicine, “Tissue Inhomogeneity Corrections for Megavoltage Photon Beams. Madison,” Medical Physics Publishing, Madison, 2004.
- C. Hurkmans, T. Knöös, P. Nilsson, G. Svahn-Tapper and H. Danielsson, “Limitations of a Pencil Beam Approach to Photon Dose Calculations in the Head and Neck Region,” Radiotherapy & Oncology, Vol. 37, No. 1, 1995, pp. 74-80. http://dx.doi.org/10.1016/0167-8140(95)01609-K
- E. K. Osei, J. Darko, A. Mosseri and J. Jezioranski, “EGSNRC Monte Carlo Study of the Effect of Photon Energy and Field Margin in Phantoms Simulating Small Lung Lesions,” Medical Physics, Vol. 30, No. 10, 2003, pp. 2706-2714. http://dx.doi.org/10.1118/1.1607551
- E. E. Klein, L. M. Chin, R. K. Rice and B. J. Mijnheer, “The Influence of Air Cavities on Interface Doses for Photon Beams,” International Journal of Radiation Oncology*Biology*Physics, Vol. 27, No. 2, 1993, pp. 419-427.
- W. K. Kan, P. M. Wu, H. T. Leung, T. C. Lo, C. W. Chung, D. L. Kwong, et al., “The Effect of the Nasopharyngeal Air Cavity on X-Ray Interface Doses,” Physics in Medicine & Biology, Vol. 43, No. 3, 1998, pp. 529- 537. http://dx.doi.org/10.1088/0031-9155/43/3/005
- B. H. Shahine , M. S. A. L. Al-Ghazi and E. El-Khatib, “Experimental Evaluation of Interface Doses in the Presence of Air Cavities Compared with Treatment Planning Algorithms,” Medical Physics, Vol. 26, No. 3, 1999, pp. 350-355. http://dx.doi.org/10.1118/1.598526
- I. Kawrakow, “Accurate Condensed History Monte Carlo Simulation of Electron Transport. I. EGSnrc, the New EGS4 Version,” Medical Physics, Vol. 27, No. 3, 2000, pp. 485-498. http://dx.doi.org/10.1118/1.598917
- M. Fragoso, N. Wen, S. Kumar, D. Liu, S. Ryu, B. Movsas, et al., “Dosimetric Verification and Clinical Evaluation of a New Commercially Available Monte Carlo-Based Dose Algorithm for Application in Stereotactic Body Radiation Therapy (SBRT) Treatment Planning,” Physics in Medicine & Biology, Vol. 55, No. 16, 2010, pp. 4445-4464. http://dx.doi.org/10.1088/0031-9155/55/16/S02
- M. Fippel, F. Haryanto, O. Dohm, F. Nüsslin and S. Kriesen, “A Virtual Photon Energy Fluence Model for Monte Carlo Dose Calculation,” Medical Physics, Vol. 30, No. 3, 2003, pp. 301-311. http://dx.doi.org/10.1118/1.1543152
- X. A. Li, C. Yu and T. Holmes, “A Systematic Evaluation of Air Cavity Dose Perturbation in Megavoltage X-Ray Beams,” Medical Physics, Vol. 27, No. 5, 2000, pp. 1011- 1017. http://dx.doi.org/10.1118/1.598966
- A. L. Petoukhova, K. van Wingerden, R. G. Wiggenraad, P. J. van de Vaart, J. van Egmond, E. M. Franken, et al., “Verification Measurements and Clinical Evaluation of the iPlan RT Monte Carlo Dose Algorithm for 6 MV Photon Energy,” Physics in Medicine & Biology, Vol. 55, No. 16, 2010, pp. 4601-4614. http://dx.doi.org/10.1088/0031-9155/55/16/S13
- C. F. Behrens, “Dose Build-Up behind Air Cavities for Co-60, 4, 6 and 8 MV. Measurements and Monte Carlo Simulations,” Physics in Medicine & Biology, Vol. 51, No. 22, 2006, pp. 5937-5950. http://dx.doi.org/10.1088/0031-9155/51/22/015
- L. Wang, E. Yorke and C. S. Chui, “Monte Carlo Evaluation of Tissue Inhomogeneity Effects in the Treatment of the Head and Neck,” International Journal of Radiation Oncology*Biology*Physics, Vol. 50, No. 5, 2001, pp. 1339-1349.
- M. Yoon, D. H. Lee, D. Shin, S. B. Lee, S. Y. Park and K. H. Cho, “Accuracy of Inhomogeneity Correction Algorithm in Intensity-Modulated Radiotherapy of Head-andNeck Tumors,” Medical Dosimetry, Vol. 32, No. 1, 2007, pp. 44-51. http://dx.doi.org/10.1016/j.meddos.2006.11.004
- J. N. Waldron, B. O’Sullivan, P. Warde, P. Gullane, F. F. Lui, D. Payne, et al., “Ethmoid Sinus Cancer: TwentyNine Cases Managed with Primary Radiation Therapy,” International Journal of Radiation Oncology*Biology* Physics, Vol. 41, No. 2, 1998, pp. 361-369.
- J. N. Waldron, B. O’Sullivan, P. Gullane, I. J. Witterick, F. F. Liu, D. Payne, et al., “Carcinoma of the Maxillary Antrum: A Retrospective Analysis of 110 Cases,” Radiotherapy & Oncology, Vol. 57, No. 2, 2000, pp. 167-173. http://dx.doi.org/10.1016/S0167-8140(00)00256-5
NOTES
*Corresponding author.