American Journal of Plant Sciences
Vol.4 No.5A(2013), Article ID:32242,8 pages DOI:10.4236/ajps.2013.45A002
Corn and Soybean Rotation under Reduced Tillage Management: Impacts on Soil Properties, Yield, and Net Return*
![]()
1Crop Production Systems Research Unit, USDA-ARS, Stoneville, USA; 2Delta Research and Extension Center, Mississippi State University, Stoneville, USA.
Email: krishna.reddy@ars.usda.gov
Copyright © 2013 Krishna N. Reddy et al. This is an open access article distributed under the Creative Commons Attribution License, which permits unrestricted use, distribution, and reproduction in any medium, provided the original work is properly cited.
Received February 25th, 2013; revised April 15th, 2013; accepted May 1st, 2013
Keywords: Crop Rotation; Monoculture; Reduced Tillage; Soil Microbial Community; Soil Quality
ABSTRACT
A 4-yr field study was conducted from 2007 to 2010 at Stoneville, MS to examine the effects of rotating corn and soybean under reduced tillage conditions on soil properties, yields, and net return. The six rotation systems were continuous corn (CCCC), continuous soybean (SSSS), corn-soybean (CSCS), soybean-corn (SCSC), soybean-soybean-cornsoybean (SSCS), and soybean-soybean-soybean-corn (SSSC). Field preparation consisted of disking, subsoiling, disking, and bedding in the fall of 2005. After the fall of 2006, the raised beds were refurbished each fall after harvest with no additional tillage operations to maintain as reduced tillage system. The surface 5 cm soil from continuous soybean had higher pH than continuous corn in all four years. Unlike pH, total carbon and total nitrogen were higher in continuous corn compared to continuous soybean. Delta 15N tended to be higher in continuous corn compared to continuous soybean. Fatty acid methyl ester (FAME) indicated minor changes in soil microbial community in relation to cropping sequence, however there was a significant shift in rhizosphere community depending on crop. Corn yield increased every year following rotation with soybean by 16%, 31%, and 15% in 2008, 2009, and 2010, respectively, compared to continuous corn. As a result, net returns were higher in rotated corn compared with continuous corn. This study demonstrated that alternating between corn and soybean is a sustainable practice with increased net returns in corn.
1. Introduction
Historically, cotton was the predominant row crop grown in the Mississippi Delta with soybean and rice grown on the clay textured soils. Changes in government commodity support programs and an increased commodity price in recent years has encouraged producers to shift acreage to other crops, such as corn to remain profitable. In recent years, soybean and corn acreage has increased with a concomitant decreases in cotton acreage. In Mississippi, corn and soybean hectareage increased by 105% and 25%, respectively, and cotton hectareage decreased by 57% in 2012 compared to 2000 [1]. During the same period herbicide and insect resistant trait cultivars of these crops dominated the market and increased production costs through seed premiums. Other production costs such as fertilizer and irrigation also increased. Farmers are looking for ways to improve profitability by utilizing sustainable production systems such as crop rotation that increases crop yields without increasing production costs.
Conventional tillage production systems involve multiple tillage operations from the fall after harvest of the previous crop through the summer growing season of the next crop. Reduced tillage production systems exclude at least one major tillage operation or minimize the intensity of tillage operations [2]. Moreover, reduced tillage promotes accumulation of crop residues at the soil surface, thereby reducing soil and water runoff as well as nutrient and pesticide off-site transport.
Rotating crops has the potential to increase yields in several crops [3,4]. Rotating crops breaks the cycles that may be detrimental to long-term management of a particular crop [5]. When crops are rotated, the change in herbicides used and production practices employed may often improve control of problem weeds, soil properties, and crop yields [4,6,7-9]. Alternating the sequence of herbicide use in a rotation has the potential to increase yields. When herbicides are rotated, control of problem weeds is improved and selection pressure to evolve resistant weeds is reduced. In a corn-cotton rotation study in Mississippi [4], continuous corn (monoculture) production where atrazine was applied every year has resulted in enhanced atrazine degradation (reduced persistence) and potential for loss of residual weed control compared to cotton-corn rotation system where atrazine applied every other year [10]. Since corn produces more biomass than soybean, leaving plant residues on the soil surface under reduced tillage condition can reduce soil erosion and improve soil fertility. Fertilizer N has long been considered a major factor influencing corn yields. Whereas, soybean response to fertilizer N is minimal and most farmers do not use fertilizer N in the Mississippi delta region. Soybean can fix atmospheric N that can supply N to the successive crop such as corn. This 4-yr field study conducted from 2007 to 2010 on a Dundee silt loam examines corn and soybean production in a rotation under a reduced tillage system. The specific objectives of this study were to compare soil properties, N supply from N fixation, yields, and net return from continuous and rotated corn-soybean production systems.
2. Materials and Methods
2.1. Experimental Conditions
A 4-yr field study was conducted from 2007 through 2010 at the USDA-ARS Crop Production Systems Research Unit farm, Stoneville, MS. The soil was a Dundee silt loam (fine-silty, mixed, thermic Aeric Ochraqualf) with pH 6.7, 1.1% organic matter, a CEC of 15 cmol·kg−1, and soil textural fractions of 26% sand, 55% silt, and 19% clay. Field preparation consisted of disking, subsoiling, disking, and bedding in the fall of 2005. The land was not tilled in subsequent years, but the raised beds were refurbished each fall after harvest with no additional tillage operations to maintain a reduced tillage system. The raised seedbeds ensured adequate drainage in early spring, helping to prevent planting delays and enabling furrow irrigation during the growing season. Prior to planting, the tops of the seedbeds were smoothed as needed by removing a thin layer of soil from the top of the seedbed. The experimental area was planted to glyphosate-resistant corn in 2006.
The six rotation systems were continuous corn (CCCC), continuous soybean (SSSS), corn-soybean-corn-soybean (CSCS), soybean-corn-soybean-corn (SCSC), soybean-soybean-corn-soybean (SSCS), and soybean-soybean-soybean-corn (SSSC). The experimental area was treated with paraquat at 1.1 kg·ai·ha−1 2 to 5 d prior to planting corn to kill existing vegetation. Glyphosateresistant cultivars of corn and soybean were used in the study. Corn and soybean cultivars, planting dates, herbicides and application timing, and harvest dates used in the study are presented in Table 1. Both corn and soybean were planted in rows spaced 102-cm apart using MaxMerge 2 planter. Cultivars were selected based on regional use patterns of producers and seed availability. PRE herbicides were applied immediately after planting. First and second postemergence treatments were applied at 3 - 4 and 6 - 7 weeks after planting crop, respectively. In corn, second postemergence was applied as post-directed to base of the corn plant. All herbicide treatments except POST-directed were applied broadcast with a tractor-mounted sprayer with 8004 standard flat spray nozzles delivering 187 L·ha−1 water. Post-directed treatments were applied broadcast using a hooded sprayer equipped with off-centered nozzles (OC-01 flat spray tips) for post-direct spraying and sprayer hoods with three nozzles (95002 even flat spray tips) for spraying between the rows. Fertilizer application was standard for corn production [11] and both corn and soybean were irrigated on an as-needed basis each year. Corn and soybean from all eight rows of each plot were harvested with the use of a combine. Corn and soybean grain yield was adjusted to 15% and 13% moisture, respectively. Economic benefit (net return) from rotation for corn was determined by multiplying mean yield increase in rotation over yield of continuous corn by the market-year average price. The Mississippi Agricultural Statistics Service publishes the market-year average price of corn received by producers [12]. Because the designated rotation systems were first grown in 2007, the net return for that year was not calculated. Also net return for soybean was not calculated as there were no yield differences between continuous soybean and rotated soybean.
Soil samples from the top 5-cm depth were collected using a 7.5-cm core sampler prior to planting corn (late March) before applying fertilizer N each year. To assess overall effects of 4-yr rotation systems, soil samples were also collected in March 2011. Soil samples consisted of a composite of six sub samples collected randomly from the middle four rows of the plot. Bulk soil samples were passed through a 2-mm sieve. Bulk soil and rhizosphere samples were collected from continuous corn and soybean plots, mid-season in 2009 and 2010, as described elsewhere [13].
A subsample of the soils that were collected at planting and in mid-season in 2009 and 2010 were frozen at −80˚C following sieving for microbial community analysis using fatty acid methyl ester methodology (FAME).

Table 1. Agronomic practices used in glyphosate-resistant (GR) soybean and GR corn grown continuously and in rotations at Stoneville, MS, 2007-2010a,b.
Total fatty acids were extracted from 2 g subsamples of soil and methylated as described elsewhere [14,15]. FAMEs were identified and quantified with Agilent 6890 GC (Agilent Technologies, Inc., Wilmington, DE 19808) and MIDI EUKARYOTE protocol (MIDI FAME standards, Microbial ID) (MIDI, Inc., Newark, DE 19713). Fatty acids that were very rare (less than 20% of samples and 0.5% molar abundance) were excluded from analysis to reduce minor experimental variation [14,16,17]. In addition, these FAMEs were also grouped following by functional commonalities [15]: branched chain, Grampositive-associated FAMEs (iso and anti-iso); unsaturated, Gram-negative-associated FAMEs; fungal FAMEs (16:1 cis 5 and 18:2 cis 9; 18:2 cis 6); hydroxy FAMEs; cyclo FAMEs; low molecular weight saturated FAMEs; and high molecular weight saturated FAMEs (eukaryotic organisms). Following principal component analysis, the contributions of cover crop, tillage, and interactions between cover crop and tillage on principal components were analyzed using SAS PROC MIXED. Pearson correlations (SAS PROC CORR) were also conducted to assess the contributions of the functional commonalities with PC1, PC2 and carbon and nitrogen content in the soil and rhizosphere assessment.
Total carbon and total nitrogen was determined from duplicate samples (10 - 15 mg) using a Flash EA 112 elemental analyzer (CE Elantech, Lakewood, New Jersey). Soil pH was determined by private soil testing laboratory, Pettiet Ag Services Inc., Leland, Mississippi. Delta 15N was determined by the University of California, Berkeley Center for Stable Isotope Biogeochemistry using a Finnigan MAT Delta plus XL mass spectrophotometer interfaced with a CE Elantech 1500 elemental analyzer as a combustion system. Nitrogen isotopic discrimination mass spectroscopy was utilized to characterize the delta 15N abundance based on nitrogen isotope 15N/14N ratio [18].
2.2. Statistical Analysis
The experiment was conducted in a randomized complete block design with four replications. Each treatment consisted of eight rows spaced 102-cm apart and 35.7-m long. The data were subjected to analysis of variance using PROC GLM (SAS software, release 8.2, Windows version 5.1.2600, SAS Institute Inc., 100 SAS Campus Drive, Cary, NC) and treatment means were separated at the 5% level of significance using Fisher’s protected LSD test.
3. Results and Discussion
3.1. Soil Properties
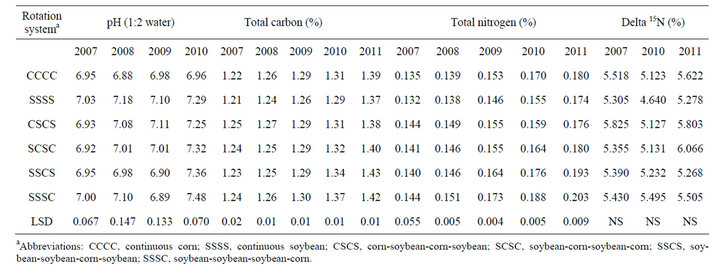
The surface 5-cm soil from continuous soybean had higher pH than continuous corn in all four years (Table 2). The soil pH ranged from 6.88 to 6.98 in continuous corn and 7.03 to 7.29 in continuous soybean. In 2010, corn and soybean following each other (CSCS or SCSC) had pH similar to continuous soybean. Unlike pH, total carbon was tended to be higher in continuous corn compared to continuous soybean mainly due to higher levels

Table 2. Effect of glyphosate-resistant corn and GR soybean grown continuously and in rotation on soil pH, total carbon and nitrogen, and dN15 abundance at planting in the 0 to 5-cm depth at Stoneville, MS in 2007-2010.
of plant residues remaining after corn harvest compared to soybean. When the study was initiated, there were no differences in total carbon between continuous corn and continuous soybean. By the fourth year (2011), total carbon began to increase in continuous corn (1.22% to 1.39%) and in continuous soybean (1.21% to 1.37%), most likely due to reduced tillage management. These results are similar to that observed in a 6-yr corn-cotton rotation, where corn tended to accumulate more organic carbon than cotton [4]. Similarly, total nitrogen was tended to be higher in continuous corn compared to continuous soybean (Table 2). After termination of study (2011), SSSC and SSCS systems had higher total nitrogen than other rotation systems. Delta 15N was tending to be higher in continuous corn compared to continuous soybean. Previous cropping systems on these plots were cotton and corn both receiving greater than 120 kg·N·ha−1 yearly. During the nitrogen fixation, the nitrogenase enzyme has a lower affinity for the stable 15N isotope, thus legumes have lower delta 15N content, compared to crops receiving fertilizer N [18]. This indicates a slight shift in the soil N isotopic composition in response to continuous soybean with no input of fertilizer N. Perhaps a greater impact of the soybean would have been observed if lower soil depths were sampled beside the surface 5 cm, especially under minimum soil disruption from bed formation as most soybean roots extend deeper in the soil profile.
3.2. Microbial Communities
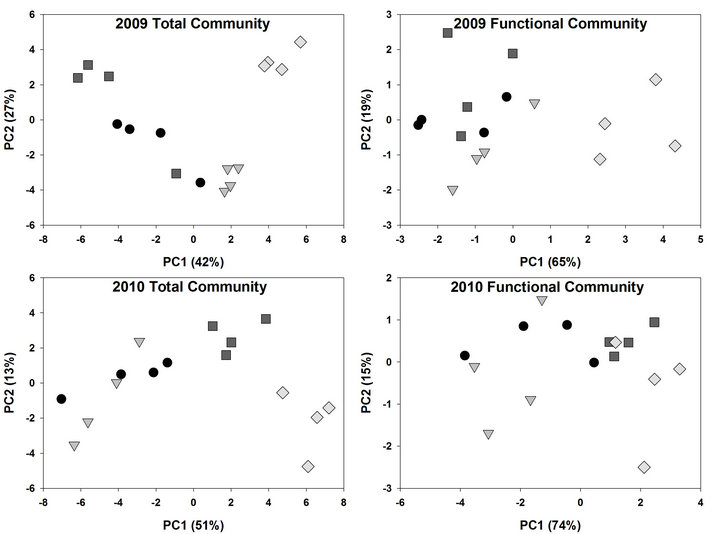
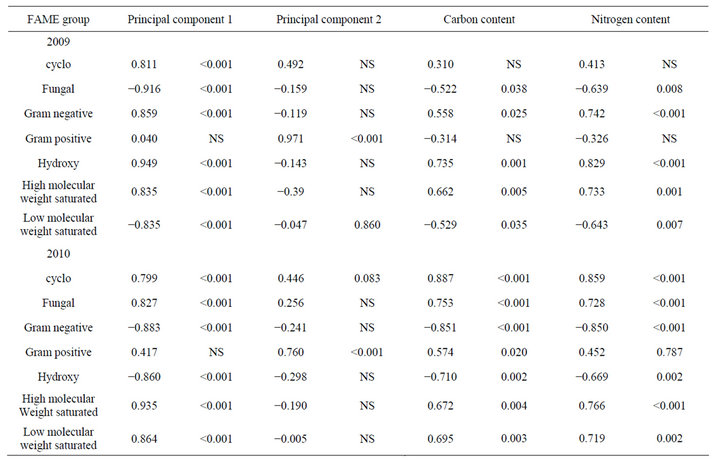
Analysis of soil microbial communities based on FAME indicated a slight but inconsistent alteration of the soil microflora in response to rotation system (data not shown). Based upon principal component analysis of total FAMEs extracted, the microflora from soils under continuous soybean were distinct compared to the other 5 rotation systems for PC1 in 2009 but not in 2010. The inconsistency is that the SSSC rotation had the identical history as continuous soybean at the 2009 sampling but was grouped with the other rotation soils. Similar PC groupings were observed using functional FAMEs (data not shown). When bulk soils and rhizospheres were evaluated (Table 3, Figure 1), a distinct rhizosphere alteration on the microbial community is observed. When the total FAMEs are analyzed, soybean rhizosphere communities are distinct from corn rhizosphere and both soils in PC1 in both years. In PC2, soybean soils and rhizosphere soil are distinct from corn soil and rhizosphere communities in 2009 but are different only to corn rhizospheres in 2010. When the soil community is analyzed based on functional grouping of FAMEs, a greater precision is obtained compared to the total FAME as Eigen values for PC1 and PC2 combined account for 84% of the variance in 2009 and 89% in 2010 compared to <69% using total FAMEs. The distinction of the soybean versus corn rhizosphere is only evident in 2009 PC1. All microbial groups except Gram positive bacteria contributed to PC1 in both years (Table 4), while only the Gram positive bacteria contributed to PC2 structure in both years. These shifts in the microbial community correlate with variance of carbon and nitrogen content in the rhizospheres and bulk soil. On a nearby field, FAME analysis was used to assess microbial community structure under a corn, cotton monoculture or three corn cotton rotations [17]. Following six years of these cropping systems, the microbial communities under continuous corn were significantly different than continuous cotton or the three corn cotton rotations with Gram positive branched fatty acids and the fungal biomarker 18:2cis6 and saturated high molecular weight eukaryotic biomarkers dominant contributors

Figure 1. Principal component analysis (PCA) of microbial community based on Fatty Acid Methyl Ester (FAMEs) extracted from corn and soybean bulk soil and rhizosphere soil in 2009 and 2010. PCA was conducted on total FAMEs and FAME functional commonalities. Circles represent corn bulk soil, triangles corn rhizosphere soil, squares soybean bulk soil and diamonds soybean rhizosphere soil.


Table 3. Analysis of variance of ordinates derived from principal component analysis (PCA) of fatty acid methyl esters (FAME) (data presented in Figure 1), extracted from bulk soils and rhizosphere soils based upon total FAME and functional groupings of FAMEs. Soil samples were collected mid season in 2009 and 2010.
to community structure. Other researchers using FAME techniques [19] also only observed a minor impact of corn or soybean cropping systems on microbial community, as tillage had a greater effect. However, using a more robust technology of PCR-DGGE assessment of soil DNA [20] indicated alterations in Trichoderma and Arthrobacter biomarkers in rhizosphere soil under a corn soybean rotation compared to three years of continuous soybean.
3.3. Corn and Soybean Yield and Net Return
There were no differences in corn yield in the first year of study (2007). Corn yields were higher in corn following 1, 2, or 3 years of soybean (2008-2010) compared to corn grown continuously (Table 5). In general, corn yields increased by 16%, 31%, and 15% in 2008, 2009,

Table 4. Correlations of functional groupings of FAME in corn and soybean soils and rhizospheres with Principal components 1 and 2, and carbon and nitrogen content.

Table 5. Glyphosate-resistant corn grain yield as affected by rotation with soybean and increased net return realized in rotated corn over monoculture system at Stoneville, MS, 2007-2010a,b.
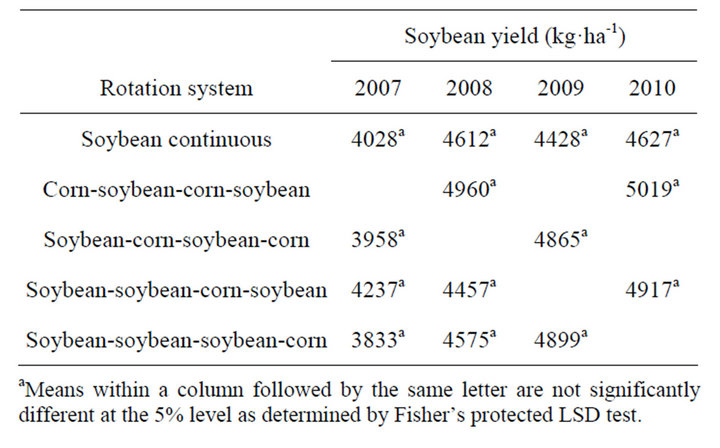
and 2010, respectively, in corn following soybean compared to continuous corn. In soybean, yields were similar regardless of rotation system (Table 6). Unlike corn, soybean following corn did not result in higher yield. Contrary to these results, in a 6-yr corn-cotton rotation both corn and cotton yields increased every year following rotation with each other compared to their monoculture [4]. In this study, soybean did not benefit from any residual fertilizer N left from previous corn, because in general, soybean response to fertilizer N is minimal and most farmers do not use fertilizer N in the Mississippi Delta region. Studies in Northern China indicated a loss in yield of continuous soybean, however this was related by disease potential and soybean cyst nematode [20]. Whether corn or soybean is grown in monoculture or in rotation, the production costs remain identical within a year. With this assumption, the net return from a rotation system was calculated for each year by multiplying av-

Table 6. Glyphosate-resistant soybean yield as affected by rotation with corn at Stoneville, MS, 2007-2010a.
erage yield increase due to rotation by market year average price (Table 5). In rotated corn, the net return increased every year by 233 to 384 $·ha−1 compared to continuous corn and there was no economic benefit realized in soybean rotation.
4. Conclusion
Continuous corn resulted in lower pH and slightly increased total carbon and total nitrogen compared to continuous soybean. A corn-soybean rotational system could increase yield and net return in corn over a monocropping system without increasing production costs. The present study demonstrated that a corn-soybean rotation although is more beneficial to corn than soybean, is a sustainable option for farmers with economic benefit.
5. Acknowledgements
We thank Efren Ford, Earl Gordon, Terry Newton, and Albert Tidwell for technical assistance.
REFERENCES
- USDA, United States Department of Agriculture, National Agricultural Statistics Service. 2012. http://usda.mannlib.cornell.edu/MannUsda/viewDocumentInfo.do?documentID=1000
- M. A. Locke and C. T. Bryson, “Herbicide-Soil Interactions in Reduced Tillage and Plant Residue Management Systems,” Weed Science, Vol. 45, No. 2, 1997, pp. 307- 320.
- R. A. Wesley, L. G. Heatherly, C. D. Elmore and S. R. Spurlock, “Effects of Crop Rotation and Irrigation on Soybean and Wheat Double Cropping on Clay Soil, an Economic Analysis,” US department of Agriculture, Agricultural Research Service, ARS-119, 1994, p. 14.
- K. N. Reddy, M. A. Locke, C. H. Koger, R. M. Zablotowicz and L. J. Krutz, “Cotton and Corn Rotation under Reduced Tillage Management: Impacts on Soil Properties, Weed Control, Yield, and Net Return,” Weed Science, Vol. 54, No. 4, 2006, pp 768-774. doi:10.1614/WS-06-031R.1
- M. A. Locke, K. N. Reddy and R. M. Zablotowicz, “Weed Management in Conservation Production Systems,” Weed Biology Management, Vol. 2, No. 3, 2002, pp 123-132. doi:10.1046/j.1445-6664.2002.00061.x
- C. T. Bryson, K. N. Reddy and W. T. Molin, “Purple Nutsedge (Cyperus rotundus) Population Dynamics in Narrow Row Transgenic Cotton (Gossypium hirsutum) and Soybean (Glycine max) Rotation,” Weed Technology, Vol. 17, 2003, pp. 807-810. doi:10.1614/WT02-177
- W. C. Johnson III and B. G. Mullinix Jr., “Population Dynamics of Yellow Nutsedge (Cyperus esculentus) in Cropping Systems in the Southeastern Coastal Plain,” Weed Science, Vol. 45, No. 1, 1997, pp. 166-171.
- K. N. Reddy, “Weed Control and Species Shifts in Bromoxyniland Glyphosate-Resistant Cotton (Gossypium hirsutum) Rotation Systems,” Weed Technology, Vol. 18, 2004, pp. 131-139. doi:10.1614/WT-03-059R
- R. A. Wesley, C. D. Elmore and S. R. Spurlock, “Deep Tillage and Crop Rotation Effects on Cotton, Soybean, and Grain Sorghum on Clayey Soils,” Agronomy Journal, Vol. 93, No. 1, 2001, pp. 170-178. doi:10.2134/agronj2001.931170x
- L. J. Krutz, R. M. Zablotowicz, K. N. Reddy, C. H. Koger III and M. A. Weaver, “Enhanced Degradation of Atrazine under Field Conditions Correlates with a Loss of Weed Control in the Glasshouse,” Pest Management Science, Vol. 63, 2007, pp. 23-31. doi:10.1002/ps.1304
- K. N. Reddy and C. T. Bryson, “In-Crop and AutumnApplied Glyphosate Reduced Purple Nutsedge (Cyperus rotundus) Density in No-Till Glyphosate-Resistant Corn and Soybean,” Weed Technology, Vol. 23, No. 3, 2009, pp. 384-390. doi:10.1614/WT-09-016.1
- USDA, United States Department of Agriculture, National Agricultural Statistics Service, 2012. http://quickstats.nass.usda.gov/
- L. J. Krutz, R. M. Zablotowicz and K. N. Reddy, “Selection Pressure, Cropping System, and Rhizosphere Proximity Affect Atrazine Degrader Populations and Activity in S-Triazine-Adapted Soil,” Weed Science, Vol. 60, No. 3, 2012, pp. 516-524. doi:10.1614/WS-D-11-00104.1
- R. M. Zablotowicz, K. N. Reddy, M. A. Weaver, A. Mengistu, L. J. Krutz, R. E. Gordon and N. Bellaloui, “Cover Crops, Tillage, and Glyphosate Effects on Chemical and Biological Properties of a Lower Mississippi Delta Soil and Soybean Yield,” Environmental Research Journal, Vol. 4, 2010, pp. 227-251.
- M. A. Weaver, R. M. Zablotowicz, L. J. Krutz, C. T. Bryson and M. A. Locke, “Microbial and Vegetative Changes Associated with Development of a Constructed Wetland,” Ecological Indicators, Vol. 13, No. 1, 2012, pp. 37-45. doi:10.1016/j.ecolind.2011.05.005
- M. A. Cavigelli, L. L. Lengnick, J. S. Buyer, D. Fravel, Z. Handoo, G. McCarty, P. Millner, L. Sikora, S. Wright, B. Vinyard and M. Rabenhorst, “Landscape Level Variation in Soil Resources and Microbial Properties in a No-Till Corn Field,” Applied Soil Ecology, Vol. 29, No. 2, 2005, pp. 99-123. doi:10.1016/j.apsoil.2004.12.007
- R. M. Zablotowicz, L. J. Krutz, K. N. Reddy, M. A. Weaver, C. H. Koger and M. A. Locke, “Rapid Development of Enhanced Atrazine Degradation in a Dundee Silt Loam Soil under Continuous Corn and in Rotation with Cotton,” Journal Agricultural and Food Chemistry, Vol. 55, No. 3, 2007, pp. 852-859. doi:10.1021/jf0620923
- G. Shearer and D. H. Kohl, “N2-Fixation in Field Settings: Estimations Based on Natural 15N Abundance,” Australian Journal of Plant Physiology, Vol. 13, 1986, pp. 699- 756.
- J. M. Meriles, S. V. Gil, C. Conforto, G. Figoni, E. Lovera, G. J. March and C. A. Guzman, “Soil Microbial Community under Different Soybean Cropping Systems: Characterization of Microbial Population Dynamics, Soil Microbial Activity, Microbial Biomass, and Fatty Acid Profiles,” Soil and Tillage Research, Vol. 103, No. 2, 2009, pp 271-281. doi:10.1016/j.still.2008.10.008
- C. Li, X. Li, W. Kong, Y. Wu and J. Wang, “Effect of Monoculture Soybean on Soil Microbial Community in the Northern China,” Plant Soil, Vol. 330, No. 1-2, 2010, pp. 423-433. doi:10.1007/s11104-009-0216-6
NOTES
*Mention of trade names or commercial products in this publication is solely for the purpose of providing specific information and does not imply recommendation or endorsement by the US Department of Agriculture.

