Pharmacology & Pharmacy
Vol.4 No.2(2013), Article ID:29701,7 pages DOI:10.4236/pp.2013.42020
Population Pharmacokinetics of Methotrexate in Egyptian Children with Lymphoblastic Leukemia
![]()
1Pharmacology Department, Faculty of Medicine, Assiut University, Assiut, Egypt; 2Pediatric Department, Assiut University Hospital, Assiut University, Assiut, Egypt; 3Department of Pharmaceutics, College of Pharmacy, University of Florida, Gainesville, USA; 4Upper Egypt Oncology Unit Assiut University, Assiut, Egypt.
Email: ehegypt@yahoo.com
Copyright © 2013 Ehab Said EL Desoky et al. This is an open access article distributed under the Creative Commons Attribution License, which permits unrestricted use, distribution, and reproduction in any medium, provided the original work is properly cited.
Received January 19th, 2013; revised February 20th, 2013; accepted March 25th, 2013
Keywords: Methotrexate; Population Pharmacokinetics; Leukemia
ABSTRACT
Background: Individualization of high dose regimen of methotrexate (MTX) in pediatric patients with acute lymphoblastic leukemia based on pharmacokinetic (PK) parameters can help in optimization of the dose and better control of the disease. Building up of a pharmacokinetic model can help dose optimization. Objectives: A NONMEM based population (POP) PK model has been subsequently developed to evaluate the effect of demographics as covariates to address variability in pharmacokinetics of MTX. Method: Forty one patients (24 males & 17 females) with ranges of age, body weight and height of 3 - 15 years, 13 - 54 kg and 100 - 177 cm respectively and diagnosed as acute lymphoblastic leukemia (ALL) were involved in the study. MTX was administered as i.v. infusion at a dose of 2 gm/m2 over a period of two hour and its plasma concentrations were determined primarily at 24 hr post-dose to be utilized in the building-up of PK model.The initial/prior estimates of volumes of central (V1) and peripheral compartments (V2) and clearance (CL) and inter-compartmental clearance (Q2) for MTX were extracted from literature. The inter-subject variability was estimated for V1 & CL. The influence of different covariates on model performance and parameter estimates was assessed by evaluating the difference in objective function value. The final POP PK model was validated by bootstrap re-sampling procedures (1000 runs) and the 95% confidence intervals for the estimates were calculated. Results: The POP estimates for CL, V1 and V2 were 2.18 L/h, 5.74 L and 11.2 L respectively. The inter-individual variability for the CL and V1 was 23% and 30% respectively. The covariates analysis showed effect of body surface area and sex on the CL and weight on V1. Conclusions: The POP-PK model developed adequately defines the population PK of MTX in pediatric patients with lymphoblastic leukemia. The model showed effect of body surface area and sex on clearance and weight on volume of distribution of the MTX. Further studies are required on larger number of patients with enrichment of samples for MTX concentrations. The developed PK model should be also investigated in correlation with the genotyping style of different MTX transporters that may affect MTX PK parameters.
1. Introduction
Acute lymphoblastic leukemia (ALL) is one of the frequent hematological cancers in children [1]. High dose methotrexate (HDMTX) is a substantial part of the effective treatment of that disease [2]. It achieves high plasma concentrations of the drug that can increase logically the incidence of MTX toxicity especially if drug elimination will be delayed [3]. On the other hand, higher systemic clearance of MTX/low systemic exposure may lead to a greater risk of relapse of the disease though debatable [4-6].
In Upper Egypt Oncology Institute, Assiut University Hospital, Egypt, MTX is used at relatively high dose in pediatric patients with ALL and therapeutic drug monitoring is applied usually 24 h after the dose of the drug.
In the present study, we develop for the first time a population pharmacokinetic (POP-PK) model of MTX to define the different pharmacokinetic (PK) parameters in the Egyptian pediatric patients with ALL and to evaluate the effect of demographics and co-administered drugs as covariates to address variability in its pharmacokinetics.
2. Material and Methods
2.1. Patients and Drugs
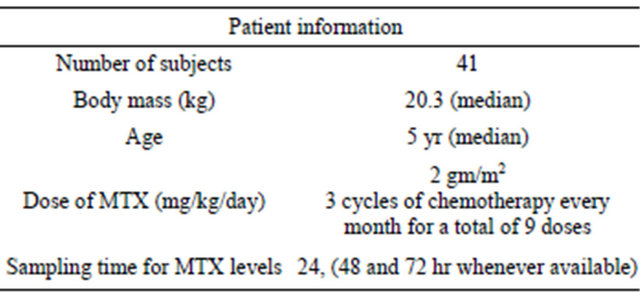
In the period 2008-2010, 41 patients (24 males & 17 females) less than 18 years and diagnosed as acute lymphoblastic leukemia were enrolled in the study. The mean age (years), body weight (kg) and height (cm) ± SD of the patients were 6.5 ± 3.4, 17.6 ± 9.9 and 117.2 ± 19.4 respectively. The ranges of age, body weight and height were 3 - 15 years, 13 - 54 kg and 100 - 177 cm respectively. They all have received high dose methotrexate (MTX) according to the treatment protocols followed in the oncology unit. Patients were diagnosed as acute lymphoblastic leukemia (ALL) if at least 25% lymphoblasts were present in the bone marrow (BM) in addition to examination of both BM and peripheral blood smears as well as cerebrospinal fluid (if required) for malignant cells. Treatment applied to the patients followed the protocols applied in St. Jude Research Hospital for treatment of ALL (i.e. BFM 90, high risk I or II, or total XIII) [7].
Methotrexate (MTX) was administered as intravenous infusion at a dose of 2 gm/m2 over a period of two hour (according to the regimen followed in the hospital) to achieve concentrations in the range of <5 μM at 24 h, and <0.5 μM at 48 h. The treatment protocol consists of 3 cycles of chemotherapy that are given every month for a total of 9 doses. The different treatment regimens used during study involved co-administration of drugs e.g. vincristine, ifosfamide, daunorubicin, L-asparaginase and leucovorin. MTX plasma concentrations determined primarily at 24 hr post-dose were utilized in the building-up of the PK-model. Additionally, any concentrations when available at 48 and 72 hr post dose for any patient were utilized in the pharmacokinetic analysis.
All patients had normal liver & kidney function. The demographics of the study population are listed in Table 1.
2.2. Pharmacokinetic (PK) Modeling and Data Analysis
Data were analyzed using the nonlinear mixed-effect modeling approach [8] using NONMEM (version 7.12) where two-compartment model for intravenous infusion and linear elimination (ADVAN3, TRANS4) has been used to fit MTX concentration data. The first-order conditional estimation method with interaction (FOCEI) implemented in NONMEM was applied for the PK estimation. The mean population clearance (CL), volume of distribution in central (V1) and peripheral compartment (V2), Inter-subject variability in CL and V1, as well as residual error in plasma MTX concentrations were estimated.
Table 1. Demographics of the study population.
The initial/prior estimates of clearance (CL), volumes of distribution of both central (V1) and peripheral compartments (V2) and inter-compartmental clearance (Q2) were extracted from previous studies on the MTX [7-11]. The number of observations utilized in PK analysis for each subject was limited by MTX concentration primarily at 24 h (and also at 48 and 72 hr post infusion whenever available/patient). The inter-compartment clearance between central and shallow peripheral compartment (Q2) was fixed to literature value.
Different covariates including age, body weight, height, body surface area (BSA), body mass index (BMI), gender and creatinine clearance were assessed if influencing the model performance and parameter estimates. Investigation of covariate-parameter relationships was based on the range of covariate values in the dataset, scientific interest, mechanistic plausibility, exploratory graphics, and previously reported covariate-parameter relationships for MTX. Assessment of each covariate was based on evaluating the difference in objective function value (OFV). The covariates were added to final base model by a standard approach to model selection (forward addition/backward elimination). Body surface area, gender and weight were found to be covariates influencing the final model. The equations applied to check the influence of different covariates on the model as well as estimation of the prediction error model were all derived from the NONMEM library [8].
For continuous covariates, a power function was utilized (Equation (1)):
 (1)
(1)
where TVPi is the typical value of a PK parameter (P) for an individual i with a COVi value of the covariate, while θ1 is the typical value for an individual with a median covariate value of COVmed and θ2 is the exponent of the power function.
For categorical covariates, the fractional change in the typical parameter value was determined, according to Equation (2):
 (2)
(2)
where, TVPi is the typical value of a PK parameter (P) for an individual i, θ1 is the typical value for an individual in the absence of the covariate and θ2 is the fractional change in the typical value.
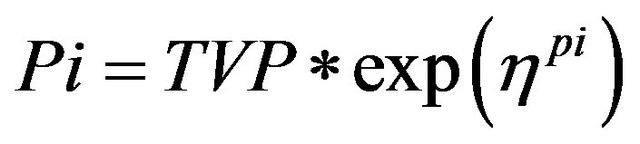
All inter-individual error terms in this analysis were described by an exponential error model, or log-normal parameter distribution (Equation (3)).
 (3)
(3)
where:
Pi is the estimated parameter value for individual I;
TVP is the typical population value (geometric mean) of the parameter;
ηpi are individual-specific inter-individual random effects for individual i and parameter P and are assumed to be distributed: η ~ N (0, ω2) with covariance defined by the inter-individual covariance matrix Ω.
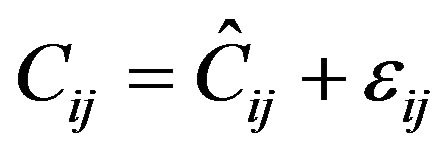
For PK observations in this analysis, the residual error model was described by a proportional error model (Equation (4)).
 (4)
(4)
where:
Cij is the jth measured observation in individual i;
Ĉij is the jth model predicted value in individual i;
εij is the proportional residual error for individual i and measurement j.
A bootstrap resampling technique (n = 1000) was applied as internal validation to the final POP PK model and the 95% confidence intervals for the estimates were calculated.
The bootstrap replicates (1000 runs) were generated by sampling randomly from the original data set using the individual as the sampling unit. Population parameters of the final PK model for each data set were estimated using NONMEM. This resulted in a distribution of estimates for each population model parameter. Empirical 95% CIs was constructed by obtaining the 2.5th and 97.5th quantiles of the resulting parameter distributions. Estimates from all NONMEM runs (with successful and unsuccessful minimization) were reported.
A visual predictive check was performed by simulating 1000 datasets using the final model and covariates, dosing times, and PK sampling times contained in the dataset to evaluate the predictability of the model. The statistics (e.g., median and the 90th percentile interval) of the observations and model-simulated predictions that were calculated from the entire data set (all participants) at each time point were compared.
3. Results
The median concentration of MTX measured at 24 hr post-dose was 0.43 μM (range: 0.12 - 14). MTX concentration-time pharmacokinetic data were best described by a linear two-compartment population PK model with first-order elimination from the central compartment. Due to the limited data in POP PK model, the inter-compartment clearance between central and peripheral compartment values was fixed. Also the inter-individual variability was estimated only for the clearance and volume of central compartment. The model estimated parameters are listed in Table 2.
The population estimate for clearance was found to be 2.70 L/h/m2 (2.18 L/h) with an inter-individual variability of 22.9% and a residual variability of 37.4%. Volume of distribution (central compartment) was found to be 5.74 L with an inter-individual variability of 30.3% in Egyptian children.
The diagnostic plots showing population pharmacokinetic model are shown in Figures 1-3.
Figure 1 shows better alignment of data points on the identity line in case of plotting the observed MTX concentrations versus individual predicted (IPRED) than population predicted (PRED) concentrations. This finding indicates good predictive performance of the final model.
Figures 2 defines the scatter distribution around zero
Table 2. The population pharmacokinetic estimates and bootstrap results.
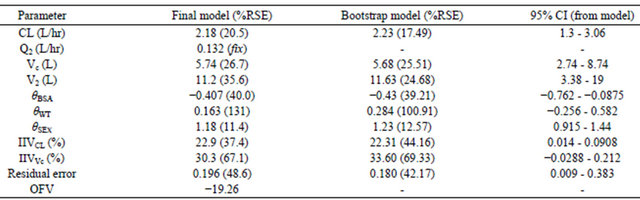
CL = estimated population clearance; Q2 = Intercompartmental clearance (fixed estimate); Vc = population volume of distribution (central compartment); V2 = population volume of distribution (peripheral compartment); IIVCL = between subject variability in population clearance; IIVVc = between subject variability in population central compartment volume; θ = slopes of covariates effects, ResidualSE% is residual standard error (Grabner et al.).
of the weighted residuals (WRES) for the final model. The distribution of WRES is plotted against the independent variable (Time) and population prediction (PRED) and a trend in the data around the zero line was observed in the two plots. The model is considered good if the residuals are distributed uniformly along the zero line and within ±4 on y axis. For very good model most of the data point should be within ±2 (within 2 standard deviation).
Figure 3 shows the relationship between the pharma-
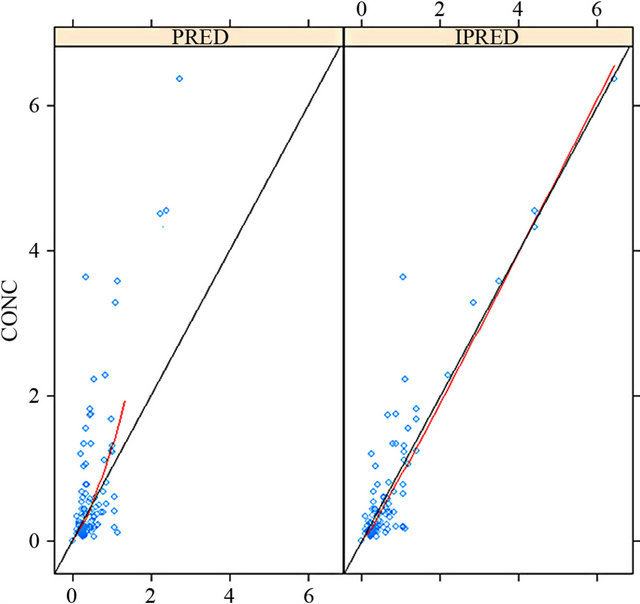
Figure 1. Plotting the observed MTX concentrations versus individual predicted (IPRED) than population predicted (PRED) concentrations.
cokinetic parameters and all the covariate in the dataset. The selection of the covariate was based on this plot. The covariates analysis showed effect of body surface area and sex on the clearance and weight on volume of distribution reflecting that these demographic factors are important in assessing the pharmacokinetics of MTX in Egyptian children with lymphoblastic leukemia.
The POP PK model was validated by the bootstrap re-sampling technique with 1000 runs. More than 95% runs were successful and the individual estimates obtained from model were within 95% CI of the bootstrap runs (Table 2).
According to the above pharmacokinetic analysis, the final model elaborated to include body surface area and sex for the clearance (CL) and weight for the volume of distribution (V1) is as follows:
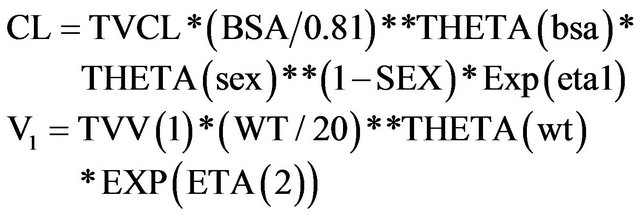
where, TVCL and TVV1 represent the typical value of clearance and volume of distribution of central compartment. Eta represents the inter-individual variability on clearance and volume
4. Discussion
The current pharmacokinetic study allowed us to recognize the average clearance and volume of distribution of MTX in Egyptian pediatric patients with acute lymphoblastic leukemia and treated primarily with MTX.
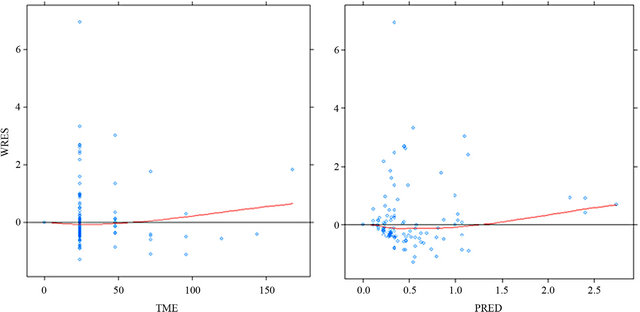
Figure 2. Weighted residuals vs time and population predictions for the final model.
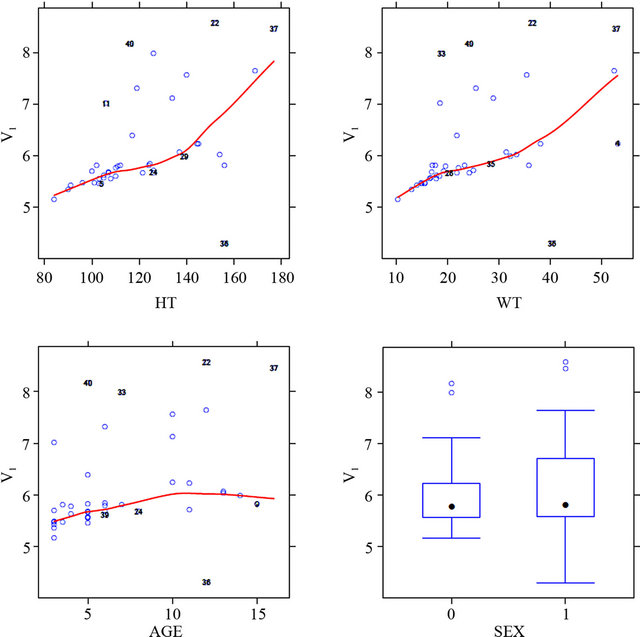

Figure 3. Shows the relationship between the pharmacokinetic parameters (central volume of distribution; V1, and clearance) and all the covariate in the dataset.
The developed PK model achieved a clearance value of 2.70 L/h/m2 (2.18 L/h) with inter-individual variability of 22.9%. In literature, similar studies in childhood leukemia who were treated with MTX at high dose, showed higher values of clearance e.g. 3.51 L/h [12], 6.28 ± 2.79 l∙h−1 [13], 4.7 [14], 7.4 L/h/m2 [15,16] for MTX in childhood lymphobastic leukemia, with interindividual variability in the average above 40% in these literature studies.
The volume of distribution (V1) in our results was 5.74 L with an inter-individual variability of 30.3% which both are lower than corresponding literature values in childhood period and given methotrexate e.g. 8.67 L [12], ≥12.7 L [17], 16.7 L [18] with average inter-individual variability >40% in these studies.
The lower value of MTX PK parameters (CL & V1) in Egyptian children studied though the normal renal function may be attributed to many factors. One of them is a possible mis-fitness of the elaborated model in kinetic analysis of the available data, especially a single concentration data of the drug (mainly at 24 h post-dose) was the principal data point available and utilized in the analysis. However, against this hypothesis is the good predictive performance of the model as defined in Table 2 for the residual error, bootstrap re-sampling analysis and confidence interval as well as the well fitting between the observed MTX concentrations and correlated individual predicted concentrations (as defined in Figure 1). But, still the concept that a limited number of patients associated with limited sampling data can create a noisy situation in population PK analysis should be considered when interpreting the results [19,20].
Genetic factors may also affect MTX disposition. Human multidrug resistance-related protein 2 (MRP2, encoded by ABCC2) is involved in the transport of anionic drugs such as MTX. Genetic variants (like rs717620) of ABCC2 can affect the population pharmacokinetic modeling MTX. ABCC2-24T allele (rs717620) had a combined influence on both MTX elimination and distribution. The MTX clearance and distribution volume were significantly higher in carriers of at least one copy of the -24T allele as compared with noncarriers [21]. Furthermore, SLCO1B1 is a transporter involved in MTX elimination and in a genome-wide association study of children with ALL, SLCO1B1 has been identified as harboring multiple common polymorphisms associated with methotrexate clearance [22]. In a group of children with ALL and administered MTX, deep resequencing of SLCO1B1 exons identified 93 single nucleotide polymorphisms (SNPs), 15 of which were non-synonymous (NS). Three of these NS SNPs were common, with a minor allele frequency >5%, one had low frequency (1% - 5%), and 11 were rare (<1%). NS SNPs (common or rare) predicted to be functionally damaging were more likely to be found among patients with the lowest methotrexate clearance than patients with high clearance [23].
The inter-individual variability in clearance of MTX is highly variable. In our study, the variability in MTX CL was 22.9% which is lower than the high variability values reported in literature for MTX clearance which average was >40% [18,23].
The volume of distribution (Vc) was 5.74 L with an inter-individual variability of 30.3% which both are lower than other studies where variability was >40% [18,23].
The limitation in the number of patients (n = 41) included in the study and sampling data may be important factors to explain the low inter-individual variability in MTX CL among Egyptian children (22.9%) compared with literature values in the same age group (>40%) [4,10,18,23]. (The lower inter-individual variability in clearance in our study (22.9%) compared with other As mentioned before, limitation in number of patients studied (n = 41) and one single point utilization in population pharmacokinetic analysis may create a noisy situation in PK analysis where they can give rise to qualitative but not quantitative information about PK parameters [20,21].
In conclusion: A pharmacokinetic model for Methotrexate high dose administration to Egyptian children with acute lymphoblastic leukemia has been elaborated. It can help in dose adjustment. However, the study needs further extension in two ways: 1) More patients to be included with enrichment of methotrexate concentration data for more validity of data analysis; 2) A design of genetic study to identify to what extent genotyping style of methotrexate transporters can affect drug pharmacokinetics.
REFERENCES
- A. M. Linabery and J. A. Ross, “Trends in Childhood Cancer Incidence in the US (1992-2004),” Cancer, Vol. 112, No. 2, 2008, pp. 416-432. doi:10.1002/cncr.23169
- N. Gökbuget and D. Hoelzer, “High-Dose Methotrexate in the Treatment of Adult Acute Lymphoblastic Leukemia,” Annals of Hematology, Vol. 72, No. 4, 1996, pp. 194-201. doi:10.1007/s002770050160
- C. Rask, F. Albertioni, S. M. Bentzen, H. Schroeder and C. Peterson, “Clinical and Pharmacokinetic Risk Factors for High-Dose Methotrexate-Induced Toxicity in Children with Acute Lymphoblastic Leukemia—A Logistic Regression Analysis,” Acta Oncologica, Vol. 37, No. 3, 1998, pp. 277-284. doi:10.1080/028418698429586
- H. Seidel, R. Nygaard, P. J. Moe, G. Jacobsen, B. Lindqvist and L. Slørdal, “On the Prognostic Value of Systemic Methotrexate Clearance in Childhood Acute Lymphocytic Leukemia,” Leukemia Research, Vol. 21, No. 5, 1997, pp. 429-434. doi:10.1016/S0145-2126(96)00127-0
- J. D. Borsi and P. J. Moe, “Systemic Clearance of Methotrexate in the Prognosis of Acute Lymphoblastic Leukemia in Children,” Cancer, Vol. 60, No. 12, 1987, pp. 3020-3024. doi:10.1002/1097-0142(19871215)60:12<3020::AID-CNCR2820601227>3.0.CO;2-0
- W. E. Evans, M. V. Relling, J. H. Rodman, W. R. Crom, J. M. Boyett and C-H. Pui, “Conventional Compared with Individualized Chemotherapy for Childhood Acute Lymphoblastic Leukemia,” The New England Journal of Medicine, Vol. 338, No. 8, 1998, pp. 499-505. doi:10.1056/NEJM199802193380803
- M. Schrappe, A. Reiter, W. D. Ludwig, J. Harbott, M. Zimmermann, W. Hiddemann, C. Niemeyer, G. Henze, A. Feldges, F. Zintl, B. Kornhuber, J. Ritter, K. Welte, H. Gadner and H. Riehm, “Improved Outcome in Childhood Acute Lymphoblastic Leukemia Despite Reduced Use of Anthracyclines and Cranial Radiotherapy: Results of Trial ALL-BFM 90. German-Austrian-Swiss ALL-BFM Study Group,” Blood, Vol. 95, No. 11, 2000, pp. 3310-3322.
- S. L. Beal and L. B. Sheiner, “NONMEM User Guides (I-VIII),” University of California at San Francisco, San Francisco, 1998.
- I. Grabner, B. Fraganel, V. Dolzan, A. Mrhar and J. Jazbec, “Population Pharmacokinetics of Methotrexate in Children with Lymphoid Malignancy,” The Annual Meeting of the Population Approach Group in Europe, 2007, p. 16. www.page-meeting.org/?abstract=1199
- C. Zhang, S. Zhai, L. Yang, H. Wu, J. Zhang and X. Ke, “Population Pharmacokinetic Study of Methotrexate in Children with Acute Lymphoblastic Leukemia,” International Journal of Clinical Pharmacology and Therapeutics, Vol. 48, No. 1, 2010, pp. 11-21.
- B. C. Widemann and P. C. Adamson, “Understanding and Managing Methotrexate Nephrotoxicity,” The Oncologist, Vol. 11, No. 6, 2006, pp. 694-703. doi:10.1634/theoncologist.11-6-694
- C. Ritzmo, F. Albertioni, K. Cosic, S. Soderhall and S. Eksborg, “Therapeutic Drug Monitoring of Methotrexate on the Pediatric Oncology Ward: Can Blood Sampling from Central Venous Accesses Substitute for Capillary Finger Punctures?” Therapeutic Drug Monitoring, Vol. 29, No. 4, 2007, pp. 447-451. doi:10.1097/FTD.0b013e318063e5e5
- F. Odoul, C. Le Guellec, J. P. Lamagnère, D. Breilh, M. C. Saux, G. Paintaud and E. Autret-Leca, “Prediction of Methotrexate Elimination after High Dose Infusion in Children with Acute Lymphoblastic Leukaemia Using a Population Pharmacokinetic Aapproach,” Fundamental and Clinical Pharmacology, Vol. 13, No. 5, 1999, pp. 595-604. doi:10.1111/j.1472-8206.1999.tb00366.x
- J. Chládková, J. Hak, J. Martínková and J. Chládek, “High-Dose Methotrexate in Children with Acute Lymphoblastic Leukemia: 7-Hydroxymethotrexate Systemic Exposure and Urinary Concentrations at the Steady State Correlate Well with Those of Methotrexate,” Arzneimittel-Forschung, Vol. 60, No. 12, 2010, pp. 769-775.
- T. D. Buitenkamp , R. A. Mathôt , V. de Haas, R. Pieters and C. M. Zwaan, “Methotrexate-Induced Side Effects Are Not Due to Differences in Pharmacokinetics in Children with Down Syndrome and Acute Lymphoblastic Leukemia,” Haematologica, Vol. 95, No. 7, 2010, pp. 1106-1113. doi:10.3324/haematol.2009.019778
- N. Martelli, O. Mathieu, G. Margueritte, M. C. Bozonnat, J. P. Daures, F. Bressolle, D. Hillaire-Buys and H. Peyrière, “Methotrexate Pharmacokinetics in Childhood Acute Lymphoblastic Leukaemia: A Prognostic Value?” Journal of Clinical Pharmacy and Therapeutics, Vol. 36, No. 2, 2011, pp. 237-245. doi:10.1111/j.1365-2710.2010.01179.x
- B. F. Kotnik, I. Grabnar, P. B. Grabar, V. Dolžan and J. Jazbec, “Association of Genetic Polymorphism in the Folate Metabolic Pathway with Methotrexate Pharmacokinetics and Toxicity in Childhood Acute Lymphoblastic Leukaemia and Malignant Lymphoma,” European Journal of Clinical Pharmacology, Vol. 67, No. 10, 2011, pp. 993-1006. doi:10.1007/s00228-011-1046-z
- P. Jönsson , T. Skärby, J. Heldrup, H. Schrøder and P. Höglund, “High Dose Methotrexate Treatment in Children with Acute Lymphoblastic Leukaemia May Be Optimised by a Weight-Based Dose Calculation,” Pediatric Blood & Cancer, Vol. 57, No. 1, 2011, pp. 41-46. doi:10.1002/pbc.22999
- H. Sun, E. O. Fadiran, C. D. Jones, L. Lesko, S. M. Huang, K. Higgins, C. Hu, S. Machado, S. Maldonado, R. Williams, M. Hossain and E. I. Ette, “Population Pharmacokinetics. A Regulatory Perspective,” Clinical Pharmacokinetics, Vol. 37, No. 1, 1999, pp. 41-58. doi:10.2165/00003088-199937010-00003
- E. S. EL Desoky, N. V. Nagaraja and H. Derendorf, “Population Pharmacokinetics of Digoxin in Egyptian Pediatric Patients: Impact of One Data Point Utilization,” American Journal of Therapeutics, Vol. 9, No. 6, 2002, pp. 492-498.
- N. Simon , A. Marsot, E. Villard, S. Choquet, H. X. Khe, N. Zahr, P. Lechat, V. Leblond and J. S. Hulot, “Impact of ABCC2 Polymorphisms on High-Dose Methotrexate Pharmacokinetics in Patients with Lymphoid Malignancy,” The Pharmacogenomics Journal, 2012 (online). doi:10.1038/tpj.2012.37
- L. R. Trevino, N. Shimasaki, W. Yang, J. C. Panetta, C. Cheng, D. Pei, D. Chan, A. Sparreboom, K. M. Giacomini, C. H. Pui, W. E. Evans and M. V. Relling, “Germline Genetic Variation in an Organic Anion Transporter Polypeptide Associated with Methotrexate Pharmacokinetics and Clinical Effects,” Jurnal of Clinical Oncology, Vol. 27, No. 35, 2009, pp. 5972-5978. doi:10.1200/JCO.2008.20.4156
- L. B. Ramsey, G. H. Bruun, W. Yang, L. R. Treviño, S. Vattathil, P. Scheet, C. Cheng, G. L. Rosner, K. M. Giacomini, Y. Fan, A. Sparreboom, T. S. Mikkelsen, T. J. Corydon, C. H. Pui, W. E. Evans and M. V. Relling, “Rare versus Common Variants in Pharmacogenetics: SLCO1B1 Variation and Methotrexate Disposition,” Genome Research, Vol. 22, No. 1, 2012, pp. 1-8. doi:10.1101/gr.129668.111