Open Journal of Air Pollution
Vol.04 No.02(2015), Article ID:56438,10 pages
10.4236/ojap.2015.42007
Dustfall Associated with Dust Storms in the Al-Ahsa Oasis of Saudi Arabia
Emad A. Almuhanna
Department of Agricultural Systems Engineering, King Faisal University, Hofuf, Saudi Arabia
Email: ealmuhanna@yahoo.com
Copyright © 2015 by author and Scientific Research Publishing Inc.
This work is licensed under the Creative Commons Attribution International License (CC BY).
http://creativecommons.org/licenses/by/4.0/


Received 28 March 2015; accepted 17 May 2015; published 20 May 2015
ABSTRACT
Dustfall is a major threat to agricultural and industrial infrastructures, as well as to other aspects of livelihood. Dustfall associated to a severe dust storm that hit the Al-Ahsa Oasis of Saudi Arabia during 12-13 March 2014 is discussed in this paper. The storm caused widespread and heavy dust deposition. A dramatic decrease in the visibility coincided with the storm, and the average dust concentrations recorded during a peak 10-hour period were 6772, 5862.4 and 451.1 µg/m3 for total suspended particles (TSP), particulate matter smaller than or equal to 10 µm (PM10) and those smaller than or equal to 2.5 µm (PM2.5), respectively. The lowest visibility was 200 m, and the wind speed increased to 17.5 m/s from the north. The average daily dust deposited in the study area during the event was 12.84 (SD = 1.2) g/(m2∙d). The dust samples comprised insoluble dust (48.5%) and soluble dust (51.5%). Based on the Munsell color system, the final color description of the falling dust was 10 YR/6/3. A microphotograph of the dustfall (settleable particulate matter) captured by a stereo dissection microscope shows that the dust particles had various colors and sizes, and they contained fibers and vegetative debris).
Keywords:
Saudi Arabia, Dust Storm, Sandstorm, Dustfall, Visibility, Atmospheric Deposition

1. Introduction
Dustfall is hazardous to human health and ecosystems, and it negatively impacts many industrial products and activities. Dust particles frequently act as surfaces for gaseous species reactions and for atmospheric gas/particle reactions related to nitrogen and sulfur cycles and acid/base balances; these particles are a source for a number of trace substances, and secondary particulate matter (PM) may greatly increase when dust particles are present in the atmosphere [1] [2] . Dust sources, transport patterns and their impacts on the global environment have attracted attention in recent decades [3] . However, basic information on the spatial and temporal variations of dust properties is still lacking [4] . A dust storm is a physical phenomenon associated with suitable meteorological conditions over arid and semi-arid regions, and it is generated when a gust front passes over or when the wind force exceeds the threshold value above which loose sand and dust are removed from the dry [5] [6] . The residence time of dust particles depends on the dust particle size, meteorological conditions, wind speed and precipitation that favor dry and wet deposition [7] .
Dust storms are considered a natural hazard that can affect daily life for periods between several hours to several days [8] . During certain seasons that account for approximately 30% of the year, regions of the Middle East such as Saudi Arabia are affected by dust storms. The frequency of dust storm occurrence peaks during the pre- monsoon season (March-May), when dust aerosols are transported by southwesterly winds from arid and semi- arid regions adjacent to the Arabian Sea [9] .
It has been reported that plant growth is hindered by dustfall and that dust blocks pores and reduces photosynthetic activity. Thus, the impact of dustfall on the economy and public health is significant [10] . Direct monitoring and theoretical calculations of pollution emissions are the basic methods of atmospheric pollution assessments [11] . During dust transport, many young plants are lost to the sand-blasting nature of the process at ground level, resulting in a loss of productivity. Plant infections are caused by the date palm dust mite Oligonychus afrasiaticus Meg. (Acari: Tetranychida), which is a severe pest in North Africa, the Near East and other date palm areas in the world [12] . The dust mite attacks the date palm fruits in their early developmental stages. The adult and nymph pests suck the sap of immature green date fruit, causing severe fruit scarring, distortion, browning and scabs. The skin of infested fruit becomes hard, cracks and shrivels [13] .
Dust characteristics, such as color, provide important information on its origin and chemical properties. The Munsell color system was created by Professor Albert H. Munsell in the early 1900s and was adopted by the United States Department of Agriculture (USDA) as the official color system for soil research in the 1930s. Munsell separated the hue, value, and chroma into perceptually uniform and independent dimensions; he was the first to systematically illustrate the colors in three-dimensional space [14] . Munsell’s system, particularly the revised versions, is scientifically based on rigorous measurements of human subjects’ visual responses to color. Because of this basis in human visual perception, Munsell’s system has outlasted contemporary color models. Although the system has been superseded by models such as CIELAB (L*a*b*) and CIECAM02, it is still widely used today [15] . Furthermore, Elminir et al. [16] proved that there was significant degradation in the solar collector efficiency caused by settling dust on the transparent glass cover.
Drifting sand and dunes have been devastating the oasis (Figure 1). Archeological investigations and field measurements conducted in this region reveal that sand has greatly reduced the cultivable area of Al-Ahsa littoral during the past two thousand years. Nearly half of the oasis may have been lost over the past ten centuries [17] .
The aim of this study is to examine the nature and characteristics of settling particles associated with the dust storm and to link the climatic conditions and aerosol mass loadings with dustfall during the dust storm, moreover, to estimate the mass, color and solubility characteristics of the settling dust.
2. Materials and Methods
Dustfall measurement devices and monitoring instruments were installed at the agricultural and veterinary training and research station of King Faisal University (KFU) of Saudi Arabia (25.3˚N, 49.6˚E; mean altitude above sea level: 172 m). This location is ~70 km inland of the coast. Another device was install on the roof of the college of agriculture sciences and food, King Faisal University main campus (Latitude angle 25.2˚N, longitude angle 49.35˚E), and approximately 80 km inland from the sea coast.
Airborne dust was measured by a fixed station (TOPAS, Turnkey Optical Particle Analysis System) to continuously record TSP, PM10, PM2.5 and PM1 particles, as well as the integrated wind speed and direction. The size distribution and number concentration of the airborne particles, the real-time particle number and the mass concentration were monitored using the HCT model PM-101P (Particulate Matter Spectrometer-HCT CO., Ltd., South Korea). This spectrometer measures particles from 0.3 to 25 µm and uses an air-sampling rate of 1 LPM with 15 channels.
The amount of settleable dust was measured using a settleable dust monitoring device developed in accordance with the ASTM Standard (ASTM D1739-98, 2010) [18] . Figure 2 is a photo of the dustfall measurement device.

Figure 1. The area experiencing sand movement in the Al-Ahsa Oasis (the yellow arc represents the border of the area). Source: Google Maps.
 (a) (b)
Figure 2. (a) Photograph of the dustfall measurement device; (b) Schematic of the dustfall measurement device.
An open-topped cylinder with a 15 cm diameter and 30 cm height (no less than twice the diameter) was used. The containers were made of galvanized steel, and tight-fitting lids were provided for each container. The stand for the container held the top of the container 2 m above the ground to avoid variability in the concentration of particles subject to settling. The setup also included an aerodynamic wind shield for better precision. The deposition rate, D, in grams/square meter/N days, i.e., g/(m2∙Nd), was obtained by [18] :
 (1)
(1)
where
A = collection area, the cross-sectional area within the diameter of the top of the container (m2);
W = mass, normalized if necessary to N days (g);
N = number of sampling days.
Containers were prepared and sealed in a laboratory and were then opened and set up at appropriately chosen sites so that particulate matter could settle into them over a period of time (approximately 30 days at the normal measurement span). The containers were then closed and returned to the laboratory. The sample was passed through a sieve to remove any leaves or insects. The masses of the water-soluble and water-insoluble components of the material were determined.
2.1. Measurement of Insoluble and Soluble Matter
The amount of insoluble and soluble matter was measured using procedures and protocols mentioned in the ASTM Standard (ASTM D1739-98, 2010) [18] . Conditioned filters were placed in Buchner funnels in flask sets (Figure 3). The weight of the insoluble particulate matter was obtained by drying the filter in the oven at 105˚C for 2 hrs and cooling it in a desiccator. Therefore, the weight of particles remaining on the filter was calculated. The weight of soluble matter was obtained by drying the concentrated filtrate in the flask.
2.2. Measurement of Settling Dust Color
The Munsell color system (Figure 4) was used to characterize the dust color. The Munsell color system is a color space that specifies colors based on three-color dimensions: hue, value (lightness), and chroma (color purity). Munsell separated the hue, value, and chroma into perceptually uniform and independent dimensions; he was the first person to systematically illustrate colors in three-dimensional space [14] .
The system consists of three independent dimensions that can be represented cylindrically in three dimensions as an irregular color solid: hue, measured by degrees around horizontal circles; chroma, measured radially outward from the neutral (gray) vertical axis; and value, measured vertically from 0 (black) to 10 (white) [20] .
o Hue, Each horizontal circle Munsell divided into five principal hues: Red, Yellow, Green, Blue, and Purple,

Figure 3. Components of the filtration system.
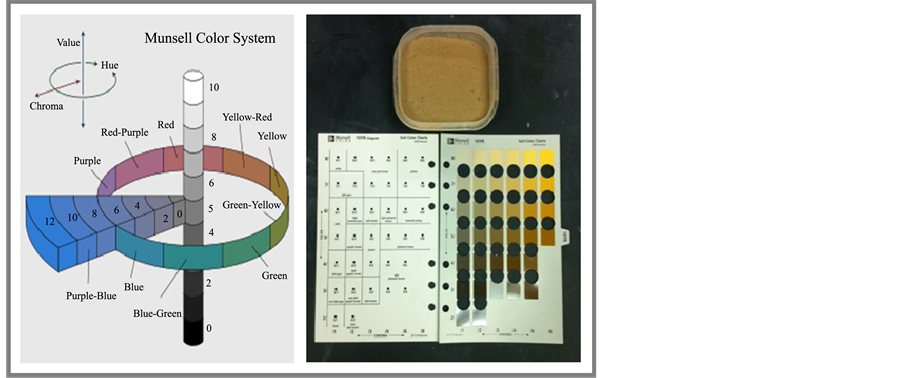
Figure 4. The Munsell color system showing a circle of hues at value 5 chroma 6, neutral values from 0 to 10; and the chromas of purple-blue (5 PB) at value 5 [19] .
along with 5 intermediate hues (e.g., YR) halfway between adjacent principal hues. Each of these 10 steps, with the named hue given number 5, is then broken into 10 sub-steps, so that 100 hues are given integer values. In practice, color charts conventionally specify 40 hues, in increments of 2.5, progressing as for example 10 R to 2.5 YR.
o Value, or lightness, varies vertically along the color solid, from black (value 0) at the bottom, to white (value 10) at the top. Neutral grays lie along the vertical axis between black and white.
o Chroma, measured radially from the center of each slice, represents the “purity” of a color (related to saturation), with lower chroma being less pure (more washed out, as in pastels).
2.3. Microphotographs of Dustfall
Microphotographs of the dustfall (settleable particulate matter) were taken by a stereo dissection microscope (Labomed, CZM6, California, USA) with an inbuilt digital camera (Labomed, iVu7000, California, USA). Computer images were captured using Labomed CapturePro 2.8.8.5 software.
3. Results and Discussion
On March 12-13, 2014, at approximately 10:00 AM, a widespread and severe dust storm with winds over 17.5 m/s moved over Al-Ahsa. This intense dust storm caused widespread and heavy dust deposition, which severely affected the visibility and air quality. The dust storm originated over the northern parts of Saudi Arabia near Kuwait and southern Iraq. The storm headed to south toward the eastern region of Saudi Arabia, where Al-Ahsa is located, and then continued southwest toward the Empty Quarter, where the dust storm primarily travelled through desert. Figure 5(a), Figure 5(b) show images from Meteosat at 57˚. These images show the development of the dust storm on March 12, 2014.
Figure 6(a), Figure 6(b) show an example of a frequent and strong dust storm in Al-Ahsa, Saudi Arabia. The color of the dust could indicates the dust origins (i.e., the dust composition).
3.1. Meteorological Conditions Associated with the Dust Event
Prior to and during the dust storm, the weather was relatively normal. When the storm arrived, the air temperature dropped by approximately 9˚C. The resulting maximum temperature was 27˚C during the storm compared with the 36˚C average maximum temperature (according to the monthly mean). It is likely that this reduction in the daytime temperature was caused by the reduced surface heating via shortwave energy extinction as additional aerosol loads arrived. The relative humidity dropped by approximately 10%; the average value was 29.6% during the storm compared with the monthly mean of 39.9%.
The atmospheric pressure dropped to a minimum of 984.34 mbar (sea level pressure of 1004 hPa) compared with 993.6 mbar (sea level pressure of 1014 hPa) recorded on the previous day.
Furthermore, the wind was relatively calm (1.6 m/s) just before the dust storm arrived. The wind speed rapidly
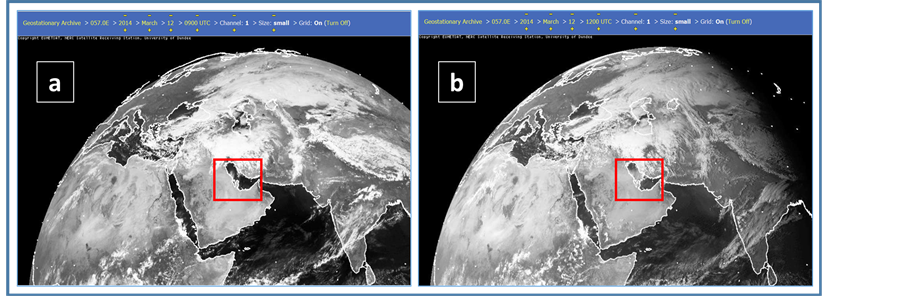
Figure 5. Meteosat VISSR (IODC) 057.0E panchromatic visible images showing the development of the dust storm on March 12, 2014, from 0900 UTC (a) to 1200 UTC (b) (from NERC Satellite Receiving Station, Dundee University, Scotland: http://www.sat.dundee.ac.uk/, courtesy of EUMETSAT: http://www.eumetsat.de/). Accessed March 2014.
increased to a maximum of 17.5 m/s from the north. By the end of March 12th, the wind speed began to decrease. This event started when the wind became southerly (180˚). At noon on March 12, the start of the storm, the wind direction changed to northwest, north-northwest, and then north by the second day. These conditions, confirmed by satellite images, clearly proved that the dust storm originated north to northwest of the Al-Ahsa region.
3.2. Airborne Particle Mass Concentration
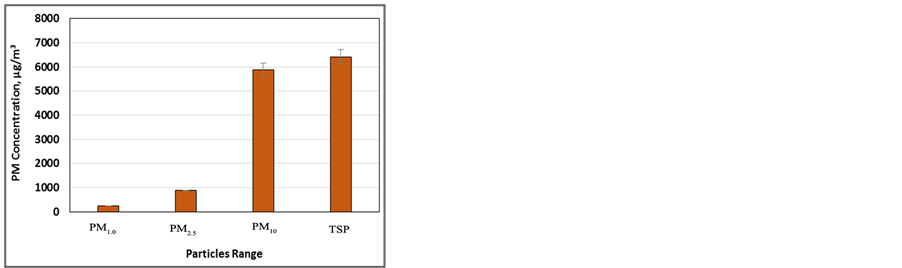
During the ten-hour peak of the dust storm, the maximum PM concentrations were 7389.8, 6500.2 and 491.4 (µg/m3) for TSP, PM10, and PM2.5, respectively (Figure 7), compared with the 2013 mean values of 783.2, 546.9 and 57 (µg/m3) for TSP, PM10, and PM2.5, respectively.
The relationship between the PM concentrations and the proportion of winds blowing toward the monitoring site are plotted in Figure 8.
Analyses of the wind data collected at Al-Hofuf (a major city in Al-Ahsa) and nearby climatic stations indicate that two semiannual windy periods occur in Al-Ahsa. The first period occurs from December to January and the second period occurs from April to June. The winds during these periods are mainly from the north (315˚ - 45˚); therefore, they are called “shamals” (northern winds). The winds last over 60 days, with wind speeds ranging from 5.4 to 15.7 m/sec. Shamals are dry and are loaded with sand and dust. However, the winter shamal is less noticeable because of the cooler and moister weather (Abdulmalik, 2005) [21] .
3.3. Particle Size Distribution
The particle size is one of the most important parameters for determining the effects of atmospheric particles. Although the size is a very important physical property that governs particle behavior, few investigations on PSDs during dust storms have been reported in the literature, and even fewer focus on Saudi Arabia. In this

Figure 6. Frequent and strong dust storm in Al-Ahsa, Saudi Arabia.
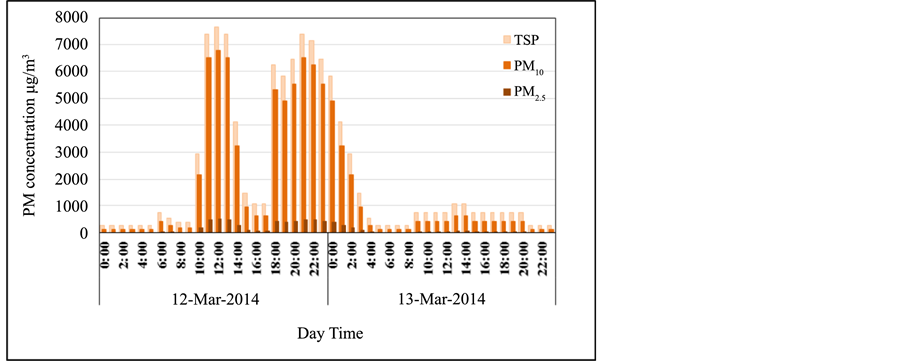
Figure 7. PM concentrations (TSP, PM10 and PM2.5) during the dust event.
study, the size distribution, number, and mass concentration of airborne particles during the dust storm of March 12-13, 2014, were monitored. The results are summarized in Table 1.
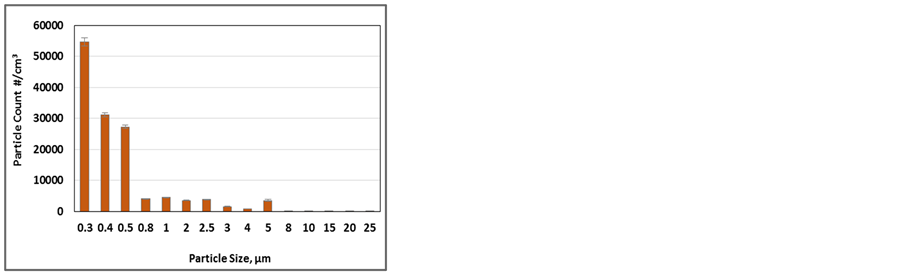
The geometric mean diameter GMD based on the numerical distribution was 0.48 µm, and the geometric standard deviation GSD was 2.37. Based on the mass distribution, the GMD was 13.58 µm and the GSD was 18.56. Figure 9(a), Figure 9(b) shows the PSDs based on the number and mass concentrations.
The cumulative percentages of particle mass concentrations for the size range 0.3 - 25 μm demonstrate that a large proportion of the particles were larger than 2.5 μm in diameter (> 85%). The cumulative percentage results of the particle number concentrations for the size range 0.3 - 25 μm show that the majority of particles were smaller than 0.5 μm (>90%). This indicates that a significant proportion of the dust mass was likely deposited in the nasal and pharyngeal regions when inhaled. Over time, the larger particles settled to the surface, leaving the smaller particles suspended in air. This resulted in a smaller GMD and lower concentrations. However, the remaining particles were more dangerous due to their ability to penetrate respiratory systems. Settling dust solubility rates and color characteristics will be discussed in a separate paper.
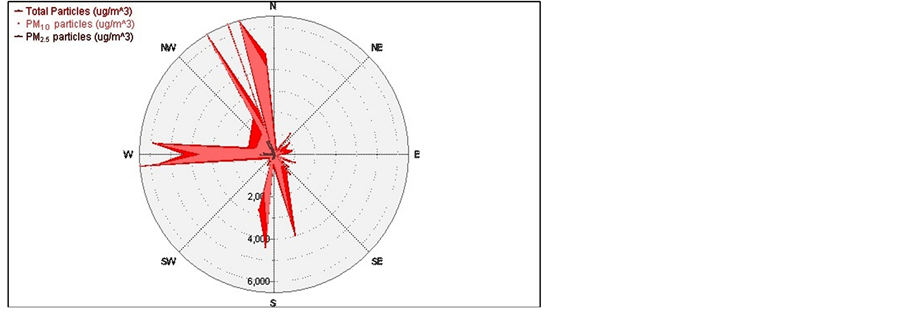
Figure 8. Relation between the PM concentrations and wind direction during the dust storm on March 12, 2014.
 (a) (b)
Figure 9. Particle size distributions based on the particle number (count) and mass concentrations. The error bars denote the standard deviations.

Table 1. Particle number and mass distributions.
3.4. Measurement of Dustfall (Settleable Particulate Matter)
Analysis of dust deposition allows for the determination of the total deposited dust. To the best of our knowledge, there are currently no ambient air quality guidelines for deposited dust in Saudi Arabia. Dust deposition on windows, outside of houses, on plants and on cars is an example of nuisance dust (Figure 10).
In the present study, 12.84 (SD = 1.2) g/(m2∙d) of settled dust was collected during the two-day dust storm. Compared with normal conditions, Modaihsh and Mahjoub [22] show that the average monthly dustfall, in tons/km2, during March at 14 sampling locations in Riyadh, Saudi Arabia, ranged from 19.51 to 206.07 tons/ km2, with an average monthly value of 47.2 tons/km2 (corresponding to 1.6 g/m2∙day). In studies conducted by Khalaf and Hashash [23] and AL-Awadhi [24] , the monthly average data reported on the aeolian sedimentation in the northwestern Arabian Gulf was 36 to 70 tons/km2 (1.2 to 2.33 g/m2∙d) at various locations in Kuwait during 1979-1980. The dust fallout in northern Kuwait during normal (summer) periods is 5.8 g/m2/month (0.19 g/m2∙d).
3.5. Measurement of Insoluble and Soluble Matter
Insoluble matter is the solid material collected by filtering a sample, while the soluble matter is determined by evaporating the liquid filtrate. In general, soluble material is of little interest in assessing nuisance effects. The results in Table 2 show the concentration of insoluble solids and soluble solids. Based on the results, soluble solids had a higher mean concentration compared with insoluble solids.
3.6. Color of Settling Dust
Dust color is a characteristic that provides important information on the origin and chemical properties of settling dust. In addition, dust color gives an indication of dust properties and effects of the dust on the settling area. A study on dust color from different sources and the deserts of Saudi Arabia will be conducted in the future to establish a database used for dust source identification. The Munsell color system (Munsell soil color book) was used to characterize the settling dust color (Table 3).
Figure 11 shows a microphotograph of the dustfall (settleable particulate matter) of the dust storm taken by a stereo dissection microscope. A microphotograph of the dust sample helps identify the characteristics of the dust

Figure 10. Examples of dustfall (settleable particulate matter) on different surfaces.
Table 2. Mean concentrations of insoluble, soluble and total solids (n = 3).

Figure 11. Microphotographs of the dustfall (settleable particulate matter) were taken using a stereo dissection microscope.
Table 3. The color characteristics of settling dust during March 12-13.
sample. Dust particles taken from the dustfall had various colors and sizes and contained fibers and vegetative debris, indicating a natural dust origin.
4. Conclusions
This paper reports the characteristics of falling dust particles during the major dust storm on March 12-13, 2014, in Al Ahsa, Saudi Arabia. This severe dust storm caused widespread and heavy dust deposition and low visibility. The primary findings are as follows. The average concentrations of TSP, PM10 and PM2.5 were 6772, 5862.4 and 451.1, respectively. The particle size distribution revealed that the GMD was 13.58 μm based on the mass concentration. Alternatively, based on the number concentration of the particles, the GMD was 0.48 μm. The cumulative particle mass concentration demonstrated that the majority of the particles were larger than 2.5 μm (>85%).
The amount of dust deposited during the dust event was 12.84 (SD = 1.2) g/(m2∙d), indicating an intense and heavy settling rate of the relatively large dust particles. The dust samples comprised 48.5% insoluble dust and 51.5% soluble dust.
The final color description of the falling dust was (10YR/6/3) based on the Munsell color system.
A microphotograph of the dustfall (settleable particulate matter) in the dust storm captured by a stereo dissection microscope shows that the dust particles had various colors and sizes and contained fibers and vegetative debris.
The study results provide important information on the potential impacts of storm dustfall in which the dustfall was considered a major threat to the agricultural and industrial infrastructure and to other aspects of livelihood.
The readers should be advised that the data presented in this report only represent one storm and that pattern and characteristics may vary between events.
Acknowledgements
The author would like to thank the Deanship of Scientific Research of King Faisal University, Hofuf, Saudi Arabia, for financial support (grant No. 140038). Thanks are also extended to Dr. Saeed Alramadan at the veterinary college for his help with the microphotographs.
References
- Querol, X., Pey, J., Pandolfi, M., Alastuey, A., Cusack, M., Perez, N., Moreno, T., Viana, M., Mihalopoulos, N., Kallos, G. and Kleanthous, S. (2009) African Dust Contributions to Mean Ambient PM10 Mass-Levels across the Mediterranean Basin. Atmospheric Environment, 43, 4266-4277. http://dx.doi.org/10.1016/j.atmosenv.2009.06.013
- Badarinath, K.V.S., Kharol, S.K., Kaskaoutis, D.G., Sharma, A.R., Ramaswamy, V. and Kambezidis, H.D. (2010) Long-Range Transport of Dust Aerosols over the Arabian Sea and Indian Region: A Case Study Using Satellite Data and Ground-Based Measurements. Global Planet Change, 72, 164-181. http://dx.doi.org/10.1016/j.gloplacha.2010.02.003
- Grousset, F.E. and Biscaye, P.E. (2005) Tracing Dust Sources and Transport Patterns Using Sr, Nd and Pb Isotopes. Chemical Geology, 222, 149-167. http://dx.doi.org/10.1016/j.chemgeo.2005.05.006
- Feng, J., Zhu, L., Ju, J., Zhou, L., Zhen, X., Zhang, W. and Gao, S. (2008) Heavy Dustfall in Beijing, on April 16-17, 2006: Geochemical Properties and Indications of the Dust Provenance. Geochemical Journal, 42, 221-236. http://dx.doi.org/10.2343/geochemj.42.221
- Cao, J.J., Lee, S.C., Zheng, X.D., Ho, K.F., Zhang, X.Y., Guo, H., Chow, J.C. and Wang, H. (2003) Characterization of Dust Storms to Hong Kong in April 1998. Water, Air, and Soil Pollution: Focus, 3, 213-229. http://dx.doi.org/10.1023/A:1023202926292
- Goudie, A.S. (2009) Dust Storms: Recent Developments. Journal of Environmental Management, 90, 89-94. http://dx.doi.org/10.1016/j.jenvman.2008.07.007
- Aydin, F., Aydint, I., Erdogan, S., Akba, O., Isik, B. and Hamamci, C. (2012) Chemical Characteristics of Settled Particles during a Dust-Storm. Polish Journal of Environmental Studies, 21, 533-537.
- Maghrabi, A., Alharbi, B. and Tapper, N. (2011). Impact of the March 2009 Dust Event in Saudi Arabia on Aerosol Optical Properties, Meteorological Parameters, Sky Temperature and Emissivity. Atmospheric Environment, 45, 2164- 2173. http://dx.doi.org/10.1016/j.atmosenv.2011.01.071
- Ackerman, S.A. and Cox, S.K. (1989) Surface Weather Observations of Atmospheric Dust over the Southwest Summer Monsoon Region. Meteorology and Atmospheric Physics, 41, 19-34. http://dx.doi.org/10.1007/BF01032587
- Chung, Y.S., Kim, H.S., Jugder, D., Natsagdorj, L. and Chen, S.J. (2003) On Sand and Duststorms and Associated Significant Dustfall Observed in Chongju-Chongwon, Korea during 1997-2000. Water, Air, and Soil Pollution: Focus, 3, 5-19. http://dx.doi.org/10.1023/A:1023242000367
- Frolova, N.S., Zinchenko, G.S. and Papina, T.S. (2007) Influence of Regional Atmospheric Processes on the Formation of Dust Pollution Layers in Belukha Glacial Deposits. Russian Meteorology and Hydrology, 32, 212-216. http://dx.doi.org/10.3103/S1068373907030090
- Fetoh, B.E.S.A. and Al-Shammery, K.A. (2011) Acaricidal Ovicial and Repellent Activities of Some Plant Extracts on the Date Palm Dust Mite, Oligonychus afrasiaticus Meg. (Acari: Tetranychidae). International Journal of Environmental Science and Engineering (IJESE), 2, 45-52.
- Aldosari, S.A. (2009) Occurrence of Dust Mite, Oligonychus afrasiaticus Meg. On Fruits, Leaflets of Some Date Palm Trees and Evaluation of the Efficiency of Botanical Compound, (Biaco) as Compared with Some Acaricides. AUCES.
- Kuehni, R.G. (2002) The Early Development of the Munsell System. Color Research and Application, 27, 20-27. http://dx.doi.org/10.1002/col.10002
- Landa, E.R. and Fairchild, M.D. (2005) Charting Color from the Eye of the Beholder. American Scientist, 93, 436-443. http://dx.doi.org/10.1511/2005.55.975
- Elminir, H.K., Ghitas, A.E., Hamid, R.H., El-Hussainy, F., Beheary, M.M. and Abdel-Moneim, K.M. (2006) Effect of Dust on the Transparent Cover of Solar Collectors. Energy Conversion and Management, 47, 3192-3203. http://dx.doi.org/10.1016/j.enconman.2006.02.014
- Abolkhair, Y.M. (1981) Sand Encroachment by Wind in Al-Hasa of Saudi Arabia. Dissertation, Indiana University, Bloomington.
- ASTM D1739-98 (2010) Standard Test Method for Collection and Measurement of Dustfall (Settleable Particulate Matter). ASTM International, West Conshohocken.
- Munsell Color (2014) http://munsell.com/about-munsell-color/.
- Cleland, T.M. (1921) The Munsell Color System: A Practical Description with Suggestions for Its Use. Munsell Color Company. http://www.applepainter.com/
- Abdulmalik, A., Alghamdi, A. and Al-Kahtan, N.S. (2005) Sand Control Measures and Sand Drift Fences. Journal of Performance of Constructed Facilities, 19, 295-299.
- Modaihsh, A.S. and Mahjoub, M.O. (2013) Falling Dust Characteristics in Riyadh City, Saudi Arabia during Winter Months. APCBEE Procedia, 5, 50-58. http://dx.doi.org/10.1016/j.apcbee.2013.05.010
- Khalaf, F. and Al-Hashash, M. (1983) Aeolian Sedimentation in the North-Western Part of the Arabian Gulf. Journal of Arid Environments, 6, 319-332.
- Al-Awadhi, J. (2005) Dust Fallout Characteristics in Kuwait: A Case Study. Kuwait Journal of Science, 32, 135-152.