Open Journal of Air Pollution
Vol.1 No.3(2012), Article ID:25514,7 pages DOI:10.4236/ojap.2012.13009
Changing Characteristics on Dust Strom in Jiangsu
1Jiangsu Provincial Meteorological Bureau, Nanjing, China 2Haian Meteorological Bureau, Haian, China
Email: jsqxszt@126.com
Received September 25, 2012; revised October 26, 2012; accepted November 9, 2012
Keywords: Dust Strom; Characteristics of Changes
ABSTRACT
Based on observation data of dust strom for the years 1960-2006 from weather stations across Jiangsu, this essay provides a statistical analysis on the characteristics and trends, including the timeframes and regions of the incidences of four weather phenomena: sandstorm, blowing sand, floating dust and haze in an effort to better understand the trend of dust strom changes in Jiangsu Province, China. The result indicates that, on average, the incidences of sandstorm, indicated with the total number of days in a year in Jiangsu is low and on a declining trend. With the improvement of the environment, no sandstorm has been observed for many years. In general, those of blowing sand and floating dust have been reducing, and showing a significant improvement during the recent years. What should be noted, however, is the accelerated increase in haze incidences, particularly, in Southern Jiangsu.
1. Introduction
Global warming, along with increasingly frequent extreme weather events, has brought new challenges for the social and economic development. Particularly, dust weather is a known cause of environmental pollution [1], disruption to terrestrial radiation [2], economic losses and harm to human health. Incidences of dust weather usually have to do with terrestrial vegetation coverage. In the Yellow River Basin and areas to its north, where both precipitation and vegetation coverage are low, incidences of dust weather are higher. In the Yangtze River Basin, particularly, in areas south of the River, which are known for abundant rainfall, higher temperatures and higher vegetation coverage, the incidences of sandstorm are low. Located between these two regions, the Huai River Basin has limited incidences of dust strom [3].
In Jiangsu, which is one of the most developed provinces in China, According to some statistics, the loss brought by weather disasters is about 3% - 6% of its GDP, far above the national average. As a hidden hazardous weather condition, dust strom has significant impact on people’s life. During the recent years, there have been numerous research findings on dust strom [4,5] and other sand/dust-related weather conditions [6-8]. Located in the lower reaches of the Yangtze River and the Huai River, Jiangsu is a buffer zone between, there is exceptionally few and few dust strom incidences. Due to less intense public concern, there have been little researches on the timeframe and regional characteristics and trends of dust strom incidences in Jiangsu. Based on Jiangsu’s 47a dust strom observation data, this essay provides an analysis on the characteristics and trends of dust strom, including the timeframes and regions of incidences, as a reference for dust strom watch and warning.
2. Data Source and Data Processing
2.1. Definition of Dust Strom
In total, there are 9 visual range-restricting weather phenomena, including sandstorm, blowing sand and floating dust, which are collectively called dust strom phenomena [9]. Sandstorm is a weather phenomenon where, the air gets so turbid due to the large amount of sand particles stirred by the force of wind, that the visual range is less than 1 km. Blowing sand is a phenomenon where, due to sand saltation and the turbidity of air, the visual range is between 1 - 10 km. Floating dust is one where, due to the suspension of dust and smaller sand particles, the visual range is less than 10 km. Mostly, floating dust incidences are brought about by upper airstreams, or the result of sandstorms and blowing sand, where the smaller particles suspend in the air before they finally deposit [10,11].
Haze is a phenomenon where, due to the suspension of a large amount of very small, dry dust particles, the air gets so turbid that the visual range is less than 10 km. Worldwide, haze has been one of the focused areas of researchers since the 1990s [12,13]. While haze does not fall into the scope of dust strom, it has a common aspect with the later, i.e., the existence of dry dust particles that deteriorates air quality. Therefore, it is analyzed along with dust strom phenomena.
2.2. Data Source
47a day-to-day meteorological data for the years 1960- 2006 were selected from 13 national class-I observation stations in Huai’an, Nanjing, Lusi, Xuzhou, Ganyu, Xuyu, Sheyang, Dongdai, Gaoyou, Nantong, Changzhou, Liyang and Dongshan, which are manned 24-hours a day.
2.3. Data Processing
1) Whenever a weather phenomenon is observed, it is counted as a day (d) of the specific type, regardless of the duration and number of incidences in that day. 2) Province-wide accumulated days are the total days observed in all 13 stations, i.e., Huai’an, Nanjing, Lusi, Xuzhou, Ganyu, Xuyu, Sheyang, Dongdai, Gaoyou, Nantong, Changzhou, Liyang and Dongshan. 3) The days of the Area North of Huai River (ANHR) are the total of Xuzhou and Ganyu stations. The days the Area between Huai River and the Yangtze River (ABHR-YR) are the total of 7 stations, i.e., Huai’an, Lusi, Xuyu, Sheyang, Dongtai, Gaoyou and Nantong. The days of Southern Jiangsu are the total of 4 stations, i.e., Nanjing, Changzhou, Liyang and Dongshan. 4) The monthly (yearly) total of any particular region is the average days of that region, i.e., the total days in that particular month (year) divided by the number of stations in the region, expressed in D. 5) In order to study cross-year sand/dust-related climate changes, the subject years are divided into year groups (YG) of five years each, i.e., YG1 (1960-1964), YG2 (1965- 1969)···, and YG9 (2000-2004). The total days of any particular region in any particular year group is an average number, i.e., the total days in that region in that particular year group divided by the number of stations in the region divided by 5 years, expressed in D. 6) The calculation of Climate Tendency Rate (CTR) is that assuming that the cross-year climate element is y(t), of which, the tendency of change over time is simulated with a unary regression equation, then we can get y(t) = a + bt, where “a” is a constant; “b × 10” is the tendency of change; and the positive/negative signs of b indicate the upward or downward trends.
3. Results and Discussion
3.1. General Characteristics of Dust Strom
1) Percentages of dust strom types. Statistics show incidences of all dust strom types in Jiangsu, given the different distribution and percentage of each (see Table 1). Apparently, the Area North of Huai River (NRHR) has the least dust strom days, and Southern Jiangsu the most— about 50% of the provincial total. In all regions, including NRHR, the Area between Huai River and the Yangtze River (ABHR-YR) and Southern Jiangsu, the percentages of dust strom types sequence haze > floating dust > blowing sand > sandstorm in terms of incidences. Province-wide, sandstorm has the least incidences—3 d in 1976-1997, and zero in 1998-2006, indicating that sandstorm is no longer a threat to Jiangsu.
2) Yearly distribution of dust strom. Figure 1 illustrates the incidences of dust strom types over the years. In general, dust strom incidences have been on the rise in all regions, including ANHR, ABHR-YR and Southern Jiangsu, as proved by their climate tendency rates: 0.587 d·(10a)–1, 2.348 d·(10a)–1 and 13.263 d·(10a)–1 respectively. Particularly, Southern Jiangsu has the fastest speed of increase. Figure 2 is based on the number of days of each dust strom type in year group. Obviously, dust strom incidences of ANHR and ABHR-YR have been largely stable, while those of Southern Jiangsu have been increasing at a faster speed since 2000.
3) Monthly distribution of dust strom. Figure 3 shows the incidences of dust strom types in the regions by

Table 1. Percentages and days of dust strom by types.
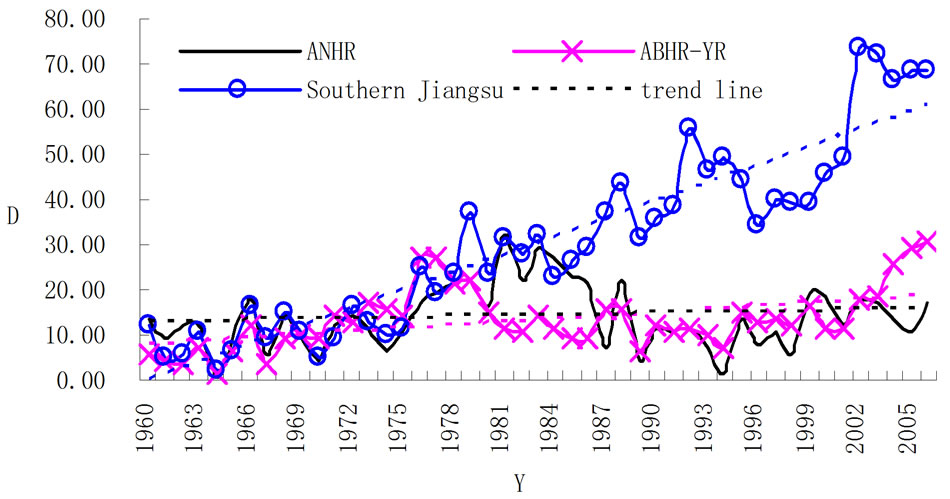
Figure 1. Average days and trends of dust strom by each year.
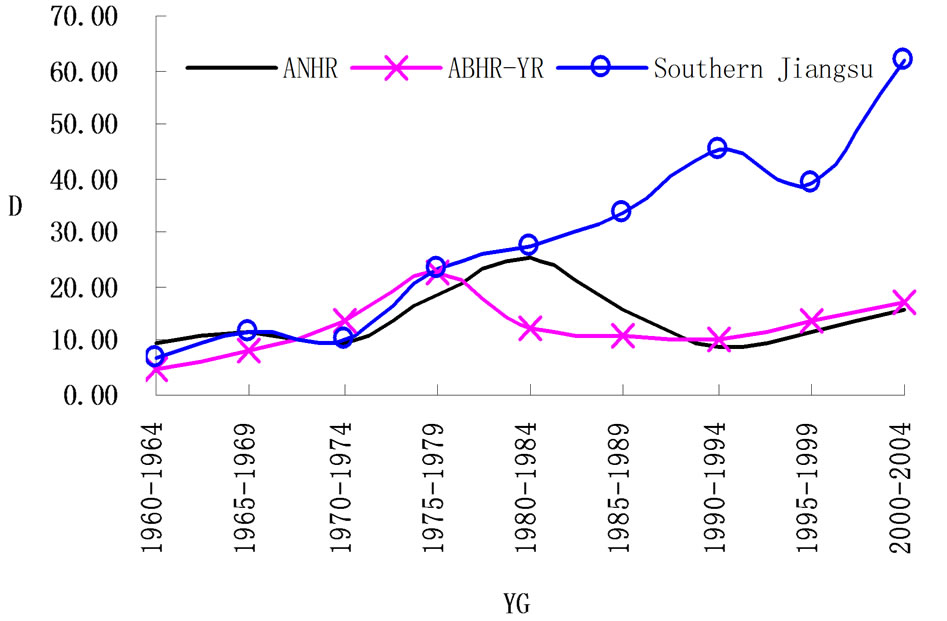
Figure 2. Average days of dust strom by year group.
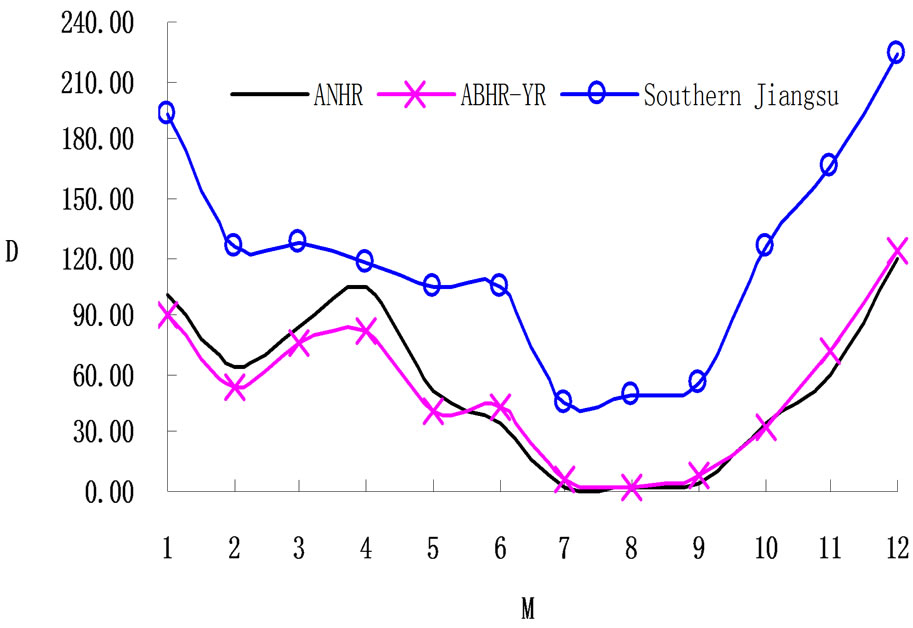
Figure 3. Average days of dust strom by each month.
month. In general, the July-September timeframe has the least incidences, as the number bottoms in July, and gradually increases in September through December. It peaks in December before starting a downward trend again till next July. It is similar to the trends of monthly precipitation and terrestrial vegetation coverage changes.
3.2. Characteristics of Sandstorm Incidence Distribution
1) Yearly distribution of sandstorm incidences. Figure 4 illustrates the incidences of sandstorms over the years. Province-wide, only a few sandstorm days are recorded, mostly in ANHR. In general, sandstorm incidences have been on a downward trend, as proved by the climate tendency rates of –0.162 d·(10a)–1, –0.044 d·(10a)–1 and –0.008 d·(10a)–1. Figure 5 shows sandstorm incidences by year group. Most of the sandstorm incidences were observed before the 1970s. Few incidences have been reported since the 1970s.
2) Monthly distribution of sandstorm incidences. Figure 6 illustrates the incidences of sandstorms by month. In ANHR, sandstorms occur mostly in January through August, with incidences peaking in June. In ABHR-YR, sandstorms occur mostly in October through the next June, with incidences peaking April. In Southern Jiangsu, sandstorms occur mostly in March-May and November-December, with few incidences in both time—M frames.
3.3. Characteristics of Blowing Sand Incidence Distribution
1) Yearly distribution of blowing sand incidences. Figure 7 is illustrates the incidences of blowing sand over the years. In general, ANHR, ABHR-YR and Southern Jiangsu all reported downward trends of blowing sand incidences, with their climate tendency rates being –0.63

Figure 4. Average days and trends of sandstorm by each year.
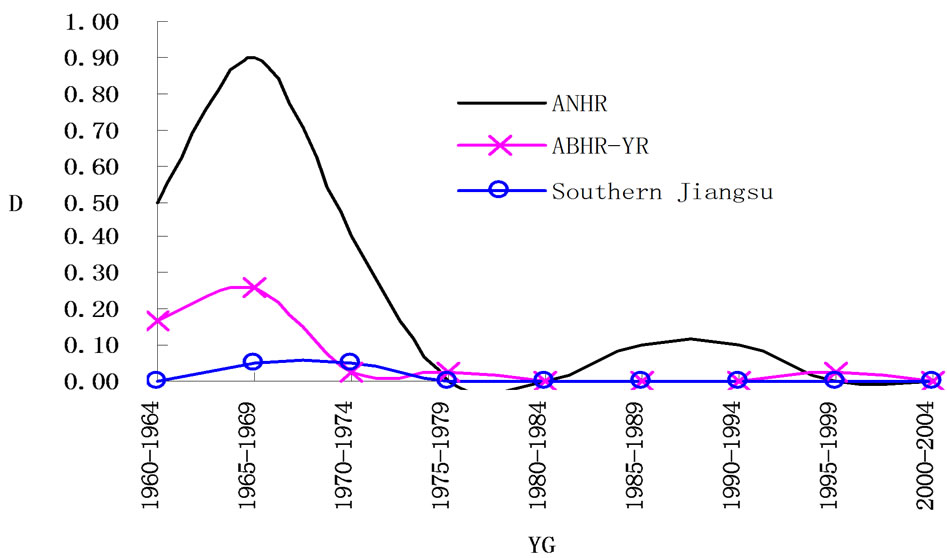
Figure 5. Average days of sandstorm by year group.
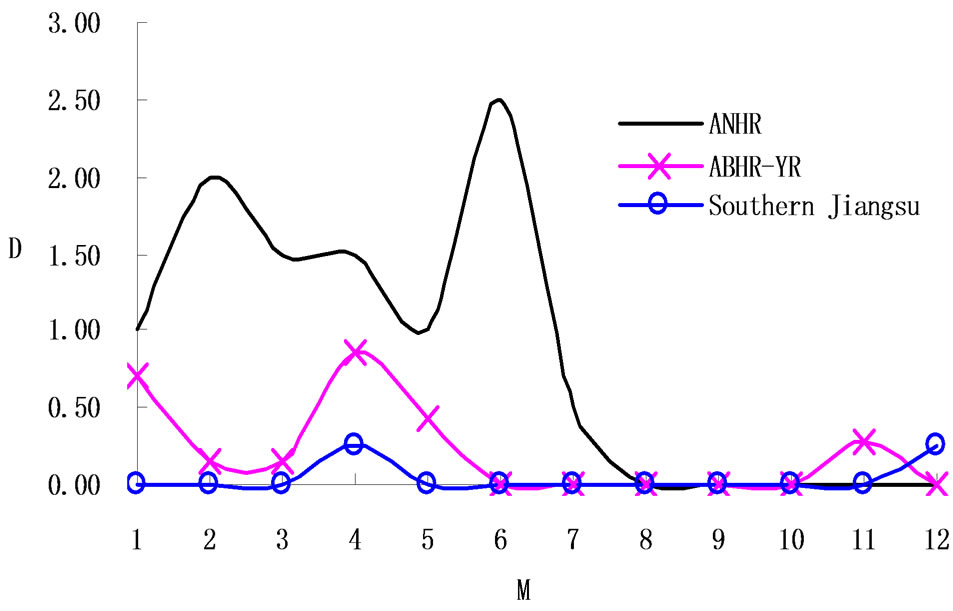
Figure 6. Average days of sandstorm by each month.
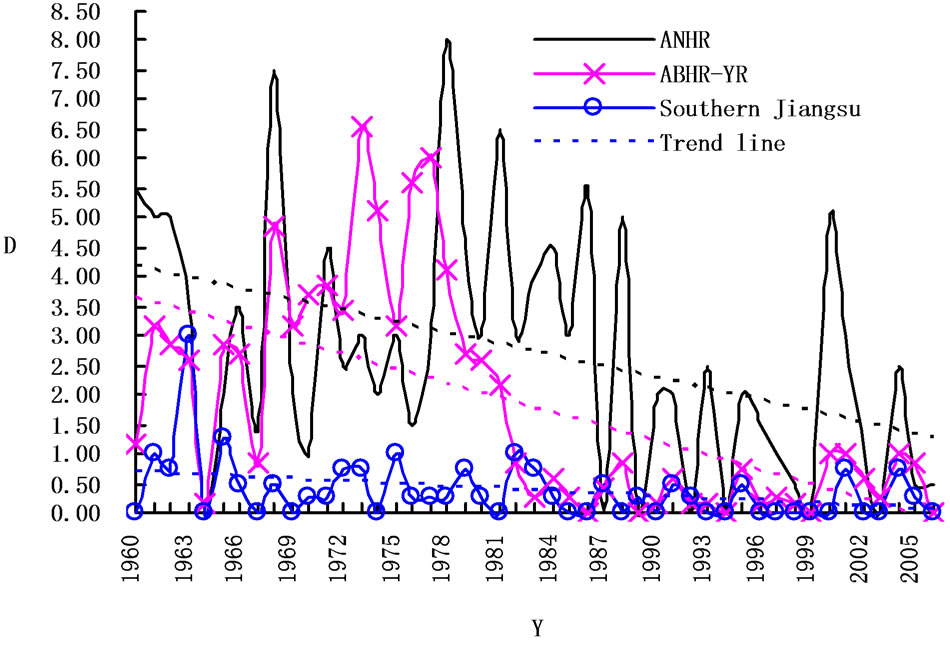
Figure 7. Average days and trends of blowing sand by each year.
d·(10a)–1, –0.813 d·(10a)–1 and –0.144 d·(10a)–1 respectively. Particularly, ABHR-YR has reported the fastest speed of decline. Figure 8 shows the incidences of blowing sand by year group. Obviously, in ANHR, the number of days reached its high level in the 1960s, and peaked in the mid 1980s, when it started to decrease rapidly before bottoming in the later 1990s and taking an upward trend again in 2000. In ABHR-YR, the number of blowing sand days increased significantly in the 1960s and the 1970s, when it overtook ANHR, it decreased fast to approach the level of Southern Jiangsu and less ANHR throughout the 1980s, it maintained roughly the same level of Southern Jiangsu throughout 1990s, and started to increase rapidly in 2000, expanding the gap with the later. In Southern Jiangsu, the number of blowing sand days has been the lowest across the province. It started to decrease gradually in the 1960s through the 1980s, and bottomed in the 1990s. Given the minor rebound since 2000, it has been largely stable ever since.
2) Monthly distribution of blowing sand incidences. Figure 9 shows the incidences of blowing sand by month. In ANHR, the number of blowing sand days peak in April, followed by March and May, while July, August and September are the lowest months. In ABHR-YR, blow-
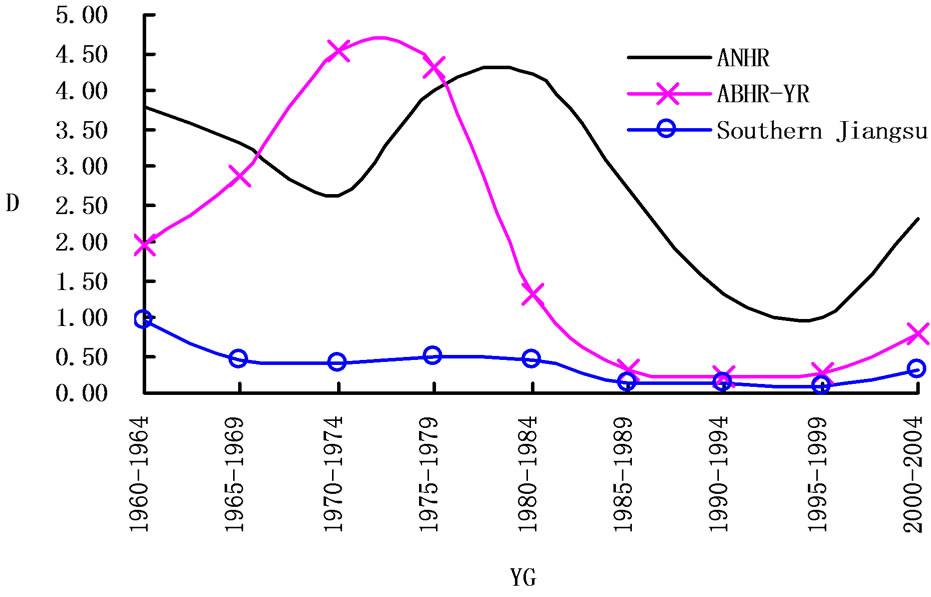
Figure 8. Average days of blowing sand by year group.

Figure 9. Average days of blowing sand by month.
ing sand incidences peak in March, followed by February, April and May, while July, August and September are the lowest months, like the case in ANHR. In Southern Jiangsu, few blowing sand days are observed throughout the year. In general, more incidences are observed in the November-May timeframe than in the June-October timeframe. The reason is that in March and April, there are usually less rainfall, more cold airstream activities and gusts, and the temperature is higher—all these are favorable conditions for blowing sand. In July, August and September, which make up the rain season, the air is more humid, and would prevent the occurrence of blowing sand.
3.4. Characteristics of Floating Dust Incidence Distribution
1) Yearly distribution of floating dust incidences. Figure 10 shows the incidences of floating sand over the years. In general, ANHR, ABHR-YR and Southern Jiangsu all reported downward trends of floating dust incidences, with their climate tendency rates being –0.717 d·(10a)–1, –1.369 d·(10a)–1 and –1.727 d·(10a)–1 respectively. Particularly, Southern Jiangsu has reported the fastest speed of decline. Figure 11 shows the incidences of floating dust by year group. Obviously, in ANHR, the number of floating dust days increased significantly in the 1960s
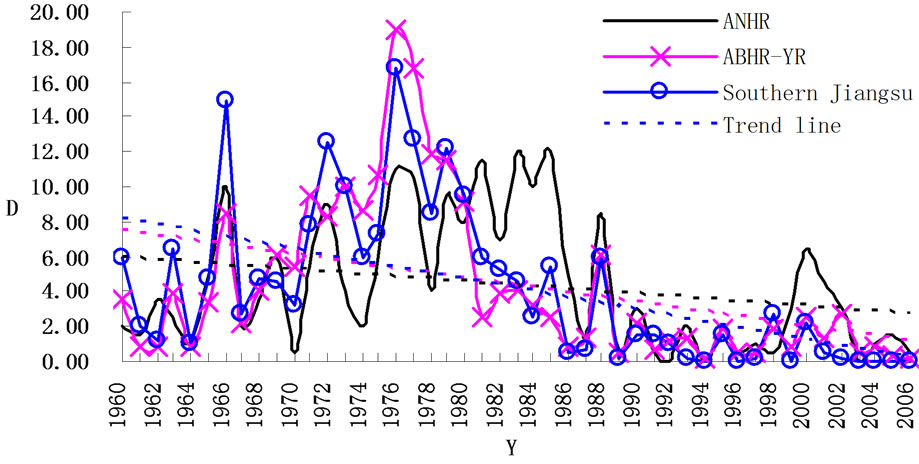
Figure 10. Average days and trends of floating dust by each year.

Figure 11. Average days of floating dust by year group.
through the mid 1980s, when it started to decrease significantly. It reached the same low level of ABHR-YR and Southern Jiangsu in the 1990s, and maintained that level throughout the decade. In the later 1990s, it started to increase slowly-yet at a pace faster than those of ABHR-YR and Southern Jiangsu. In ABHR-YR, the number of floating dust days increased significantly in the 1960s through the mid 1970s, surpassing that of AN-HR in the later 1960 and the later 1970s. In contrast to ANHR, it decreased fast in the 1980s. Since 2000, it embarked on another slow upward trend-at a pace slower than that of ANHR. The trend of floating dust in Southern Jiangsu is similar to that of ABHR-YR.
2) Monthly distribution of floating dust incidences. Figure 12 shows the incidences of floating dust by month. The data are similar for ANHR, ABHR-YR and Southern Jiangsu, with the peaks occurring in April and the bottom in July. Incidences in August and September are similar to those of July. Fast increase is observed in September. After the second peak month, December, incidences start to decline again, till the second bottom month, February.
3.5. Characteristics of Haze Incidence Distribution
1) Yearly distribution of haze incidences. Figure 13 shows the incidences of haze over the years. In general, haze incidences of ANHR, ABHR-YR and Southern Jiangsu have been on the rise, as proved by their respective climate tendency rates: 2.096 d·(10a)–1, 4.574 d·(10a)–1 and 15.143 d·(10a)–1. Southern Jiangsu has the highest speed of increase, followed by ABHR-YR and ANHR sequentially. Figure 14 shows the incidences of haze by year group. Obviously, province-wide, the number of haze days was at its lowest level in the 1960s and 1970s, when those of ANHR and ABHR-YR started to climb slowly and that of Southern Jiangsu increased rapidly, expanding the gaps with the other two.
2) Monthly distribution of haze incidences. Figure 15 shows the incidences of haze by month. Obviously, ANHR, ABHR-YR and Southern Jiangsu has similar distributions, only that ANHR and ABHR-YR have similar haze days and that of Southern Jiangsu is much higher. Few haze incidences are observed in July, August and September. The number of haze days starts to increase

Figure 12. Average days of floating dust by each month.
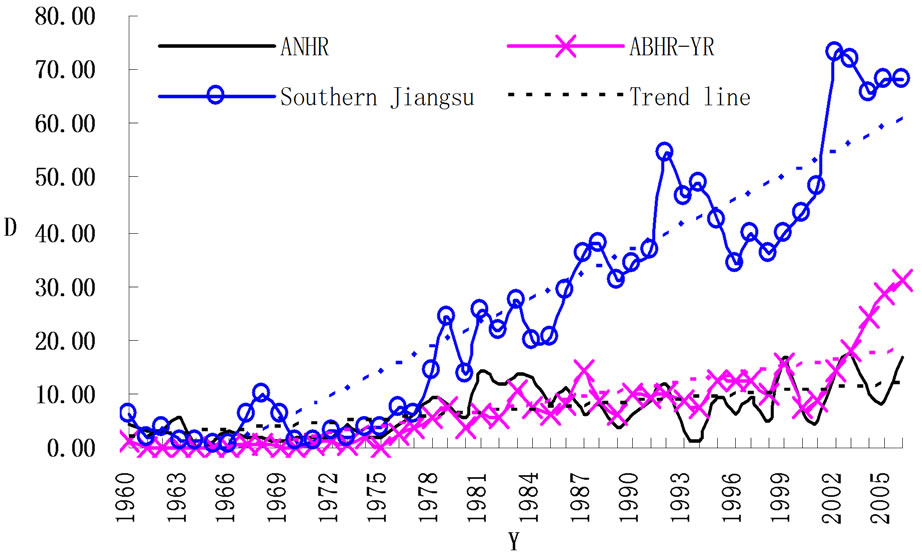
Figure 13. Average days and trends of haze by each year.
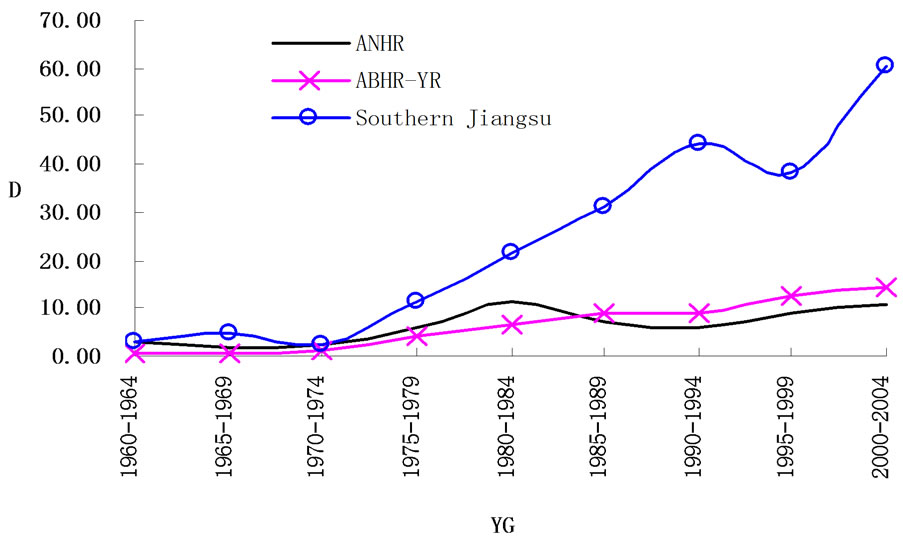
Figure 14. Average days of haze by year group.

Figure 15. Average days of haze by each month.
gradually in September and reaches its peak in December. Then it would start to decrease till the second bottom month. It increases slightly in the May-July timeframe before taking on a downward trend once again.
3) The changing characteristics of Vegetation. It is known as a land of fish and rice since ancient times in Jiangsu province China, Wasteland has constantly been developed into fertile land from 50s, meanwhile area of man-made forests expands unceasingly from 90s (Figure 16), it is shaped that Vegetation and soil and water conservation is getting better and better, to reduce dust strom.
4) The changing characteristics of air pollution. Jiangsu province is China’s coastal economically developed provinces, social economy developed, although the achievements in energy conservation and emission reduction, but the air quality than before there are still falling, there is a probability of acid rain increased dramatically as Xuzhou (Figure 17), at the same time haze weather are more and more.
4. Summary
1) Most of the sandstorm incidences occurred in ANHR in the 1960s and the 1970s. During the recent years, very few sandstorms were observed in Jiangsu, making studies on possible actions against sandstorm less important.
2) Significant changes in the regional distributions of blowing sand and floating dust have been observed. Most incidences occurred in ANHR and ABHR-YR in the 1960s and the 1970s. A few stations have reported sharp increases in the 1970s. Since the beginning of the 1980s, there has been a general trend of decline, with most incidences reported in spring and least in summer. It is consistent with the trend of changes in local vegetation coverage. Therefore, increasing vegetation coverage proves to be the most effective way of reducing blowing sand and floating dust incidences.
3) Haze has the highest incidences and frequency of occurrence. It has also shown an upward trend, and ac-

Figure 16. Area of man-made forests in Jiangsu Province.
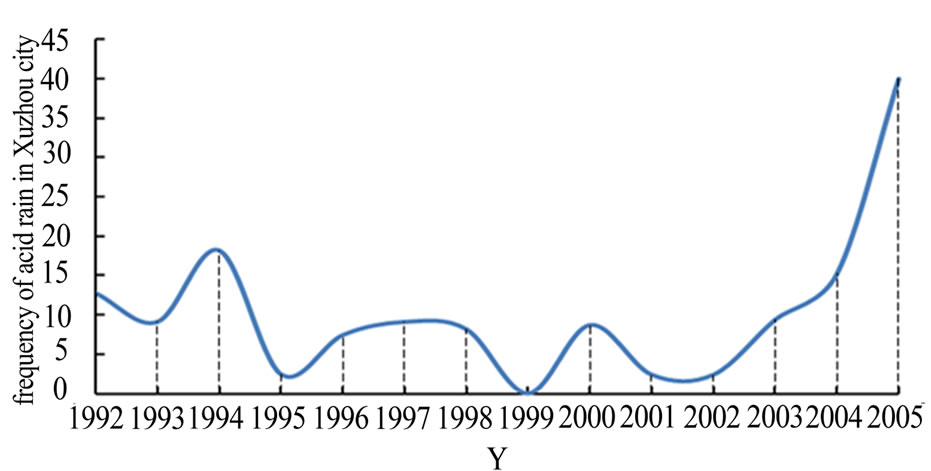
Figure 17. Frequency of acid rain in Xuzhou City, Jiangsu.
celerated increase in the recent years. Haze incidences are observed in all months, and all seasons. In general, however, there are more incidences in winter than in Summer. In terms of regional distribution, few incidences are observed in ANHR and ABHR-YR. Most of the incidences are reported in Southern Jiangsu, which is showing a significant trend of increase over the years, expanding the gaps with ANHR and ABHR-YR. Obviously, the fast increase in haze incidences has little to do with vegetation coverage. Instead, it is believed to have considerable connect with the fast growth of local economy and pollution and the deterioration of air pollution. Therefore, in Jiangsu, more researches should be conducted on the rules and causes of haze incidences, with a focus on possible prevention and treatment actions.
5. Acknowledgements
This work was funded by the National Special Research Fund for Public Welfare (Meteorology) of China (GYHY- 201006029) (Meteorological Key Technology for Aquaculture) and Jiangsu province Meteorological Scientific Research Open Fund (ZD201108) (Application of Meteorological Key Technology for Aquaculture).
REFERENCES
- H. J. Huang, H. N. Liu, W. M. Jiang, S. H. Huang and Y. Y. Zhang, “Source Apportionment Research of Atomospheric Particulate in Nanjing,” Scientia Meteorologica Sinica, Vol. 27, No. 2, 2007, pp. 162-168.
- F. Liu and S. J. Niu, “Optical Thickness and Size Distribution of Dust Aerosol Particles in Inner Mongolia,” Journal of Nanjing Institute of Meteorology, Vol. 29, No. 6, 2006, pp. 775-778.
- R. Y. Niu, Z. J. Zhou, Y. W. Liu and Y. Q. Yang, “Causes of Abnormal Decreasing of Dusty Weather in China during the Spring of 2003,” Climatic and Environmental Research, Vol. 9 , No. 1, 2004, pp. 24-33.
- J. Li, S. K. Zeng, C. S. Mu and C. G. Xu, “Analysis and Forecast of Dust Storms in Northwest of China,” Science Mosaic, Vol. 3, 2011, pp. 207-209.
- A. X. Dong, H. Z. Bai, D. G. Lu and J. Y. Feng, “Primary Study on Strong and Very Strong Dust Storm Trend in Hexi Passageway,” Plateau Meteorology, Vol. 22, No. 4, 2003, pp. 422-425.
- W. Wang, “Theoretic Analyses of Conceptual Model of East Asia Dust Storm Formation Mechanism,” Journal of Natural Disasters, Vol. 20, No. 2, 2011, pp. 14-19.
- Y. H. Li, “New Advances of Research on Sand-Dust Storm during Recent Years in China,” Journal of Desert Research, Vol. 24, No. 5, 2004, pp. 616-622.
- D. M. Miao, “Analysis on the Formation Reason of A Dusty Weather in the Middle West of Hulunbeier City,” Journal of Anhui Agricultural Sciences, Vol. 39, No. 12, 2011, pp. 7513-7515.
- China Meteorological Administration, “Specifications for Surface Meteorological Observation,” China Meteorological Press, Beijing, 2003, pp. 23-24.
- China Meteorological Administration, “Sand-Dust Weather Almanac,” China Meteorological Press, Beijing, 2005.
- X. L. Zhou, “Discussion on Some Terms Used for SandDust Weather in the National Standard,” Scientia Meteorologica Sinica, Vol. 30, No. 2, 2010, pp. 234-238.
- W. C. Malm, “Characteristics and Origins of Haze in the Continental United States,” Earth-Science Reviews, Vol. 33, No. 1, 1992, pp. 1-36. doi:10.1016/0012-8252(92)90064-Z
- B. Hachfeld and N. Jurgens, “Climate Patterns and Their Impact on the Vegetation in a Fog Driven Desert: The Central Namib Desert in Namibia,” Phytocoenologia, Vol. 30, No. 3-4, 2000, pp. 567-589.