Neuroscience & Medicine
Vol.4 No.2(2013), Article ID:32452,8 pages DOI:10.4236/nm.2013.42010
Electrocortical Activity Differences Related to Saccadic Movements between Bipolar Patients and Healthy Subjects
![]()
1Brain Mapping and Sensory Motor Integration, Institute of Psychiatry of the Federal University of Rio de Janeiro (IPUB/UFRJ), Rio de Janeiro, Brazil; 2Neurophysiology and Neuropsychology of Attention, Institute of Psychiatry of the Federal University of Rio de Janeiro (IPUB/UFRJ), Rio de Janeiro, Brazil; 3Institute of Applied Neuroscience (INA), Rio de Janeiro, Brazil; 4School of Physical Education, Bioscience Department (EEFD/UFRJ), Rio de Janeiro, Brazil; 5Federal Confederation of Volleyball, Rio de Janeiro, Brazil; 6Veiga de Almeida University, Rio de Janeiro, Brazil; 7Division of Neurosurgery, University of São Paulo Medical School, São Paulo, Brazil; 8Laboratory of Psychophysiology, Department of Psychology and Phonoaudiology, UMESP, São Paulo, Brazil; 9Panic & Respiration Laboratory, Institute of Psychiatry, Federal University of Rio de Janeiro, Rio de Janeiro, Brazil; 10National Institute of Translational Medicine (INCT-TM), Brazil; 11Anxiety & Depression Laboratory, Institute of Psychiatry of Federal University of Rio de Janeiro (IPUB/UFRJ), Rio de Janeiro, Brazil; 12Department of Medical Specialities, State University of Rio de Janeiro (UERJ), Rio de Janeiro, Brazil; 13Laboratory of Molecular Psychiatry, Bipolar Disorders Program and INCT Translational Medicine, Hospital de Clínicas de Porto Alegre, Universidade Federal do Rio Grande do Sul, Porto Alegre, Brazil; 14Biomedical Engineering Program, Universidade Federal do Rio de Janeiro, Rio de Janeiro, Brazil; 15Neuromuscular Research Laboratory, National Institute of Traumatology and Orthopedics (NITO), Rio de Janeiro, Brazil.
Email: *bruna_velasques@yahoo.com.br
Copyright © 2013 Washington Adolfo Batista et al. This is an open access article distributed under the Creative Commons Attribution License, which permits unrestricted use, distribution, and reproduction in any medium, provided the original work is properly cited.
Received March 17th, 2013; revised April 20th, 2013; accepted May 15th, 2013
Keywords: Sensorimotor Integration; Saccadic Movement; Attention; Bipolar Disease and Electroencephalography
ABSTRACT
Objective: The present study aimed to investigate and to compare the electrophysiological changes in bipolar patients and healthy subjects during the execution of a saccade task. Materials and Methods: The subjects had to respond to a fixed visual stimulus presented by a LEDs bar. We executed an ANOVA (one-way) and post hoc Scheffé test to examine the difference of absolute alpha power and reaction time among four groups: control, depression, manic and euthymic. We observed the frontal, parietal and occipital regions. The paired t test was realized on each electrode and group to compare the pre and post moment in the task. Results: We observed a statistical difference among the groups for the behavioral variable—saccade reaction time. For the electrophysiological variable—absolute alpha power, we did not find significant difference between the moments (pre and post stimulus presentation) for none of the electrodes of each bipolar group. However, the results pointed out to a difference between the moments for F3, P3, O1 and O2 electrodes for control group. Conclusion: We cannot affirm that the task influences the cortical activity of the patients. It is possible that the method used to analyze the data is not the adequate. The time-frequency analysis could be better to analyze the present data. We also observed that the absolute alpha power could be considered a marker of bipolar disorder, but not of the different states (i.e., mania, depression, euthymia).
1. Introduction
The saccadic movement is an important part of system integration between the environment subject and task, being widely used as a parameter cognitive [1-3]. Thus, the paradigm eye movements are tools to analyze the relationship between the brain, cognitive and behavioral aspects, leading to understanding the neurobiological basis of psychiatric disorders. As such, the oculomotor paradigms were used to characterize cognitive and sensorimotor disorders related to these disorders [4].
Abnormalities in the balconies can be seen in a variety of mental disorders [5], and provide a sensitive parameter for the analysis of some neuropsychiatric disorders [6]. Patients with bipolar disorder have alterations in cortical networks involved in visual spatial attention and saccadic movement pattern. This can be checked when the patient is exposed to tasks involving sensory stimuli which seek to assess attention, showing the existence of cognitive dysfunctions in all phases of bipolar disorder [7,8]. Therefore, it is necessary to understand the mechanisms linking saccades, the process carefully and electrophysiology to elucidate the pathophysiology and identify markers of some psychiatric disorders, especially bipolar disorder. Some studies highlight the characteristics and outcomes related to bipolar disorder [9-11]. Among these one can mention in that consistency range is shown as being a biomarker for cognitive dysfunction [12].
Thus, the present study is justified in adding to fill a gap in the production of research investigating the patterns of changes in electroencephalography during a saccade task in bipolar patients. Thus, a task that seeks to replicate the process associates aware of saccadic movement correlating the electrophysiological findings observed through the absolute power of the alpha band in different phases (i.e., euthymia, mania and depression) disorder. Therefore, this study aimed to investigate and compare changes electrocortical between healthy subjects and bipolar patients during the execution of the saccade task. Specifically, the experiment aims to determine if there are changes in absolute alpha power in frontal areas, parietal and occipital regions, these areas are related to attention and saccades, and also whether there are differences in electrocortical activity among subgroups (and bipolar patients different stages of the disease).
2. Materials and Methods
2.1. Subjects
The sample consisted of 41 right-handed individuals (11 men and 30 women), 12 controls and 29 bipolars (10 in depressive phase, 9 in euthymic phase and 10 in manic), aged between 25 and 40 years old (Mean: 33.6; sd: ± 7.06). The bipolar patients were diagnosed according to the criteria required by the Diagnostic and Statistical Manual of Mental Disorders Fourth Version (DSM-IV). All patients included in the bipolar group were outpatients of the Psychiatric Institute of the Federal University of Rio de Janeiro (IPUB/UFRJ). This group was diagnosed and is being accompanied and treated by psychiatrists of this institution. For characterization, inclusion and subsequent division of the patients in subgroups, the Clinical Global Impression Scale—Bipolar Version (CGI-BP) was administered. The subgroups were divided according to a CGI-BP score on the day of the experiment application. The groups were called euthymic group (EG), manic group (MG) and depressive group (DG) (Table 1). The mixed cases were excluded from the sample. The patients used medications for treatment of clinical conditions. Considering ethic questions, the patients did not stop using drugs to participate in the experiment.
The control group (CG) was composed by 12 subjects. The controls did not show any impairment of physical and mental health, they were healthy and did not use psychotropic or psychoactive substances. These controls were evaluated trough the anamnesis and physical examination. All participants signed a consent form in which were described, in details, the experiment objectives and experimental conditions. The experiment was approved by the ethics committee of the Psychiatric Institute of Federal University of Rio de Janeiro (IPUB/ UFRJ) (Number 81 Liv2-09).
2.2. Experimental Procedure
The task was performed in a sound and light attenuated room. Individuals sat on a comfortable chair with arm support to minimize muscular artifacts. Before starting the task, tests were applied to evaluate the attention level of the participants (Test of Divided Attention and D2 Test of Concentrated Attention). A bar composed by 30 Light emission diodes (LEDs) was placed and positioned at participant eye level. The bar was composed of 15 LEDs in the left side and 15 LEDs in the right side. The participants were at a distance of 100 cm from the bar.
The presentation of stimuli in the bar was controlled by a computer program. After the tests application, the participants received instructions to keep their eyes on the center of the bar and just dislocate their eyes from the moment they perceived the lighting of LEDs. The participants were also instructed to track with their eyes the lighting of LEDs, keeping their head static.
2.3. Task Procedures
The task consisted in goal-stimulus presentation, which alternated between the most extreme LEDs in the bar. This task is characterized by the predictability of the
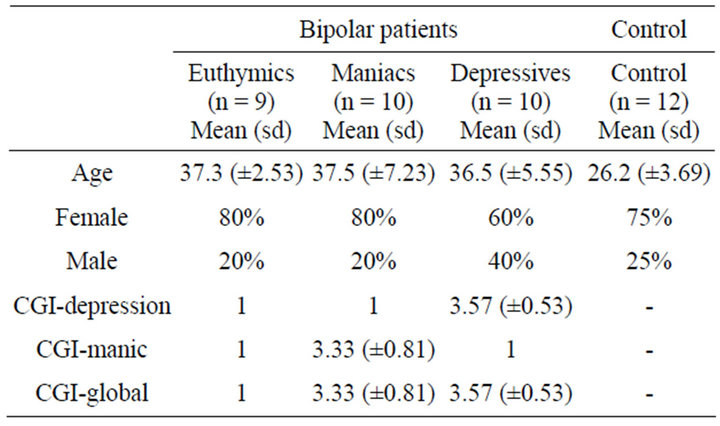
Table 1. Clinical and demographic features.
stimulus onset in time and space, thus directed by memory. The probability of the LED lighting from the extreme left or right is the same, with duration of 250 ms and interval at 2 s between lightings. Each participant realized 6 blocks (stimulus) and 2 rests (without stimulus), one before the onset of the task and another after the end. Each block consisted of 20 trials, 10 trials with lighting the LED in the bar right side and the 10 others with lighting in the bar left side, from the center.
2.4. Data Acquisition
In order to capture the electroencephalography signal Braintech 3000 device (Emsa—Medical Equipament, Brazil) was used, a system which utilizes an analogicaldigital (A/D) converter with 20 channels. A program, produced by Brain Mapping and Sensory Motor Integration Lab, was used for the acquisition of electroencephalography signal. The EEG signal was amplified with a gain of 22.000, analogically filtered between 0.3 Hz (high-pass) and 25 Hz (low-pass) and digitalized with a sampling rate of 200 Hz. A digital 60 Hz notch filter was employed.
The international 10/20 EEG electrode system was used to put the 20 electrodes on the scalp (areas: prefrontal, frontal, central, temporal, parietal and occipital) and an electrode on each ear (lobe). The earlobes were used as reference. The impedance of each electrode was maintained between 5 - 10 Ω. The total amplitude (peak to peak) was less than 70 µV.
2.5. Saccadic Eye Movement Acquisition
In order to record the oculogram we used two electrodes with 9 mm in diameter mounted in a bipolar way. The electrodes were arranged horizontally from the outer canthi of both eyes to determine the horizontal EOG (hEOG) and vertically above both eyes to determine the vertical EOG (vEOG). The saccadic movements were inspected through a program in Matlab language, developed in our laboratory. Parts of the signal contaminated by artifacts were eliminated in two phases: 1—Parts that exceeded the threshold of 70 µV (automatic rejection of artifacts) and 2—visual inspection for the removal of the trials most affected by artifacts.
The EEG parts were cut between 500 milliseconds before and after the presentation of the goal-stimulus (LEDs). The EOG record program used a 60 Hz Notch filter. The impedance levels of each electrode were maintained below 5 KΩ.
2.6. Data Processing and Analysis
The parts with rude artifacts were eliminated through the visual inspection. Aimed not to lose more trials, independent component analysis (ICA) was then applied to identify and remove remaining artifacts, particularly visual and fine muscular artifacts. After removal of independent components related to the artifacts, the remaining components were reinserted to restore the electrode signal. Only the reminiscent epochs took part in the subsequent processing of signal and statistical analysis.
2.7. Selection of Frequency
The alpha band (8 - 12 Hz) was chosen for analysis due to its correlation with attention mechanisms. Hypothetically, this band has an important role in adjusting the sensory areas related because of perception [10,11]. This frequency is related to visual processing and is inversely proportional to the population of pyramidal neurons involved in the task (perceptual, cognitive and motor) [12]. The decrease of this power is also related to sensory stimulation and mental activity, such as activities that involve attention [13].
2.8. Statitical Analysis
An ANOVA one-way and post hoc Scheffé was employed for comparison of absolute alpha power between the groups (control, depressive, euthymic, and manic). The independent t test was utilized to analyze the difference between age ranges. A paired t test was also applied for different groups in each electrode, allowing the comparison between the pre and post moment.
3. Results
A t test was realized for independent groups for a comparison between age ranges of CG and bipolar patients (mean = 26.2; sd = ±3.69 and mean = 37.1; sd = ±5.39, respectively). A significant statistical difference between groups was observed (p < 0.001), however it is important to emphasize, in literature reports that it doesn’t exist any difference in electrocortical activity (alpha band) between age ranges analyzed in the experiment [14-16].
In order to determine electrophysiological changes resulting from the task, we applied the paired t test in each group, for the different electrodes analyzed (pre task vs. post task). A significant statistical difference in CG was observed for electrodes P3 (p < 0.001), O1 (p < 0.001), F3 (p < 0.001) and O2 (p < 0.001). The results indicate lower absolute alpha power in pre moment, when compared with post moment. On the other hand, in the bipolar subgroups (MG, DG and EG), we did not observe statically significant difference in paired t test (p > 0.05), with exception of the MG, at P4 electrode, that presented a significant result between moments (p = 0.034). However, the absolute alpha power was greater in pre moment when compared with post moment. The behavioral data already published elsewhere [17].
An ANOVA one-way and a post hoc Scheffé were used in the data equivalent to the post-task execution moment for each electrode. This analysis was realized to verify whether the groups presented differences between them. The analysis appointed to statistically significant differences between CG and bipolar group (p < 0.001), all electrodes analyzed. The CG presented a greater absolute alpha power, when compared to DG, EG and MG. On the other hand, the bipolar patients did not differ statistically.
At F3 electrode (left frontal cortex), we found a greater absolute alpha power in CG, when compared with other groups (F = 386.473; p < 0.001). The post hoc analysis pointed out that the CG and EG presented differences from the other groups, although DG and MG showed no significant difference when compared between them (Figure 1(a)).
 (a)
(a)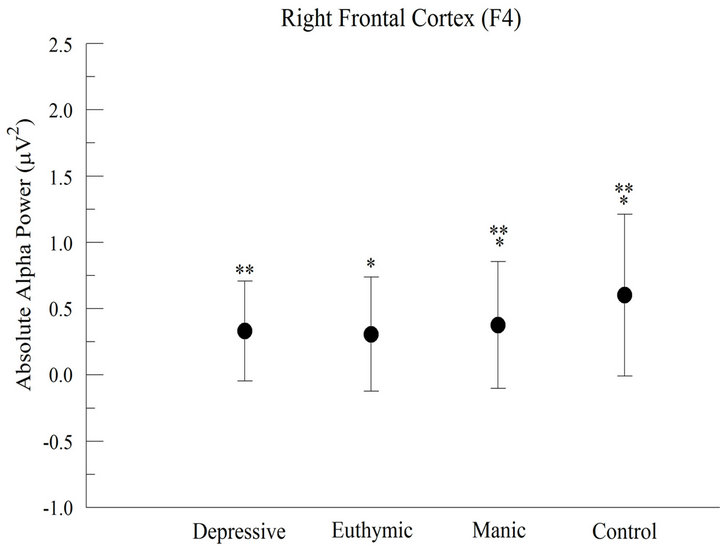 (b)
(b)
Figure 1. Absolute alpha power in the frontal cortex (a) For the left frontal cortex (F3), the results demonstrated significant difference between groups (p < 0.001); (b) For the right frontal cortex (F4), the results showed significant difference between groups (p < 0.001).
At F4 electrode (Right frontal cortex), we observed a significant difference between groups (F = 288.031; p < 0.001), with a greater alpha absolute power for CG. The post hoc analysis demonstrated that the CG is different from the others. On the other hand, EG and DG did not differ between them (Figure 1(b)).
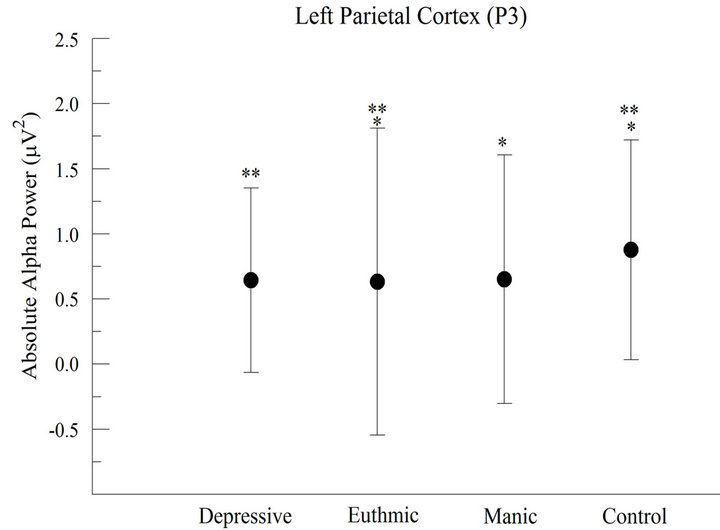
At P3 electrode (Left parietal cortex), a significant difference between groups was found (F = 55.417; p < 0.001). We verified a greater absolute alpha power in CG when compared with other groups and, also, lower absolute alpha power in EG. The post hoc application showed differences between CG and other groups. On the other hand, it was not found any difference between DG and MG (Figure 2(a)).
At P4 electrode (right parietal cortex), we also verified a significant difference between groups (F = 189.555; p < 0.001) and we observed a greater alpha power in CG. The post hoc analysis indicated that the CG differed from the others, but no difference was observed between the MG and EG (Figure 2(b)).
 (a)
(a)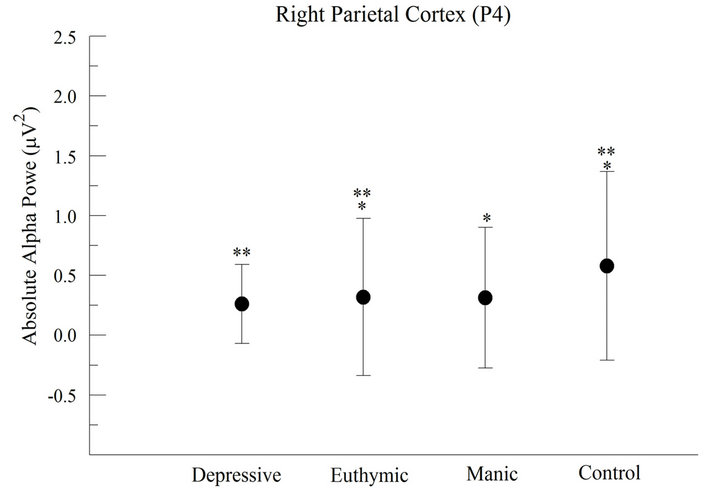 (b)
(b)
Figure 2. Absolute alpha power in the parietal cortex (a) For the left parietal cortex (P3), the results demonstrated significant difference between groups (p < 0.001); (b) For the right parietal cortex (P4), the results appointed significant difference between groups (p < 0.001).
At O1 electrode (left occipital cortex), we observed a significant difference between groups (F = 218.169; p < 0.001) and we verified a greater absolute alpha power in CG (Figure 3(a)). The post hoc analysis indicated that the CG differed from the others. On the other hand, no difference was found between DG and MG.
At O2 electrode (right occipital cortex), we observed a difference between groups (F = 313.748; p < 0.001), with greater absolute alpha power in CG when compared with other groups (Figure 3(b)). The post hoc indicated that the CG differed from other groups. On the other hand, no difference was found between DG and MG.
4. Discussion
The hypothesis in our study is that the saccadic movements produce changes in the absolute alpha power
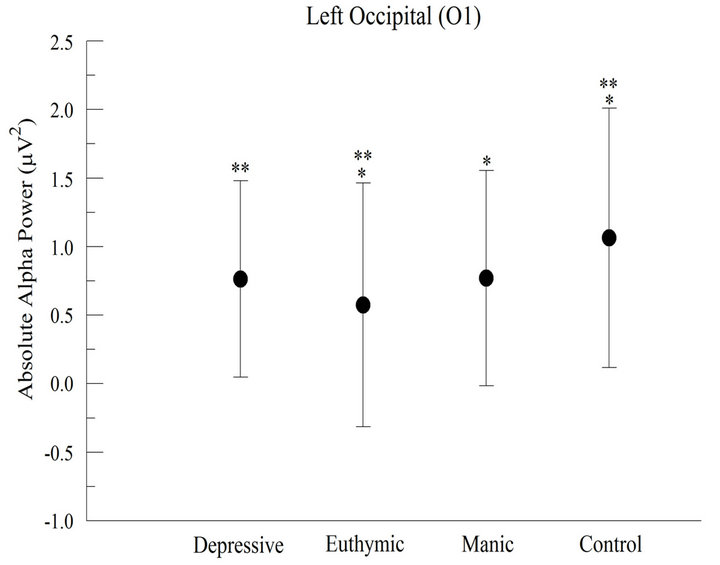 (a)
(a)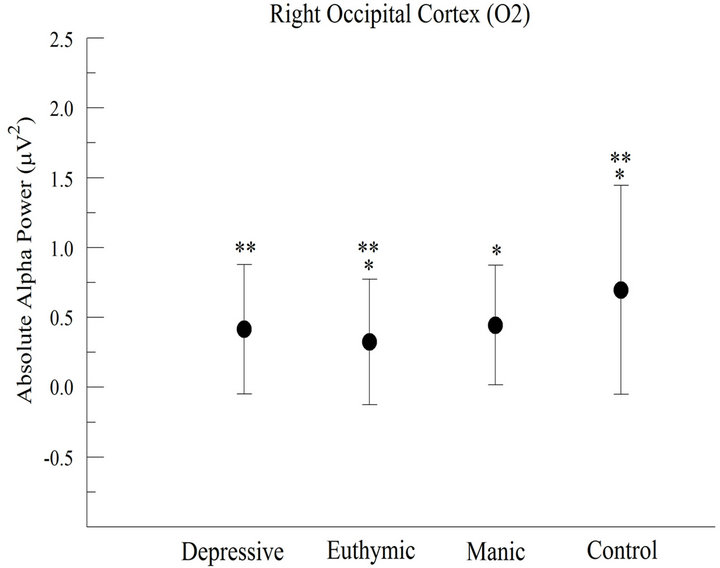 (b)
(b)
Figure 3. Absolute alpha power in the occipital cortex (a) For the left occipital cortex (O1), the results appointed significant difference between groups (p > 0.001); (b) For the right occipital cortex (O2), the results appointed significant difference between groups (p < 0.001).
in frontal, parietal and occipital areas, in different groups (healthy subjects and bipolar patients). Thereby, the discussion approached changes in absolute alpha power, task result, in different groups and cortical regions.
The paired t test comparing the pre task and post task moments for each electrode and each group, separately, appointed to the fact that the task did not cause significant electrophysiological changes in the bipolar group, but the changes were significant in the CG. This result seems consistent with the fact that bipolar patients present attentive deficits [18], not showing enough engagement in task execution.
A recent study indicated changes in connectivity between different encephalic areas in bipolar patients who, when submitted to the task that demanded concentration, presented failures in attention [8]. Furthermore, bipolar patients also have difficulties in attention maintenance and a slower information processing [8,18].
The electrophysiological changes verified at F3, P3, O1 and O2 electrodes in CG seem to have been caused by the task, suggesting a greater participation of the left hemisphere in saccades execution in healthy subjects. Authors have reported that the left cerebral hemisphere is involved in preparation and execution of voluntary saccadic movement, and it is also responsible for the attention involved in visuomotor processes [19-21]. It is worth noting the significant result of the comparison between pre and post task for occipital cortex (right and left), because the occipital cortex is a primary visual area, independently from the hemispheric laterality. So, it seems that these occipital areas (right and left) are globally connected to the task, knowing that such areas are based on the identification of the visual stimuli in the environment.
Studies indicate that the occipital cortex is responsible for processing visual information, being responsible for the first stage of information processing: the stimulus identification and the information flow regulation received at the beginning of this stage [22]. This brain region plays an important role in generating and directing ocular movements and organizing information from the retina [23].
A significant result was observed for CG, where absolute alpha power increased in the post moment. This finding can be possibly justified by a greater neuronal synchronization in these areas, when the attention directs itself to a relevant stimulus; in the other words, there is an activity increase in these regions when the subject realizes a spatial selection of a goal, for posterior processing [24].
Observing the qualitative analysis in the time and frequency domain we identified discrimination between groups, in the fixed saccadic movement task, as we shown in the Figures 4 and 5. We detect trends of elec-

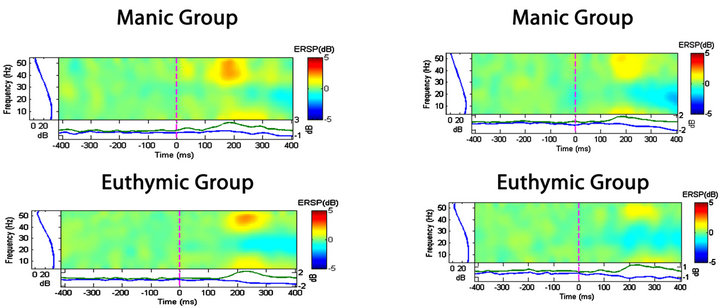
Figure 4. Spectral perturbation at the P3 and P4 electrodes. The qualitative comparison shows that the electrode activity during the saccadic task is different among groups.
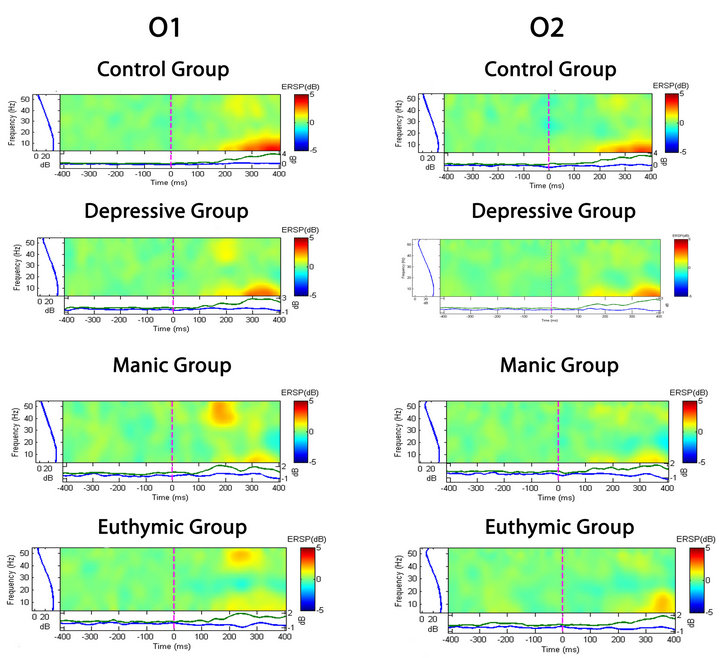
Figure 5. Spectral perturbation at the O1 and O2 electrodes. The qualitative comparison shows that the electrode activity during the saccadic task is different among groups.
trophysiological changes between pre and post moments in different groups. Considering the absolute power, the ANOVA one-way with post hoc Scheffé appointed to a statistically significant difference between the CG and bipolar group as a whole, in all electrodes analyzed, on the other hand, the bipolar patients did not differ statisticcally between them. Thus, it is possible to formulate the hypothesis that the difference of absolute alpha power between healthy subjects and bipolar patients, but not among bipolar, may be a trait marker and not a phase indicator, for them.
5. Conclusions
Our results indicate that the saccadic task did not cause significant electrophysiological changes in absolute alpha power of the bipolar patients; this fact may be explained by failures in neural mechanisms responsible for attention. On the other hand, for CG we verified an increase in absolute alpha power possibly arising from the saccadic movement, in the post task moment, when compared with the pre task moment. Significant results were found in electrodes at left hemisphere (F3, P3) and, also, in electrodes at occipital cortex (O1, O2), therefore it is plausible to assume a more specific participation of the left hemisphere in the proposed task (saccadic movement). Our results appoint to electrophysiological differences between two groups in study (control and bipolar), particularly, due to the fact that the bipolar subgroups did not present any difference in absolute alpha power between the pre and post task moment, being this difference observed only in the CG.
According to previous explanation, these findings may result from impairment in the neural substrate (Mechanisms responsible for attention) in individuals with bipolar disorder, independently from the phase where they are. Therefore, this result suggests that absolute alpha power is a marker of the disorder’s trait and not of the disorder’s state. Although our results present interest for the knowledge of bipolar disorder, we make exceptions as to the limitations presented by the study, such as the failure to control psychoactive medicines. The few existing studies about electroencephalographic patterns in bipolar patients, during the execution of the saccadic movements, demonstrate the need to improve the experimental paradigm, as well as the analysis methods used. Moreover, these few studies indicate conflicting results, which necessarily, should be investigated in future researches.
REFERENCES
- F. Jagla, M. Jergelová and I. Riecansky, “Saccadic Eye Movement Related Potentials,” Physiological Research, Vol. 56, 2007, pp. 707-713.
- S. B. Hutton, “Cognitive Control of Saccadic Eye Movements,” Brain and Cognition, Vol. 68, No. 3, 2008, pp. 327-340. doi:10.1016/j.bandc.2008.08.021
- G. K. Thaker, “Neurophysiological Endophenotypes across Bipolar and Schizophrenia Psychosis,” Schizophrenia Bulletin, Vol. 34, No. 4, 2008, pp. 760-773. doi:10.1093/schbul/sbn049
- M. S. Harris, J. L. Reilly, M. E. Thase, M. S. Keshavan and J. A. Sweeney, “Response Suppression Deficits in Treatment-Naïve First-Episode Patients with Schizophrenia, Psychotic Bipolar Disorder and Psychotic Major Depression,” Psychiatry Research, Vol. 170, No. 2, 2009, pp. 150-156. doi:10.1016/j.psychres.2008.10.031
- M. J. Thurtell, R. L. Tomsak and R. J. Leigh, “Disorders of Saccades,” Current Neurology and Neuroscience Reports, Vol. 7, No. 5, 2007, pp. 407-416. doi:10.1007/s11910-007-0063-x
- B. Luna, K. Velanova and C. F. Geier, “Development of Eye-Movement Control,” Brain and Cognition, Vol. 68, No. 3, 2008, pp. 293-308. doi:10.1016/j.bandc.2008.08.019
- C. Cartier, J. Bittencourt, C. Peressutti, S. Machado, F. Paes, A. T. Sack, L. F. Basile, S. Teixeira, J. I. Salles, A. E. Nardi, M. Cagy, R. Piedade, O. Arias-Carrión, B. Velasques and P. Ribeiro, “Premotor and Occipital Theta Asymmetries as Discriminators of Memoryand Stimulus-Guided Tasks,” Brain Research Bulletin, Vol. 87, No. 1, 2012, pp. 103-108. doi:10.1016/j.brainresbull.2011.10.013
- A. Özerdem, B. Güntekin, I. Atagün, B. Turp and E. Ba- şar, “Reduced Long Distance Gamma (28/48 Hz) Coherence in Euthymic Patients with Bipolar Disorder,” Journal of Affective Disorders, Vol. 132, No. 3, 2011, pp. 325-332. doi:10.1016/j.jad.2011.02.028
- R. Oldfield, “The Assessment and Analysis of Handedness: The Edinburgh Inventory,” Neuropsychologia, Vol. 9, No. 1, 1971, pp. 97-113. doi:10.1016/0028-3932(71)90067-4
- T. Ergenoglu, T. Demiralp, Z. Bayraktaroglu, M. Ergen, H. Beydagi and Y. Uresin, “Alpha Rhythm of the EEG Modulates Visual Detection Performance in Humans,” Cognitive Brain Research, Vol. 20, No. 3, 2004, pp. 376- 383. doi:10.1016/j.cogbrainres.2004.03.009
- T. A. Rihs, C. M. Michel and G. Thut, “Mechanisms of Selective Inhibition in Visual Spatial Attention Are Indexed by Alpha-Band EEG Synchronization,” European Journal of Neuroscience, Vol. 25, No. 2, 2007, pp. 603- 610. doi:10.1111/j.1460-9568.2007.05278.x
- W. Szurhaj, P. Derambure, E. Labyt, F. Cassim, J. Bourriez, J. Isnard, J. D. Guieu and F. Mauquière, “Basic Mechanisms of Central Rhythms Reactivity to Preparation and Execution of a Voluntary Movement: A Stereoelectroencephalographic Study,” Clinical Neurophysiology, Vol. 114, No. 1, 2003, pp. 107-119. doi:10.1016/S1388-2457(02)00333-4
- S. Haegens, B. F. Handel and O. Jensen, “Top-Down Controlled Alpha Band Activity in Somatosensory Areas Determines Behavioral Performance in a Discrimination Task,” The Journal of Neuroscience, Vol. 31, No. 14, 2011, pp. 5197-5204. doi:10.1523/JNEUROSCI.5199-10.2011
- R. Anghinah, P. Caramelli, D. Y. Takahashi, R. Nitrini and K. Sameshima, “Estudo da Coerência do Eletroencefalograma na Banda de Frequência Alfa em Indivíduos Adultos Normais. Resultados Preliminares em 10 Casos,” Arquivos de Neuro-Psiquiatria, Vol. 63, No. 1, 2005, pp. 83-86. doi:10.1590/S0004-282X2005000100015
- E. Niedermeyer and F. Silva, “Electroencephalography: Basic Principles, Clinical Applications and Related Fields,” Urban & Schwarzenberg, Baltimore, 2005.
- L. Lorenzo-López, E. Amenedo, R. D. Pascual-Marqui and F. Cadaveira, “Neural Correlates of Age-Related Visual Search Decline: A Combined ERP and sLORETA Study,” Neuroimage, Vol. 41, No. 511, 2008, p. 24.
- B. Velasques, J. Bittencourt, C. Diniz, et al., “Changes in Saccadic Eye Movement (SEM) and Quantitative EEG Parameter in Bipolar Patients,” Journal of Affective Disorders, Vol. 145, No. 3, 2012, pp. 378-385. doi:10.1016/j.jad.2012.04.049
- E. Bora, M. Yucel and C. Pantelis, “Cognitive Endophenotypes of Bipolar Disorder: A Meta-Analysis of Neuropsychological Deficits in Euthymic Patients and Their First-Degree Relatives,” Journal of Affective Disorders, Vol. 113, No. 1, 2009, pp. 1-20. doi:10.1016/j.jad.2008.06.009
- C. Pierrot-Deseilligny, R. M. Müri, T. Nyffeler and D. Milea, “The Role of the Human Dorsal Lateral Prefrontal Cortex in Ocular Motor Behavior,” Annals of the New York Academy of Science, Vol. 1039, 2005, pp. 239-251. doi:10.1196/annals.1325.023
- Z. Kapoula, Q. Yang, O. Coubard, G. Daunys and C. Orssaud, “Role of the Posterior Parietal Cortex in the Initiation of Saccades and Vergence: Right/Left Functional Asymmetry,” Annals of the New York Academy of Science, Vol. 1039, 2005, pp. 184-197. doi:10.1196/annals.1325.018
- L. S. Simó, C. M. Krisky and J. A. Sweeney, “Functional Neuroanatomy of Anticipatory Behavior: Dissociation between Sensory-Driven and Memory-Driven Systems,” Cerebral Cortex, Vol. 15, No. 12, 2005, pp. 1982-1991. doi:10.1093/cercor/bhi073
- V. Romei, J. Gross and G. Thut, “On the Role of Prestimulus Alpha Rhythms over Occipitoparietal Areas in Visual Input Regulation: Correlation or Causation?” The Journal of Neuroscience, Vol. 30, No. 25, 2010, pp. 8692- 8697. doi:10.1523/JNEUROSCI.0160-10.2010
- S. B. Merriam, R. S. Caffarella and L. M. Baumgartner, “Learning in Adulthood,” 3rd Edition, John Wiley & Sons, San Francisco, 2007.
- S. E. Bouvier, “Top-Down Influences of Spatial Attention in Visual Cortex,” The Journal of Neuroscience, Vol. 29, No. 6, 2009, pp. 1597-1598. doi:10.1523/JNEUROSCI.5611-08.2009
NOTES
*Corresponding author.