American Journal of Climate Change
Vol.2 No.4(2013), Article ID:40453,12 pages DOI:10.4236/ajcc.2013.24023
Assessing the Presence or Absence of Climate Change Signatures in the Odzi Sub-Catchment of Zimbabwe
1Faculty of Agriculture and Natural Sciences, Great Zimbabwe University, Masvingo, Zimbabwe
2Shared Watercourses Support Project between Zimbabwe and South Africa, Masvingo, Zimbabwe
Email: elijahnyoni@yahoo.com
Copyright © 2013 Kosamu Nyoni et al. This is an open access article distributed under the Creative Commons Attribution License, which permits unrestricted use, distribution, and reproduction in any medium, provided the original work is properly cited.
Received July 3, 2013; revised August 5, 2013; accepted September 2, 2013
Keywords: Climate Change; Trend Analysis; Sustainable Development; Human Activities; Mann Kendall; Terrestrial Carbon Sequestration
ABSTRACT
Climate change and potential adverse impacts on water availability for the purposes of sustaining competing demand uses are causes of concern among water resources managers. This study focused on assessing rainfall and runoff data of a micro catchment in Save’s Odzi sub-catchment to determine if any trends existed and how far the results indicated climate change. The study had four rainfall stations (Rusape, Nyanga, Mukandi and Odzi Police Rail) and five runoff stations (E32, E72, E73, E127 and E129). Mann Kendall’s test was applied for determining trends in the two variables. The results obtained do not point to climate change. This study recommended that issues of current land use patterns and water abstractions be thoroughly understood for the area under study. It also recommended that techniques which promote terrestrial carbon sequestration should be introduced in the micro catchment.
1. Introduction
Climate change according to IPCC usage refers to any change in climate over time, whether due to natural variability or as a result of human activity [1,2]. IPCC [3] contended that climate change is a serious and urgent issue since the earth’s climate is changing, and the scientific consensus is not only that unsustainable human activities have contributed to it significantly, but that the change is far more rapid and dangerous than thought earlier. Human existence is becoming more and more threatened. [4] argues that sustainable agricultural production will decrease as a result of climate change. [5] argue that climate change induced reductions in rainfall amount and raised temperature will lead to reduced runoff and increased water stress. This will disrupt water dependent activities including those on which livelihoods and food security are based. Climate change tends to significantly affect sustainable development. [3] point out that justified pleas have been made to address climate change from a sustainable development viewpoint.
Over the past three decades, there have been several studies addressing the issue of climate change both globally and regionally [6-19]. These studies attributed extreme changes to increased global mean temperatures (caused by increased green-house gases), population increase and changing land use, thus causing increased frequencies and severity of droughts and floods. They also dealt with effects of changes in temperature and precipitation on mean monthly, seasonal or annual runoff [20]. This was mainly done through trend analysis. In some instances, significant trends pointing to existence of climate change were reported [16,21-23]. These studies dealt with trend analysis of temperature, rainfall and runoff at regional, national or basin level.
This current study assessed the presence or absence of climate change signatures through trend analysis of rainfall and runoff data for a micro catchment of the Odzi sub catchment. Micro catchment study tends to reduce the size of area of focus. Impacts of climate change vary depending on the geographical location of the study area [3]. This study is not going to deal with trend detection in temperature as studies by [18,22], proved that variations in flow from year to year are much more strongly related to precipitation changes than to temperature changes. Studies by [24-26] also predicted that changes in rainfall have significantly greater impacts on stream flow than predicted changes in temperature.
2. Overview of Some Previous Trend Detection Studies
[11] asserted that detection of changes in long time series of hydrological data is an important scientific issue: It is necessary if we are to establish the true effect of climate change on our hydrological systems, and it is fundamental for planning of future water resources and flood protection. This will answer the question of sustainability in water resources planning and development. The process of river flow has been directly influenced by changes caused by man (e.g. land-use changes: urbanization, deforestation, changes in agricultural practices, and engineering works: drainage systems, dam construction and river regulation).
Many studies have shown a trend that runoff tends to increase with increase in precipitation and decrease with decrease in precipitation, depending on availability of data [2]. [27] analyzed time series of discharge in four rivers in Germany. After having smoothed the year-toyear oscillation of annual peak discharge, he found a marked recent increase in the amplitude of floods. He also compared floods of different recurrence intervals for two consecutive sub periods. The 100-year flood determined from the older data in the first sub-period corresponds to much lower return periods (between 5 and 30- year-flood) for the more recent data. Large flows are therefore becoming more frequent. However, no spacecovering study placing these results in a truly regional perspective has been available yet.
[28] analyzed the flood trend in Austria. They considered different periods of observation (40 year interval: 1952-1991 and parts thereof). Only in a portion of cases, a significant trend was detected. The quantitative results depended on the sub-period and the characteristics studied (whether annual maxima, or number of floods per year, or partial duration series). The portion of cases for which a significant trend was detected ranged from 4.3% to 31.5%. Among those cases where a significant trend was detected; there were more examples of positive trend (64.3%) than of negative trend (35.7%). Analysis of the full 40 year period resulted in detecting a positive trend in 66.3% of the cases with significant trend. [23] investigated the impact of climate change on the temporal and spatial distribution of precipitation, temperature, evapotranspiration and surface runoff in the Volta Basin (400,000 km2) of West Africa. Trend analysis showed clearly positive trends with high level of significance for temperature time series. Precipitation time series showed both positive and negative trends, although most significant trends were negative. In the case of river dischargea small number of (mostly positive) significant trends for the wet season were observed.
The study also by [16] concluded that significant changes in the river flow regimes in Southern Africa were identified in the 1970s through early 1980s. These changes led to decrease in river flows in western Zambia, Namibia and northeast South Africa considerably affecting the flows during the high flow months in which 34% - 80% of annual flow volumes are observed. [29] described the development and application of a procedure that identifies trends in the hydrological variables. The non-parametric Mann-Kendall (MK) statistic test to detect trends was applied to assess the significance of the trends in the time series. Different parts of the hydrologic cycle were studied through 15 hydrologic variables, which were analysed for a network of Upper Mazowe catchment. The distribution of the significant trends indicated that monthly flows significantly decreased with the exception of the month of September for the less than 30 years series. The field significance of trends was evaluated by the bootstrap test at the significance level of 0.05 and none of the two flow regimes expressed field significant changes.
[21] ran three transient climate change experiments which showed a significant warming in all seasons that is most pronounced in September-November. Precipitation was predicted to decrease during June-November on the continental scale while simulated changes in DecemberMay were found to be small. The experiment ran scenarios of Pungwe basin rainfall for the 1991-2020, and 2021-2050 periods compared to the 1961-1990 period and these indicated that approximately 10% reduction of annual runoff, with no significant variability between sub-basins was expected. The results also showed that a slight decrease of rainfall for 2021-2050, compared to the 1991-2020 was also expected.
The current study intended to add to the already existing knowledge on climate change and adaptation in Zimbabwe. Such studies are important for Zimbabwe as it was reported that the worst impacts of climate change would fall on developing countries (of which Zimbabwe is one of them), in part because of their geographical location, in part because of weak coping capacities, and in part because of more vulnerable social, institutional and physical infrastructures [3].
3. Study Area
The Odzi sub catchment is shown in Figure 1. Figure 2 shows the micro catchment of the Odzi sub catchment. Area description in terms of climate, hydrology, land use, population, physiography and possible impacts of climate change in study area shall be presented.
The Odzi sub catchment studied is found in the eastern mountainous areas of Zimbabwe (Figure 1). Odzi River
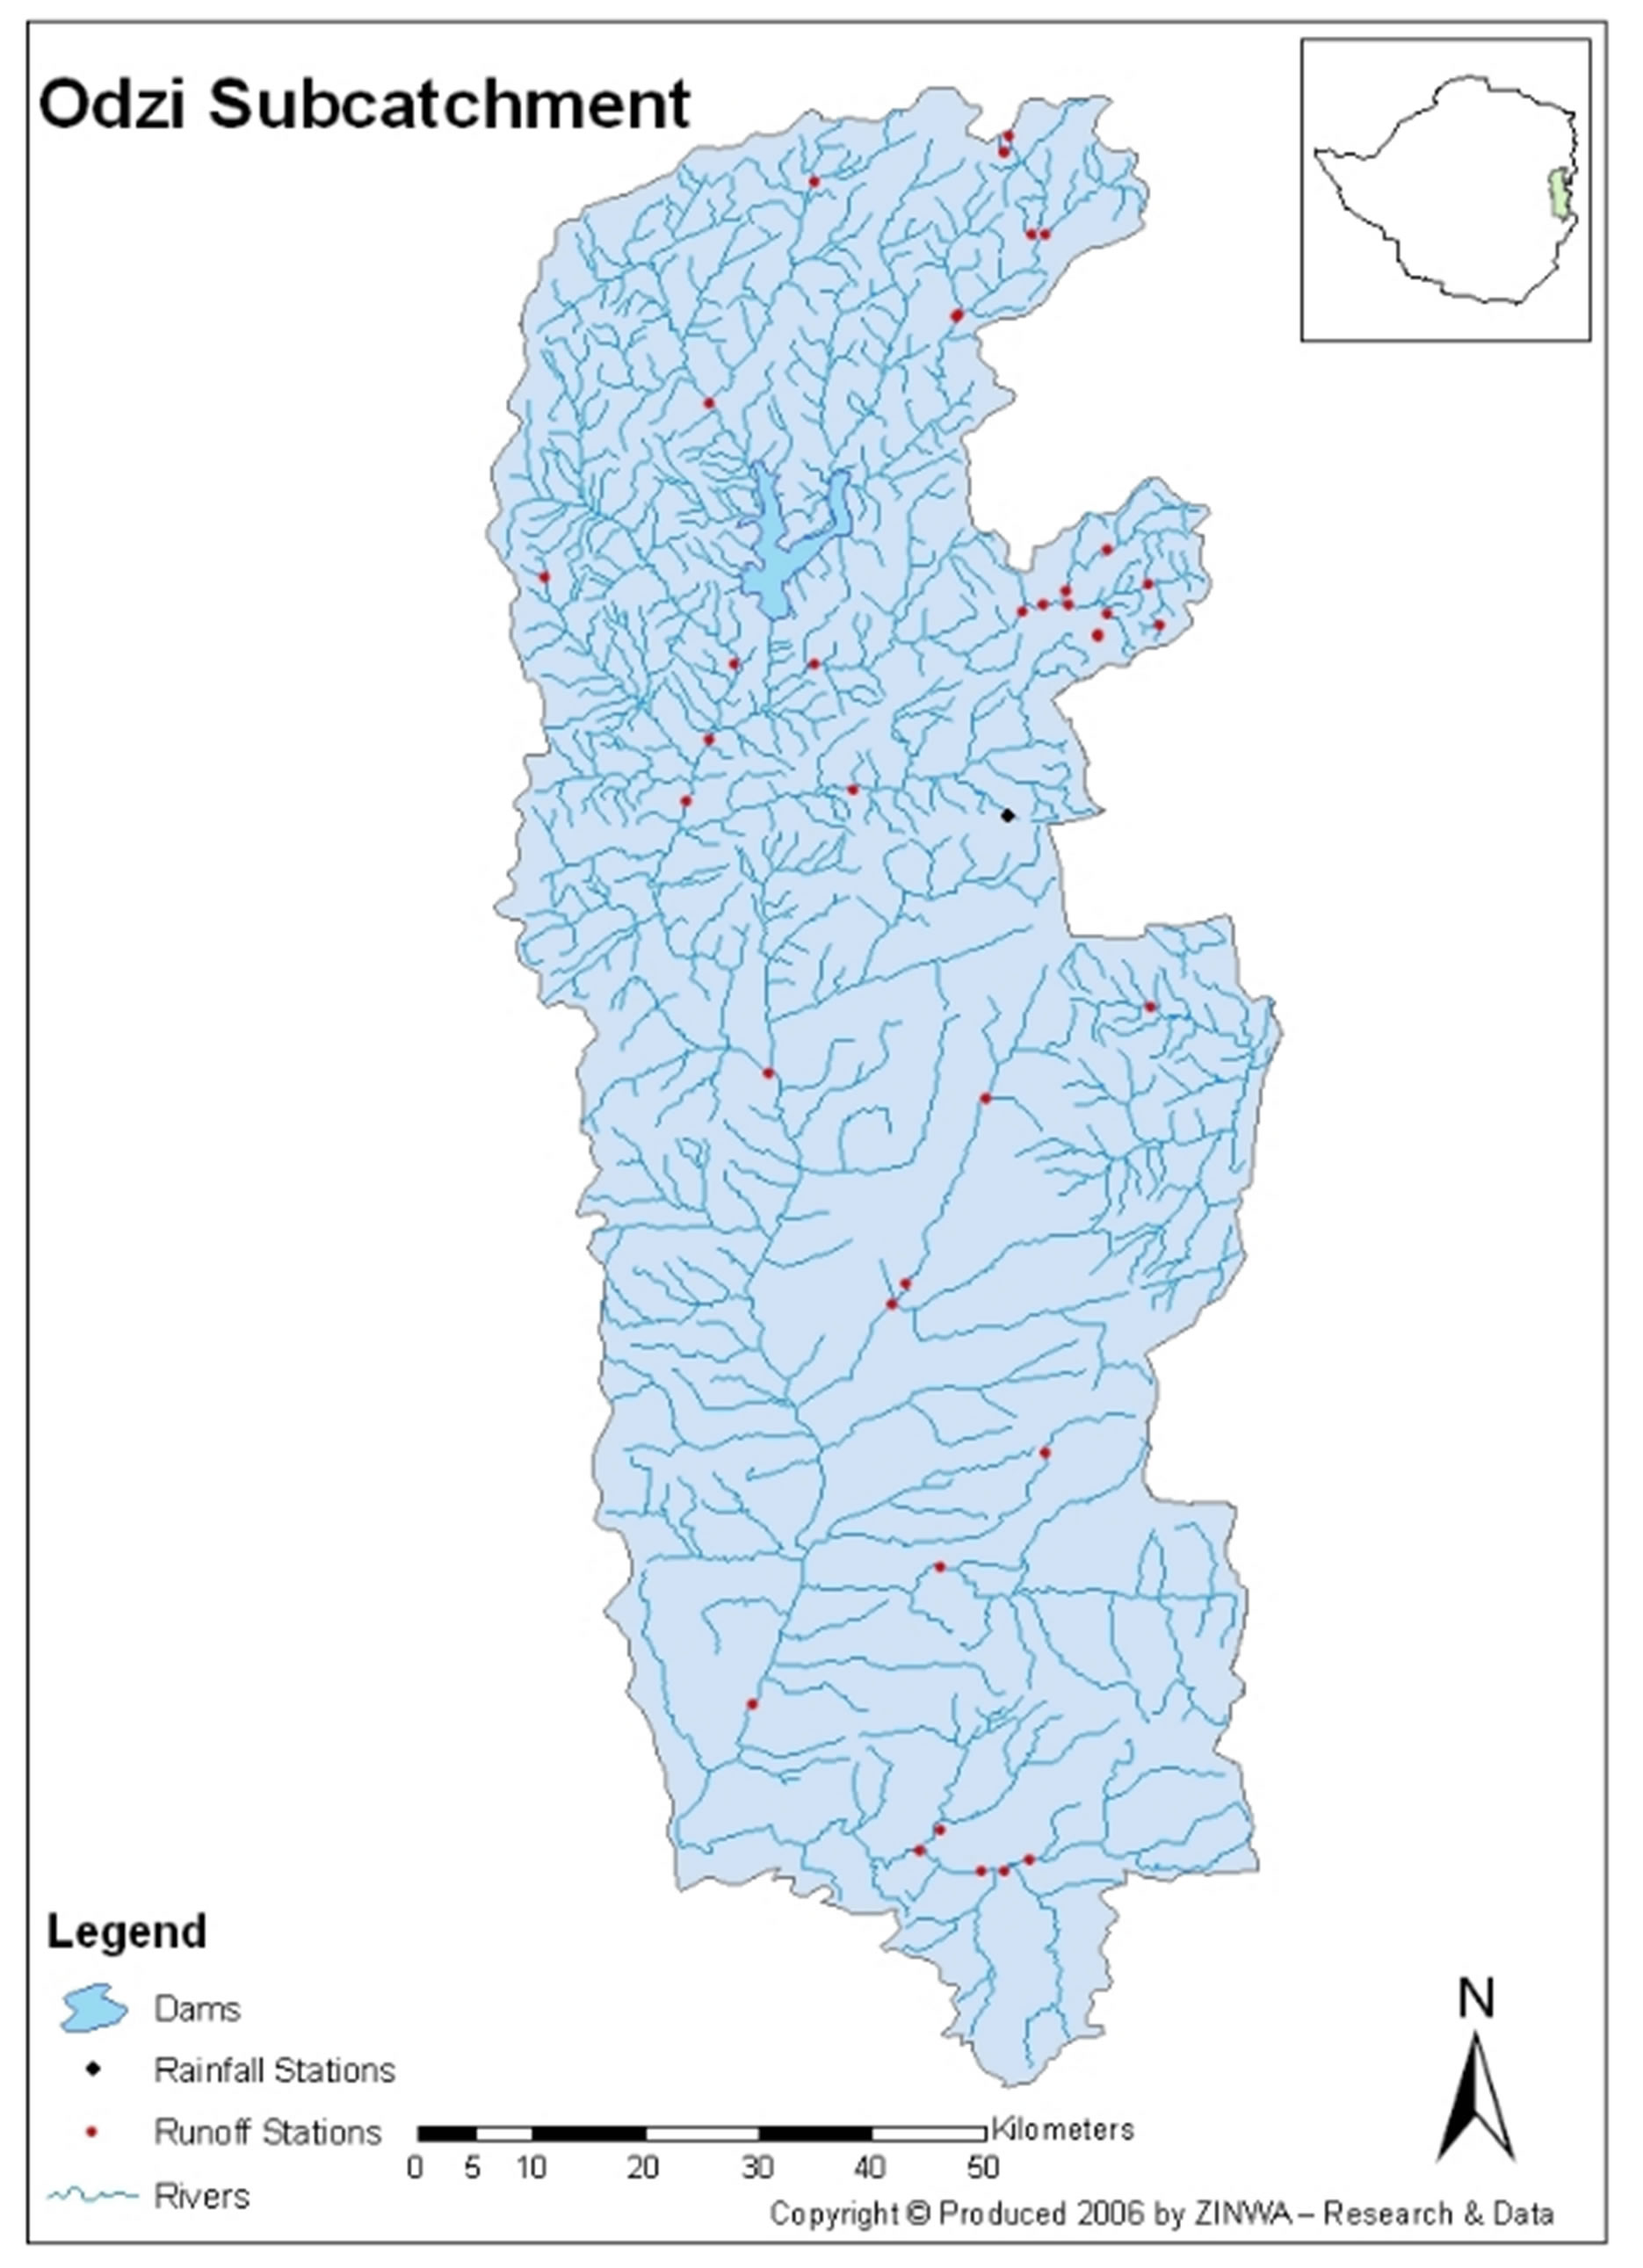
Figure 1. Map showing Odzi Sub catchment.
is the main river in this sub-catchment. It is a perennial river that rises in the Eastern Highlands and flows to the south before feeding the Save River. Total catchment area is 2486 km2; altitude difference is large, 950 to 2160 m a.s.l [30]. However this study shall focus on the upper sections of the sub catchment, as shown in Figure
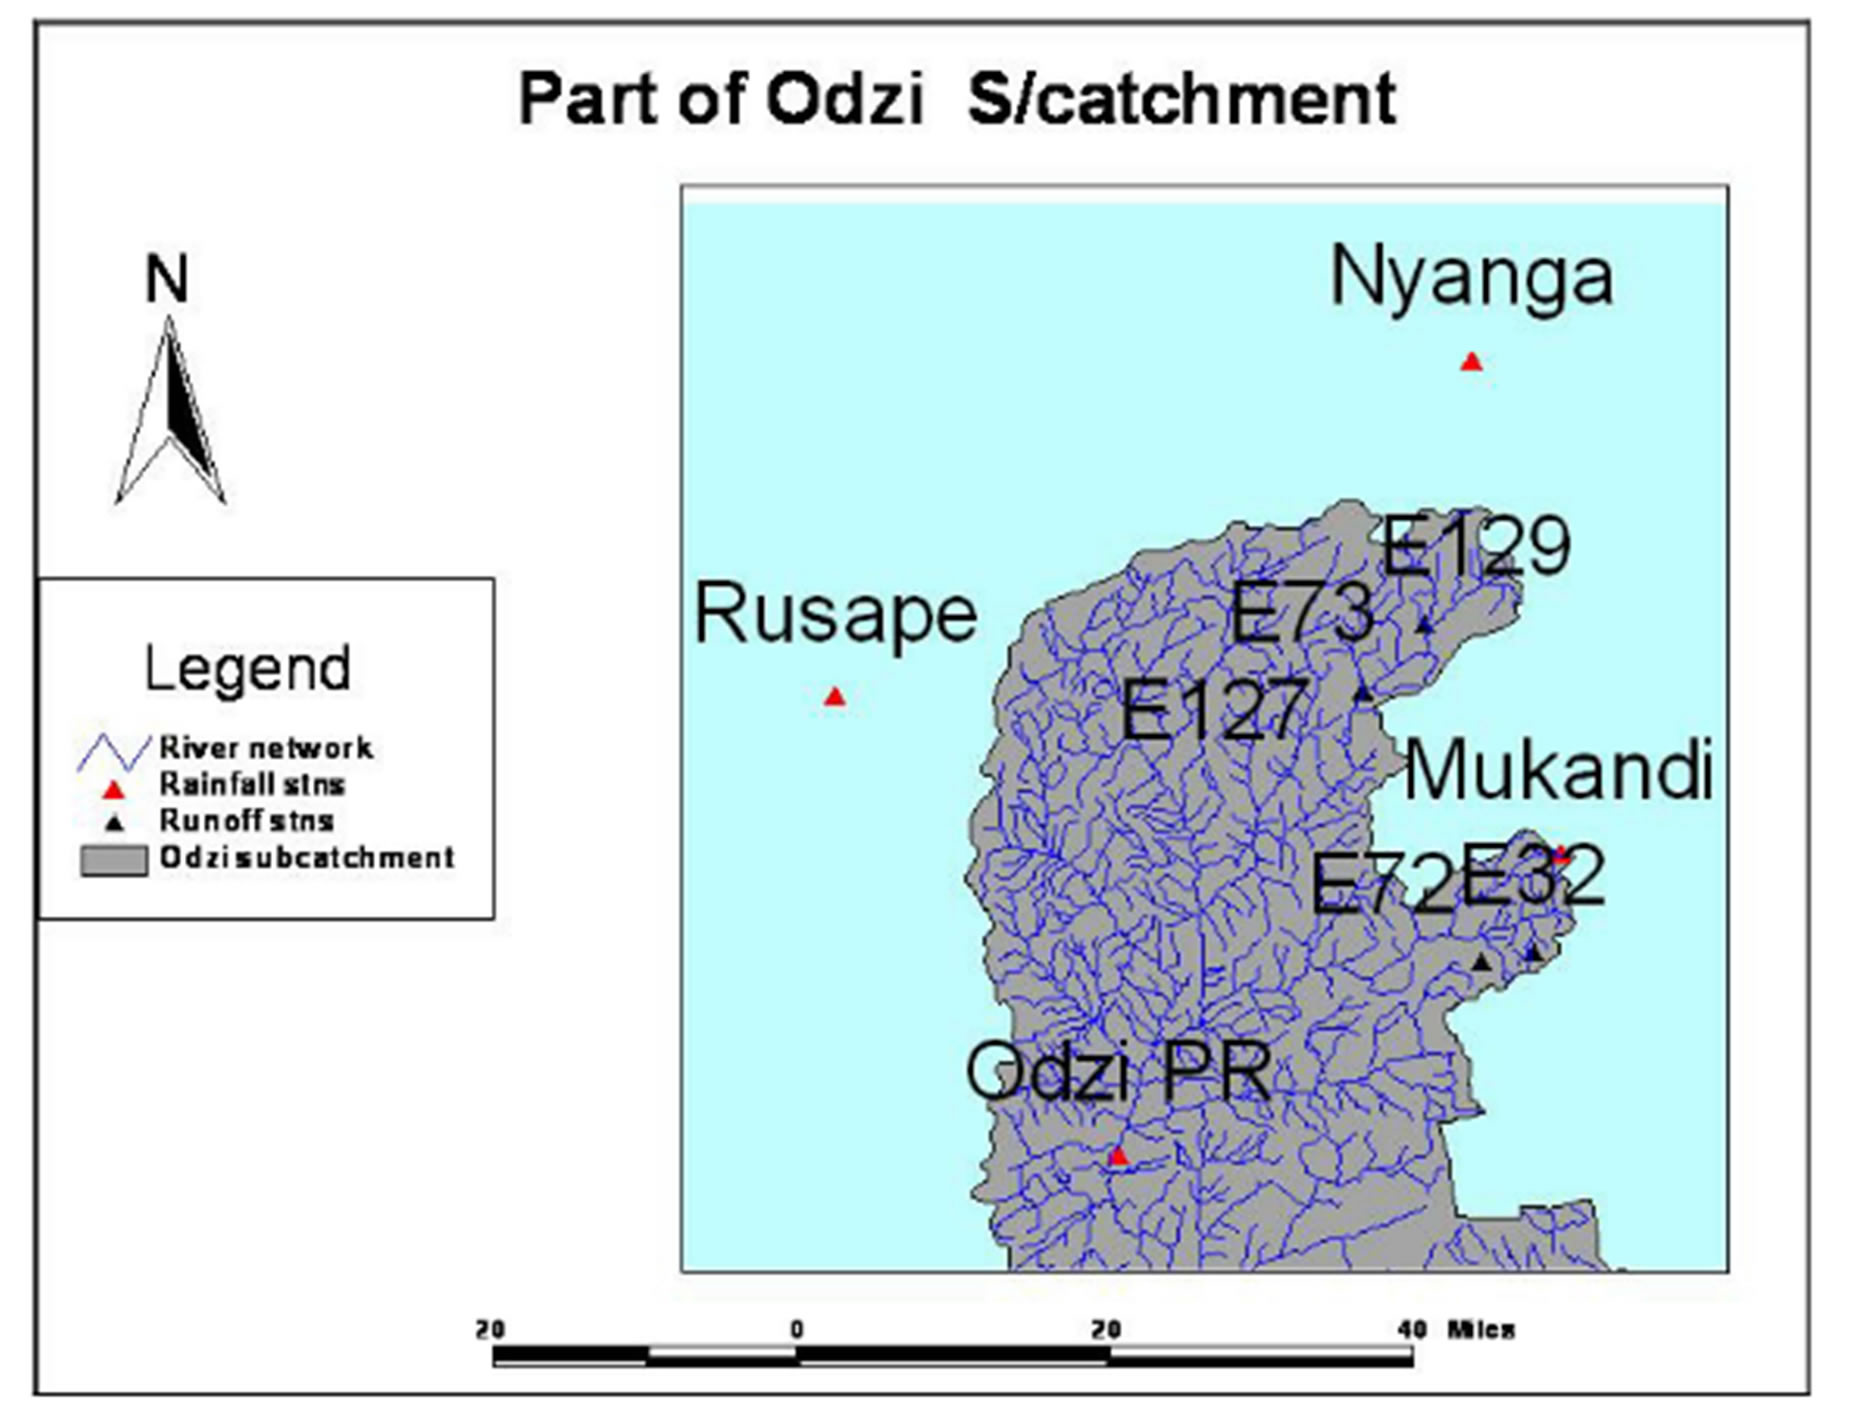
Figure 2. Part of Odzi sub catchment showing runoff and rainfall station locations.
2 hereafter termed micro catchment.
3.1. Demography and Land Use
Population density of whole catchment is above 60 persons per km2 in large parts of the catchment; land use is a mixture of communal lands, commercial farms and forests [30]. On the commercial areas, large farms are found, which run extensive farming. The main crop in this part of Zimbabwe is tobacco during the rainy season and wheat during the dry season; and this is made possible by irrigation. Most of the farms also have cattle [31].
In the communal areas, farming is performed on a much more intensive basis. Small fields are mainly used for maize cultivation; in the drier areas; however, rapocko (a maize-relative) and sorghum (a relative to sugarcane) are cultivated [31]. Cattle and goats are the most common livestock. In the mountainous parts of the catchment, land is mainly covered with forests and in some areas companies carry on forestry. Big plantations of pines and gum trees, which are clear cut when it is time for harvesting, are common. Also in the drier areas of the communal lands, there are irrigation systems such as canals extracting water from the rivers.
The shortage of land and sometimes the unwillingness to carry water has forced people to cultivate on the riverbanks in many places in the catchment area. This is a serious problem since the soil is bare when the first rains come and it is very easily eroded, which causes land degradation and river siltation. Another problem is the removal of vegetation cover due to cattle and goat activties close to the riverbanks. However, most people seem to be aware of the problem but in times of increasing population and scarce resources it is not easy to find a solution [31].
3.2. Physiographic
The geology of the area is dominated by granitic bedrock and in-situ weathered sandy soils [30]. The landscape is hilly, specially in the upper parts where the mountains reach heights up to 2000 m but also the western spur of Chimanimani mountains where some tributaries rise [31].
Granite forms the foundation of the area. The bedrock is very old; around 3.8 billion years. In fact, it is among the oldest geological formations that can be found on earth since the area is situated in the middle of the continent and therefore not recently exposed to tectonic movements. This also means that the bedrock is strongly weathered and bare rock is rarely seen except for the mountain peaks [31]. The soils within the river basin are mostly of igneous origin and rather thick. The parent material is the underlying bedrock since most soils have been formed in situ [32]. In some areas, red late rite clay is found. One important factor could be that compared to a clayey soil the vegetation is sparser on a sandy soil and thereby the soil is more easily eroded.
3.3. Hydrology
The climate is seasonal with a rainy season from November to March. The upper catchment area receives up to 1500 mm rainfall per year while the area west of the river is much drier and receives about 450 mm/year and average runoff is 150 to 400 mm/yr with a coefficient of variation of 174%. The upper mountainous parts receive the highest amounts [31]. The irregular seasonal availability of water has led to the establishment of irrigation systems [30]. The average potential evapo-transpiration is around 4 mm/day in the catchment area.
4. Research Methods
4.1. Rainfall Data
Monthly rainfall data for the aforementioned area were collected from the meteorological department for four stations namely, Mukandi (Latitude 18˚41", Longitude 32˚49"), Nyanga (Latitude 18˚13", Longitude 32˚44"), Odzi Police rail (Latitude 18˚58", Longitude 32˚24") and Rusape (Latitude 18˚32", Longitude 32˚08") (see Figure 2). Data were from July 1959 to June 2006 for all the stations.
4.2. Runoff Data
Data for five stations (E32, E72, E73, E127 and E129) were collected from ZINWA which pertain to the upper part of the Odzi Sub catchment (see Figure 2). Station data E32 (Latitude18˚47", Longitude 32˚37") are from 1957 to 2005. Station E72 (Latitude 18˚47", Longitude 32˚45") data are from 1961 to 2005. Station data E73 (Latitude 18˚32", Longitude 32˚38") are from 1961 to 2005. Station data E127 (Latitude 18˚32", Longitude 32˚38") are from 1969 to 2005. Station data E129 (Latitude 18˚28", Longitude 32˚41") are from 1970 to 2005.
4.3. Data Analysis
The statistical methodology used in this report follows that of [11].
4.3.1. Hypothesis
For this study, to test for significant changes in the rainfall and runoff time series, the null hypotheses (H0) are that there are no changes. The alternative hypotheses (H1) are that there are changes (increasing or decreasing over time).
4.3.2. Rainfall and Runoff Analysis
The Mann-Kendall test was used to test for trends in the rainfall and runoff data. It is a distribution-free method which is frequently applied to detect trends. This testing approach was selected because it allows the investigation to have minimum assumptions (constancy of distribution and independence) about the data. It is possible to avoid assumptions about the form of the distribution that the data derive from. For example, there is no need to assume data are normally distributed [33]. This was done in conjunction with tests for independence and equal distribution. To do this, Kendall’s Turning point test was used to test for independence and equal distribution of the time series data. Monthly data was used.
If a series is not independent, it means there is auto correlation (serial correlation). Suggestions have been made to remove the serial correlation from the data set prior to applying a trend test. Approaches common have been to resample the data set. This is done by generating many random time series with distribution identical to that of the original time series [11]. The significance of changes was computed using standard formulae [34].
5. Results
Test for independence was also carried out on the data using the Kendall’s turning point method and the data were found to be dependent and thus had auto correlation. Hence the data had to be re-sampled using block permutation or block bootstrapping after which trend analysis was carried out for both rainfall and runoff data.
5.1. Rainfall Data
The following results were obtained from the Mann Kendall’s test done on the rainfall stations’ data (Table 1).
Total annual rainfall data (mm/annum) and trend lines were also plotted against time (years) for the specified time periods provided for each station in order to augment findings. These are shown in Figures 3-6.
Rusape Rainfall Station
Figure 3 shows a time series graph with a trend line whose gradient is −0.18. This shows that over time, rainfall is decreasing though at a very small rate. However, the Mann Kendall test for the station (Table 1) showed that there was no significant trend at 95% confidence level.
Mukandi Rainfall Station
Figure 4 shows a time series graph with a trend line whose gradient is −10.8. This shows that over time, rainfall is decreasing significantly. The Mann Kendall test for the station (Table 1) also showed that there was a significant trend at 95% confidence level. There is therefore, a significant drop in rainfall on this station over time.
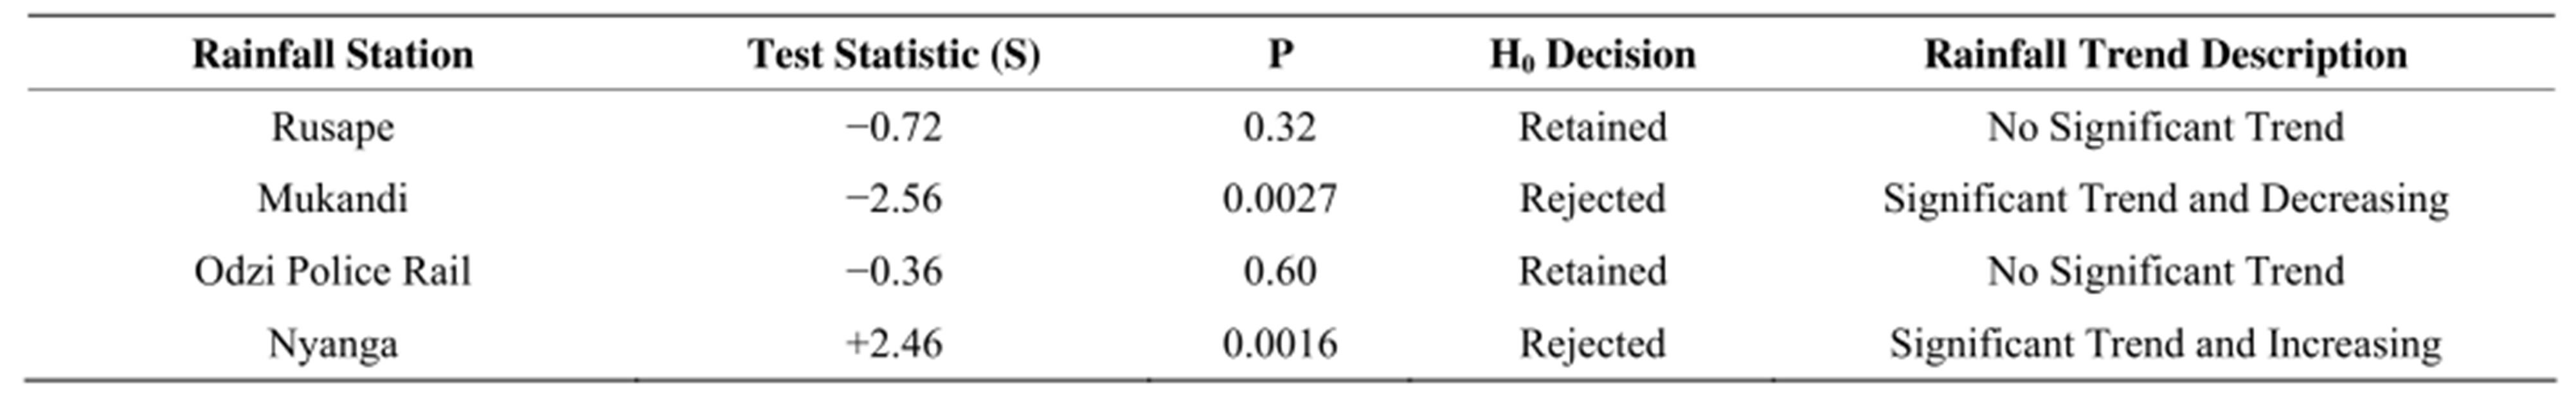
Table 1. Mann Kendall test results and interpretation for rainfall stations Rusape, Mukandi, Odzi Police rail and Nyanga.

Figure 3. Rusape Rainfall Station time series and trend line.
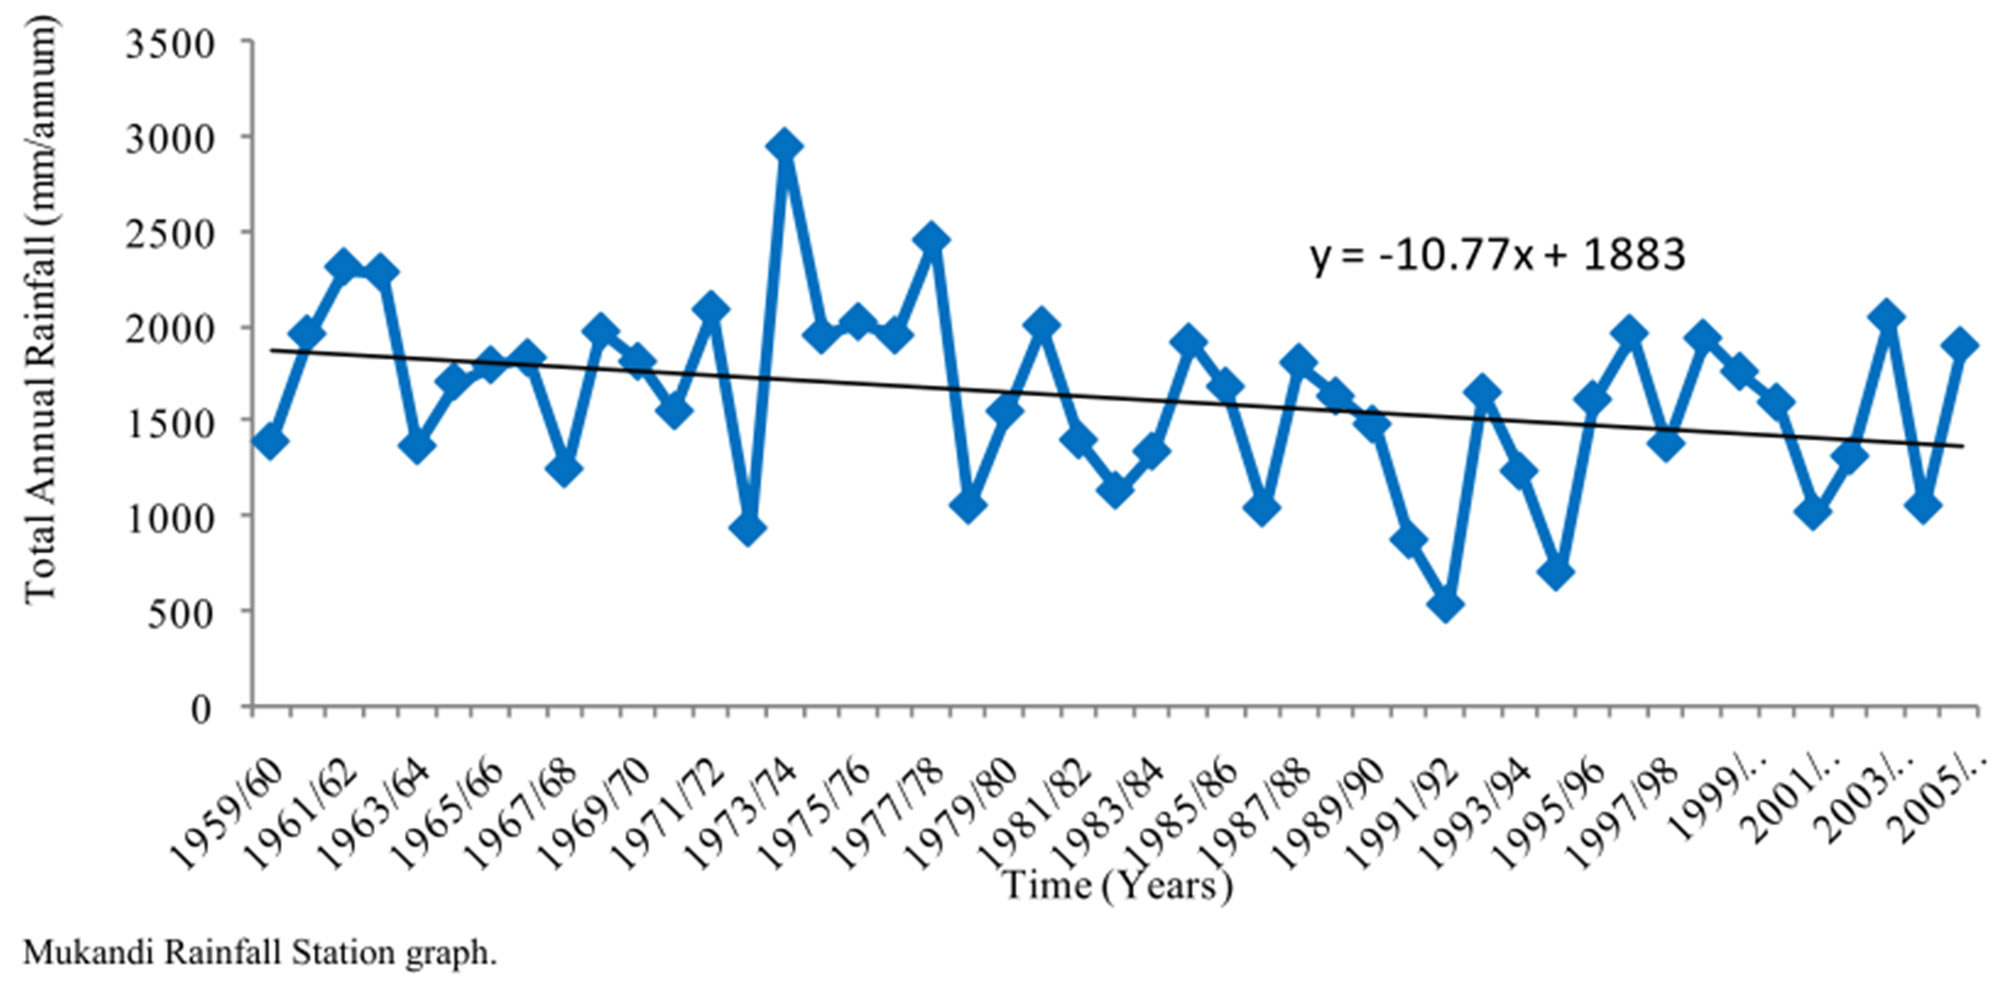
Figure 4. Mukandi Rainfall Station time series and trend line.
Odzi Police Rail Rainfall Station
Figure 5 shows a time series graph with a trend line whose gradient is +1.2. This shows that over time, rainfall is increasing but at a small rate. However, the Mann Kendall test for the station (Table 1) showed that there was no significant trend at 95% confidence level.
Nyanga Rainfall Station
Figure 6 shows a time series graph with a trend line whose gradient is +8.4. This shows that over time, rainfall is increasing significantly. The Mann Kendall test for the station (Table 1) also showed that there was a significant trend at 95% confidence level. There is therefore, a rise in rainfall over Nyanga Rainfall station for the period under consideration.
5.2. Runoff Data
The following results were obtained from the Mann Kendall’s test done on the runoff stations’ data (Table 2).
Total Annual runoff data (103*m3/annum) and trend lines were also plotted against time (years) for the specified time period provided for each station to augment findings. These are shown in Figures 7-11.
Station E32
Figure 7 shows a time series graph with a trend line whose gradient is −691. This shows that over time, runoff passing through station E32 is decreasing very significantly. The Mann Kendall test for the station (Table 2) also showed that there was a significant trend at 95% confidence level with a negative S value. There is therefore, a significant drop in runoff passing through this station over time.
Station E72
Figure 8 shows a time series graph with a trend line whose gradient is +13.4. This shows that over time,
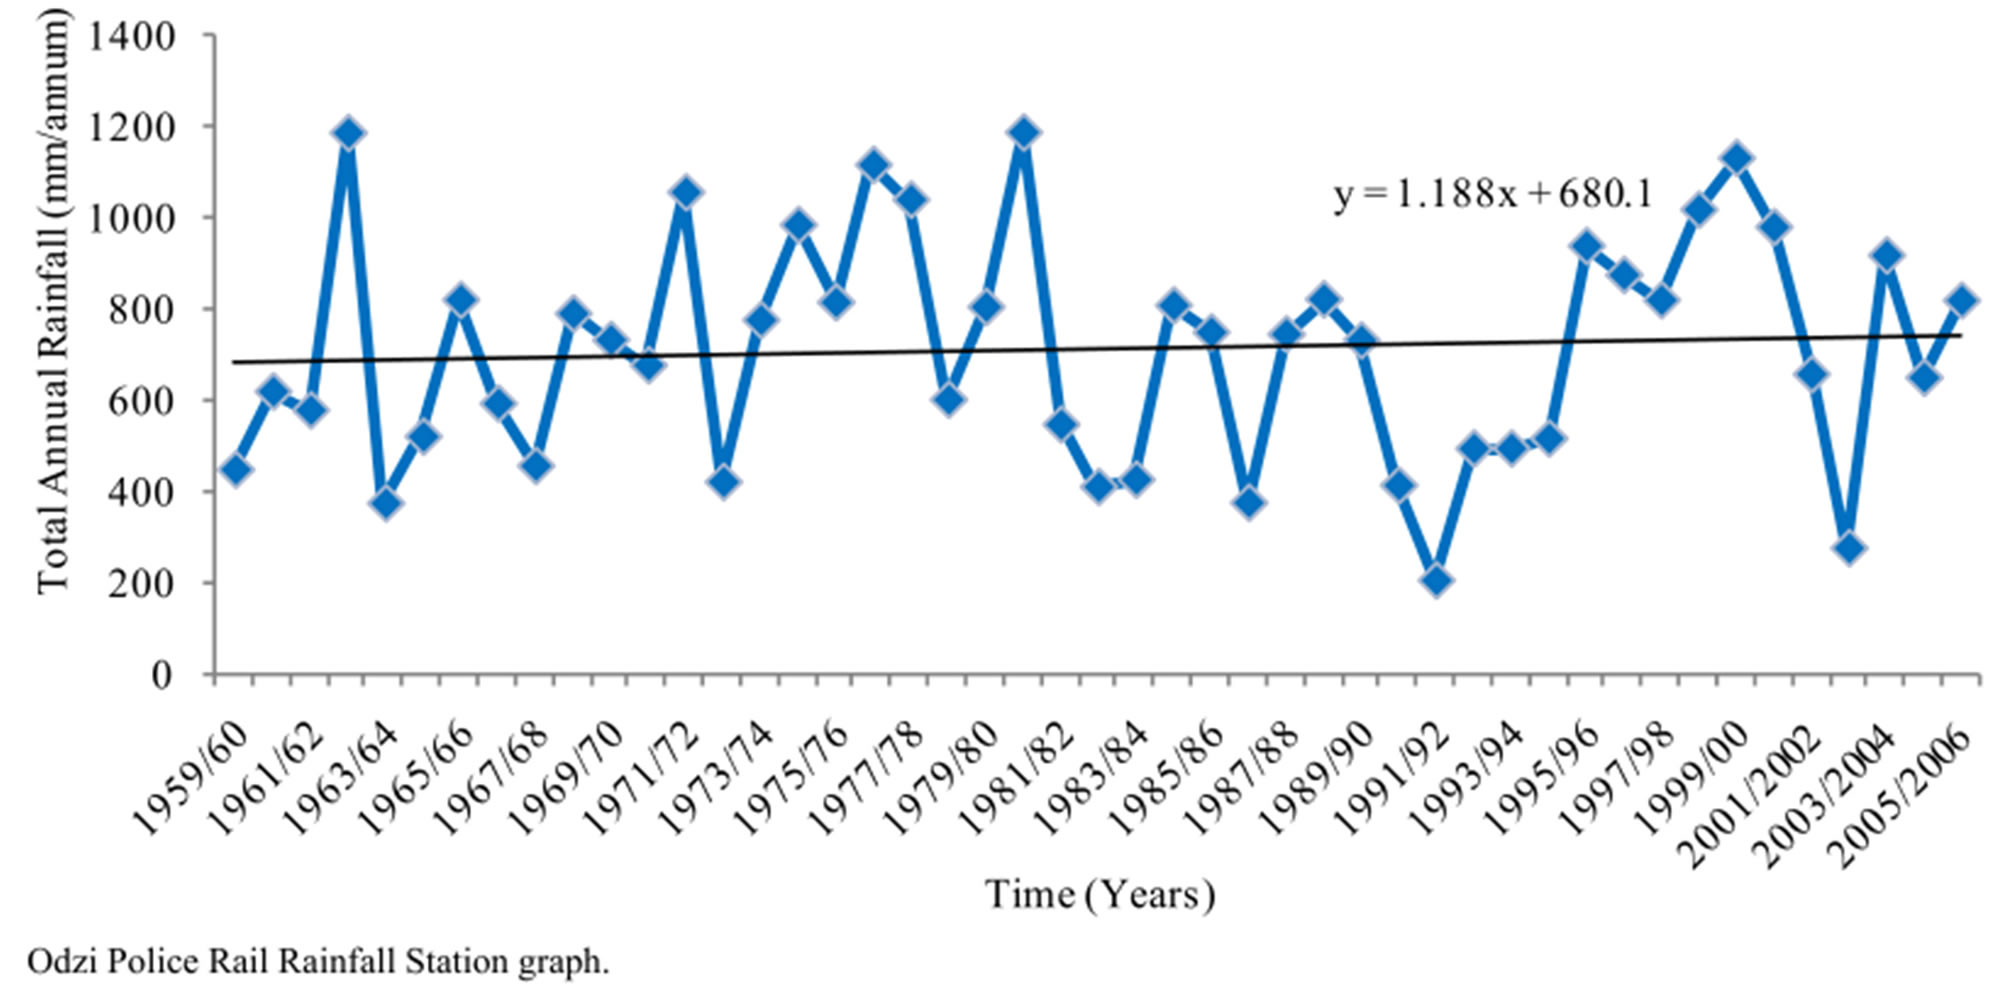
Figure 5. Station Odzi Police Rail time series and trend line.
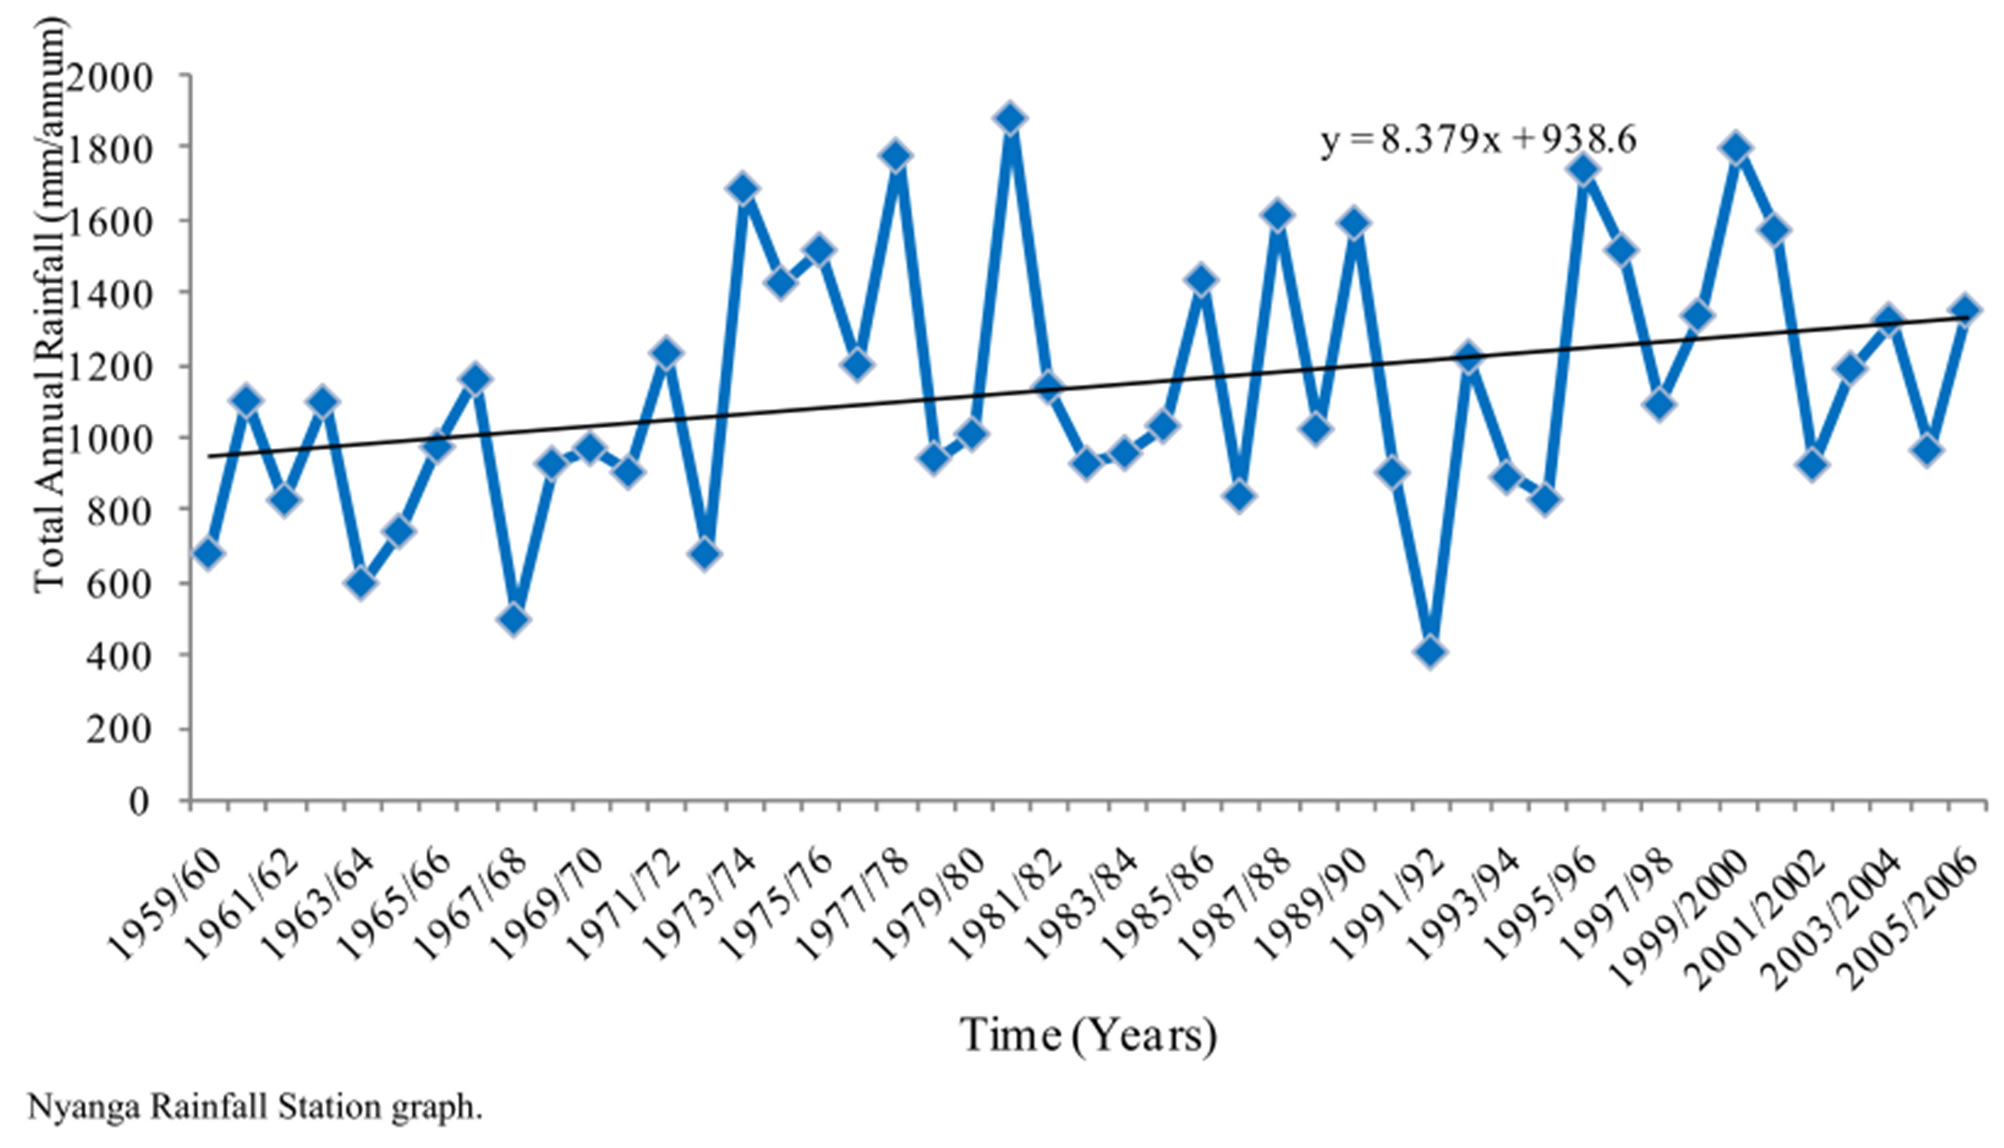
Figure 6. Nyanga Rainfall Station time series and trend line.
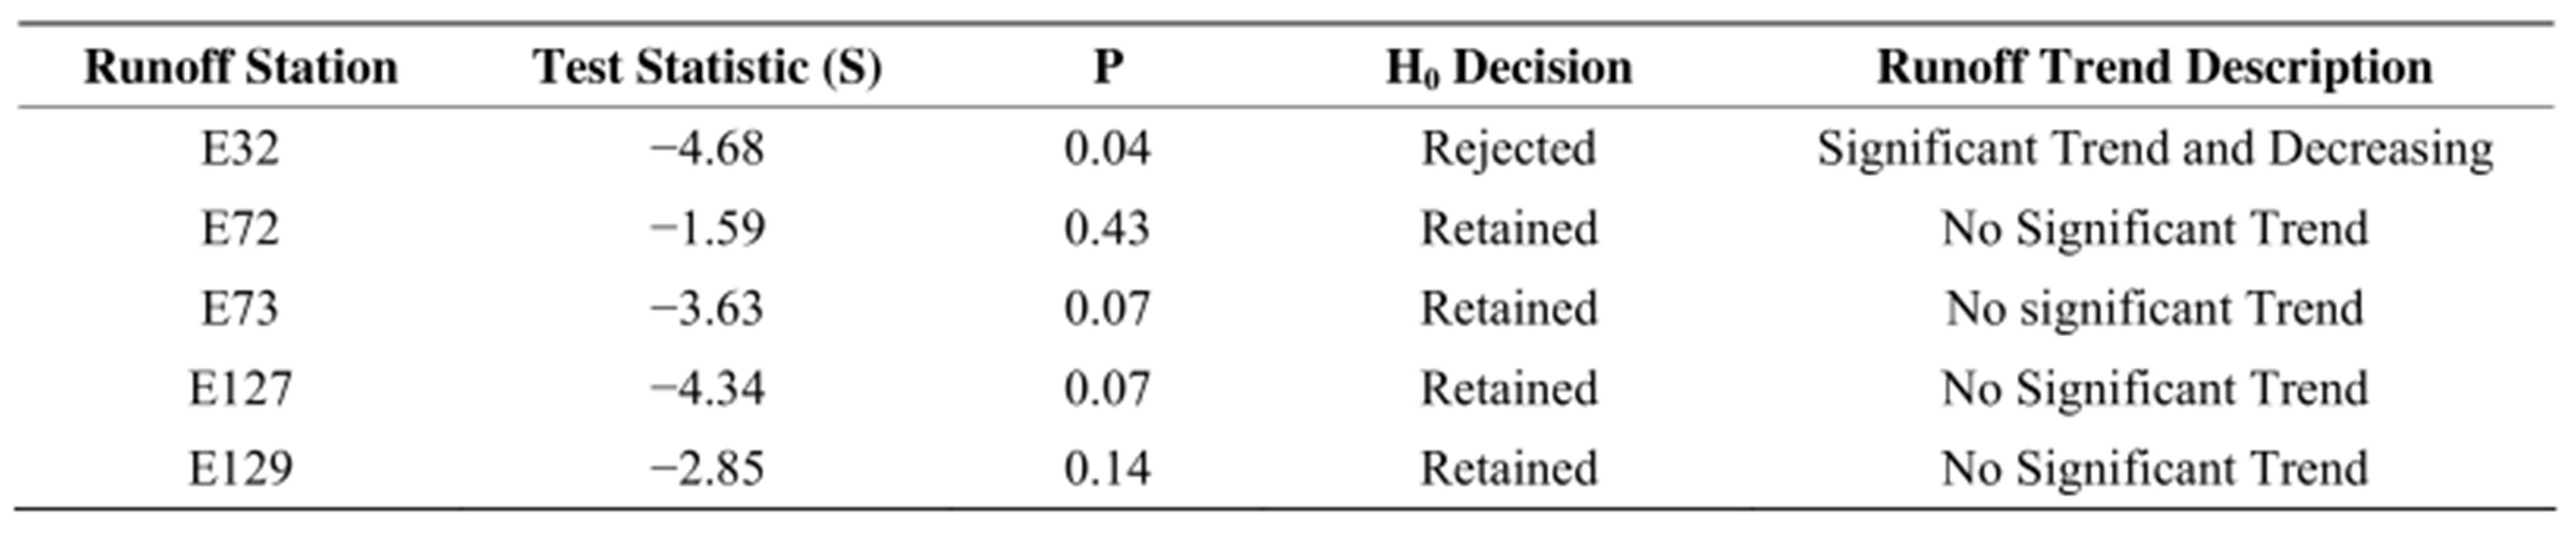
Table 2. Mann Kendall test results and interpretation for runoff stations E32, E72, E73, E127 and E129.
flows passing through station E72 are slightly increasing. The Mann Kendall test for the station (Table 2), however, showed that there was no significant trend at 95% confidence level. There is therefore, no significant change in runoff passing through this station over time.
Station E73
Figure 9 shows a time series graph with a trend line whose gradient is −76. This shows that over time, runoff passing through station E73 is decreasing. The Mann Kendall test for the station (Table 2), however, showed
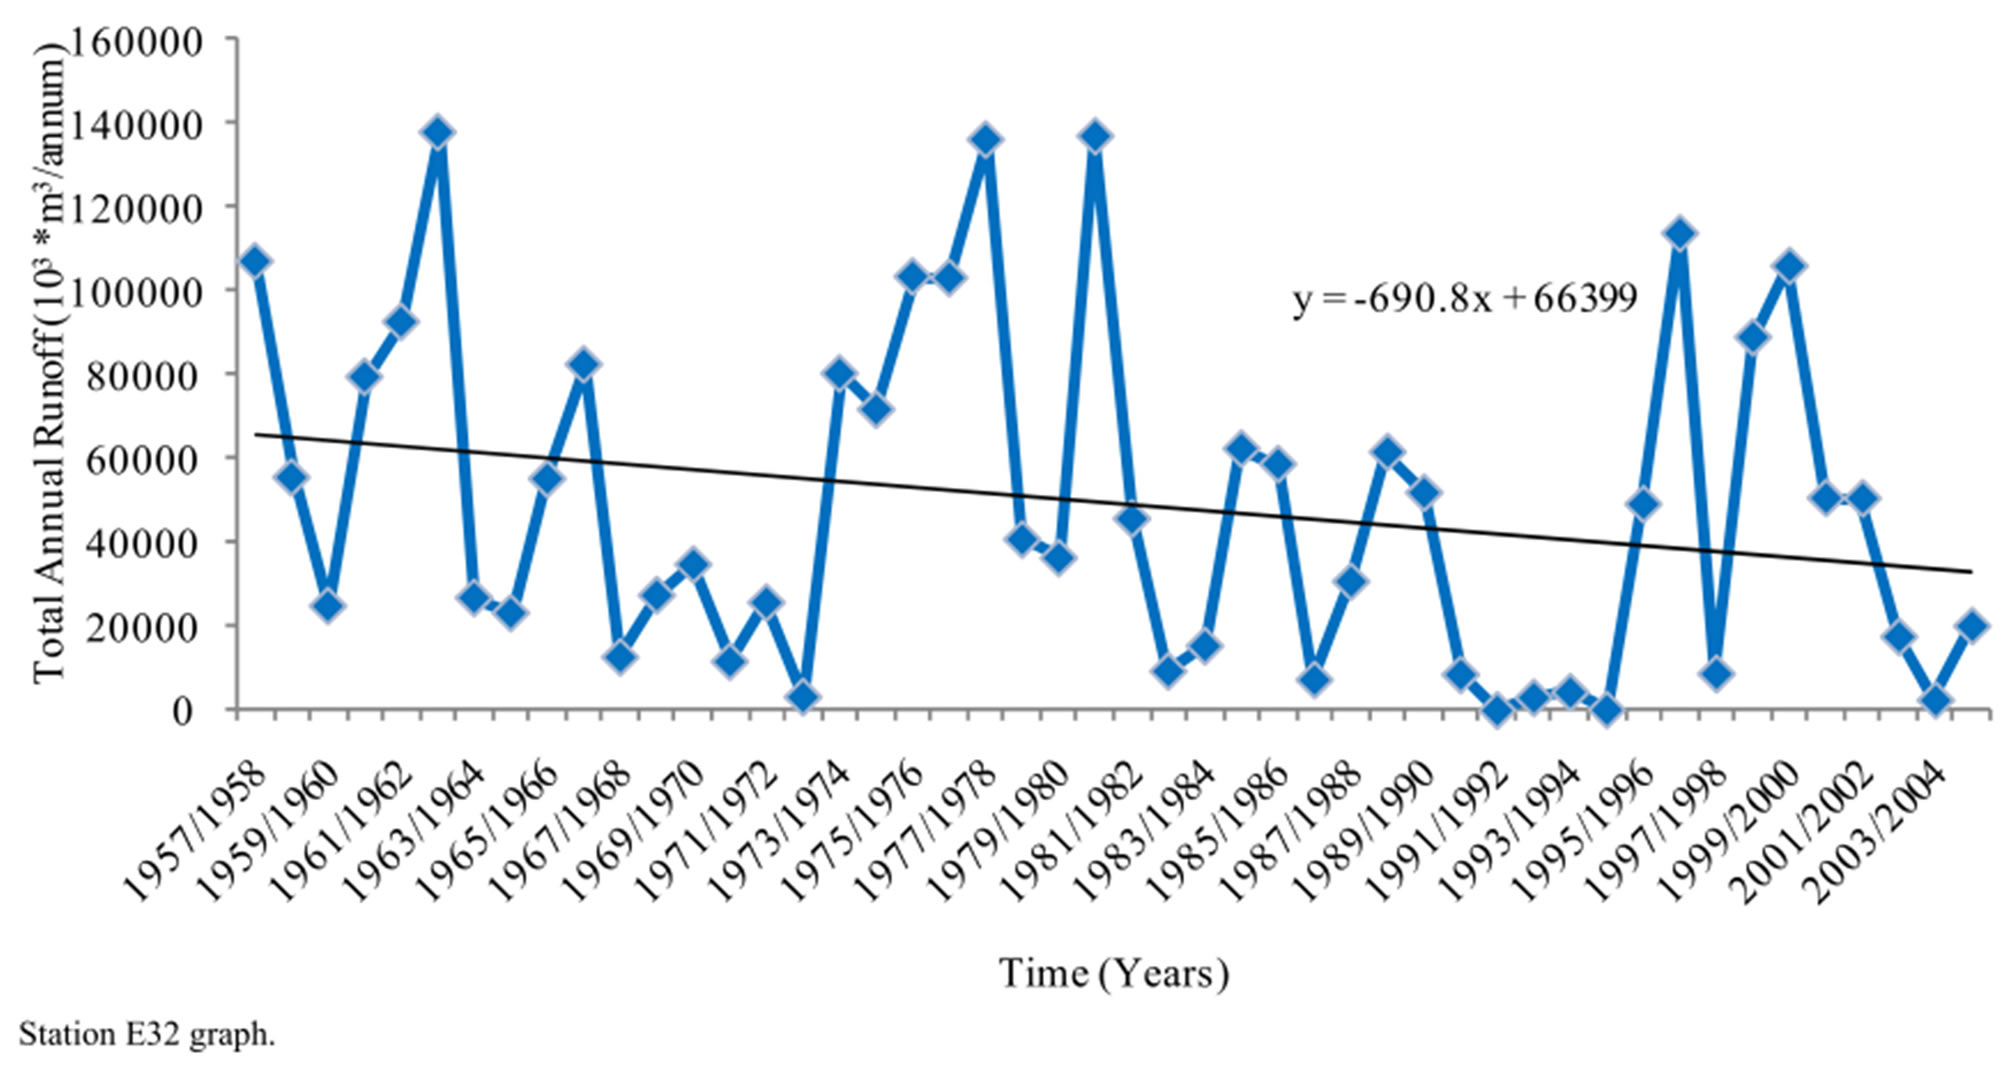
Figure 7. Station E32 time series and trend line.

Figure 8. Station E72 time series and trend line.
that there was no significant trend at 95% confidence level. There is therefore, no significant drop in runoff passing through this station over time.
Station E127
Figure 10 shows a time series graph with a trend line whose gradient is −156. This shows that over time, runoff passing through station E127 is decreasing. The Mann Kendall test for the station (Table 2), however, showed that there was no significant trend at 95% confidence level. There is therefore, no significant drop in runoff passing through this station over time.
Station E129
Figure 11 shows a time series graph with a trend line whose gradient is −184. This shows that over time, runoff passing through station E129 is decreasing. The Mann Kendall test for the station (Table 2), however, showed that there was no significant trend at 95% confidence level. There is therefore, no significant drop in runoff
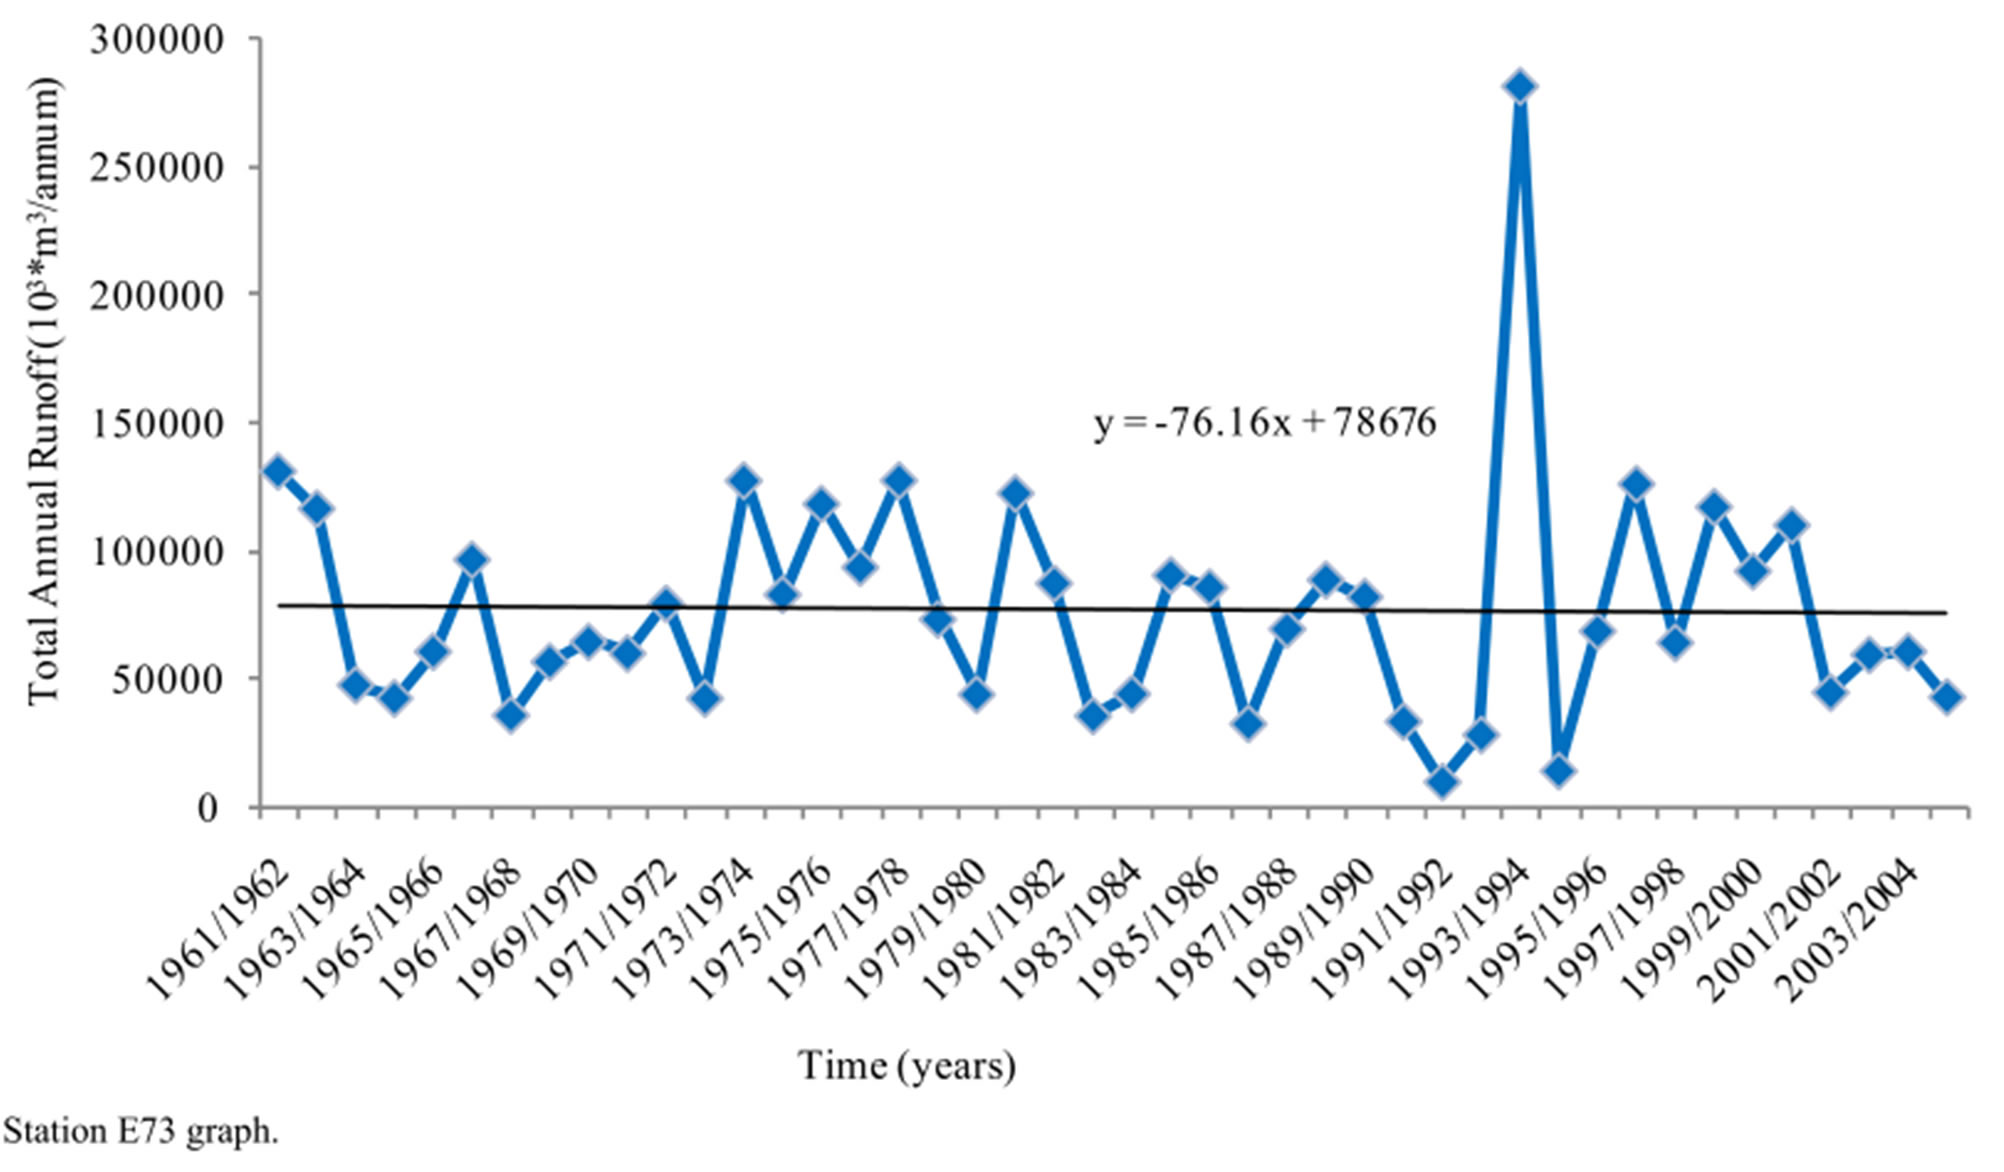
Figure 9. Station E73 time series and trend line.
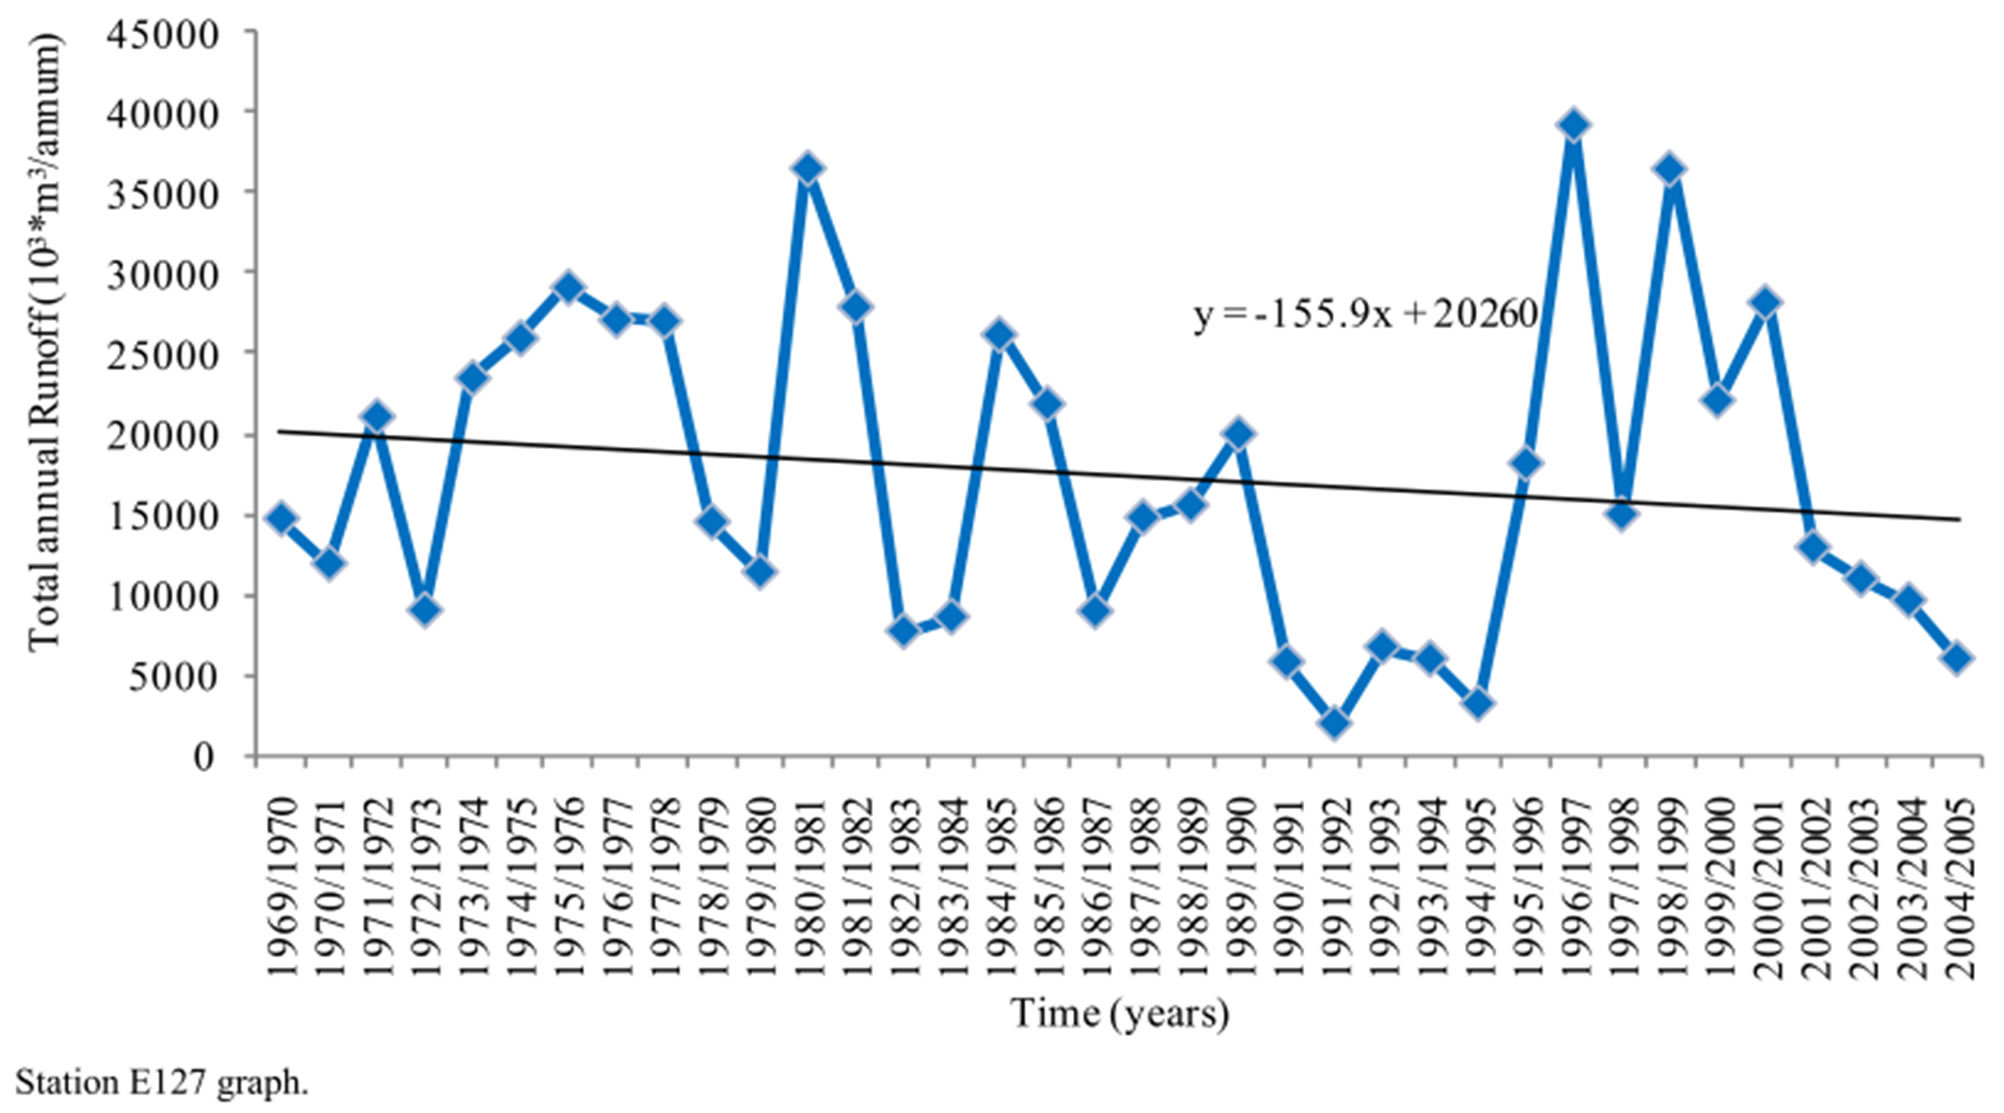
Figure 10. Station E127 time series and trend line.
passing through this station over time.
6. Discussion of Results
6.1. Rainfall Results
Rusape and Odzi Police rail stations showed no significant change in rainfall over the 1959-2006 period. This agreed with results obtained by [21] who ran scenarios of Pungwe basin rainfall for the 1991-2020, and 2021-2050 periods compared to the 1961-1990 period. Results obtained showed that a slight decrease of rainfall for 2021- 2050, compared to the 1991-2020 was also expected. Mukandi showed a negative trend or drop in rainfall over the same period of 1959-2006. However, Nyanga station showed a rising trend in rainfall over the same period [35]. Such contrasting results are possible and this is supported by [23] whose study showed both positive and negative trends in precipitation time series, although most significant trends were negative. However, a further study is necessary to establish the main causes of these two contrasting outcomes [35].
Further analyses using the total annual rainfall data plotted over time for all the four stations (Figures 3-6) augmented the results obtained using the Mann Kendall
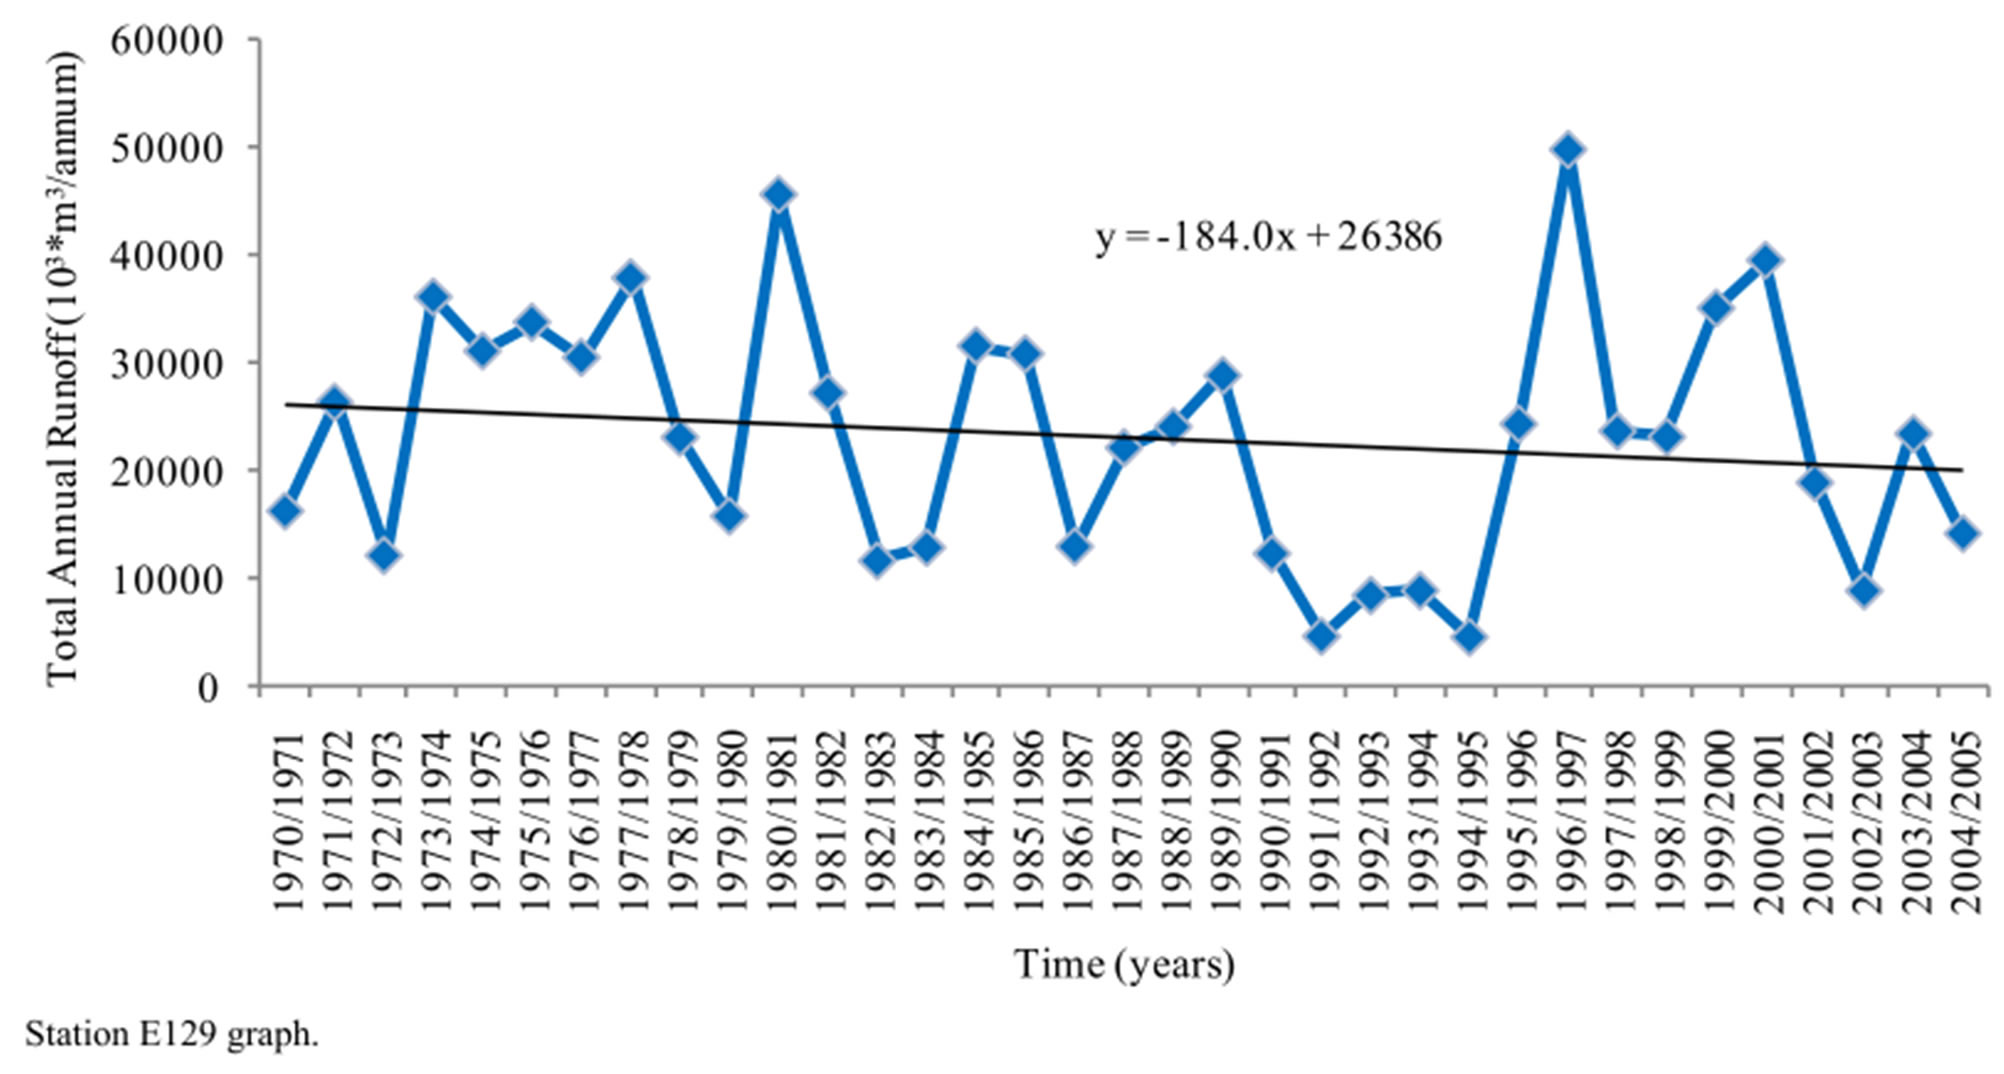
Figure 11. Station E129 time series and trend line.
test. Slight discrepancies were, however shown on Rusape and Old Police Rail stations where the gradients of the trend lines for the time series graphs for the stations were −0.18 and +1.2 respectively, yet the Mann Kendall test showed no significant change in rainfall over the two stations. Further investigations are necessary to establish the reason(s) behind the discrepancies.
6.2. Runoff Results
Of the five stations, only station E32 showed a significant change in runoff over time [35]. This agrees with other studies done on trend detection in runoff [16,29]. The rest of the stations had no significant downward trends at 95% confidence level. Caution must be taken, however, when interpreting the physical importance (or lack thereof) of non-statistically significant trends in annual runoff. A trend in runoff may not be statistically significant, but could have important effects on water resources [20]. Further analyses using the total annual runoff data plotted over time for all the five stations (Figures 7-11) augmented the results obtained using the Mann Kendall test. Discrepancies were, however, shown for all but one station (E32). The gradients of the trend lines for the time series graphs for the stations (E72, E73, E127 and E129) were +13.4, −76, −156 and −184 respectively, yet the Mann Kendall test showed no significant change in runoff over the four stations. Further investigations are necessary to establish the reason(s) behind the discrepancies.
7. Conclusions and Recommendations
Rainfall results have shown that rainfall is both decreasing (Mukandi station) and increasing (Nyanga station) in the micro catchment. The remaining stations showed no positive or negative trends. Going by these results, it could be concluded that the climate change signature was not very clear. Further study needs to be done to ascertain whether or not climate change exists with in the study area. Runoff analysis results showed that in princeple climate change could not be justified hence the study’s Null hypothesis of no change was retained.
This study recommended that issues of current land use patterns and water abstractions be thoroughly understood within the study area. It is also known that land use activities have an impact on the quantity and quality of catchment water, therefore, sustainable land use cannot be separated from proper catchment management. Thus, it is strongly recommended that water resource management be integrated with land use management. Finally, though results did not point to existence of climate change signatures, the people dwelling in the study area (micro catchment of the Odzi sub catchment) must be taught of the importance of using their natural resources, especially water, in a sustainable manner. This will go a long way in promoting social and economic progression. Rampant cutting down of trees should be avoided and instead reforestation should be promoted. Forests and woodlands are very good carbon sinks. This move tends to reduce the amount of atmospheric carbon dioxide which has been known to promote global warming.
8. Acknowledgements
All blessings, and honour, and glory, and power be unto the Ancient of Days from this time hence forth and forever, amen and amen. I am also grateful to WATERNET for sponsoring the research which was part of my MSc studies in Integrated Water Resources Management. This paper is a portion of my full MSc thesis. I also would like to appreciate WATERNET staff for their professionalism and commitment to their work. On this note, special thanks go to Mrs. Sadazi for her tireless work and support she offered to the students. I also express my gratitude to my supervisors, Eng. E. Kaseke and Mr. E Madamombe for all their support during the period of research. Post humously, I would like to express my thanks to the late Mr. Merka for the support he also gave me at the start of this project. I also would like to express my gratitudes to Mr. Tererai (ZINWA) as well as Dr. L. Katiyo (Chinhoyi University of Technology) for their great and unspeakable support as resource persons. Many thanks also go to WATERNET-DCE lecturers also for their constructive criticisms throughout the course of this project. This goes especially to Mr. A. Mhizha and the current Coordinator Mr. Siwadi. I would like to express my special gratitudes to the Inaugural Dean of the Faculty of Agricultural Sciences, Great Zimbabwe University, Professor Munashe Shoko for his support and encouragements. Last but not least, I would like to thank my wife Dorcas and our children, Joshua, Caleb and Jephthah for their continual support.
REFERENCES
- IPCC, “Summary for Policymakers Report,” Prepared by the Intergovernmental Panel on Climate Change Working Group I. World Meteorological Organization, United Nations Environmental Program, Geneva, 1995.
- IPCC, “Synthesis Report, Third Assessment, Working Group III. Summary for Policymakers,” IPCC, Paris, 2001.
- T. Banuri and H. Opschoor, “Climate Change and Sustainable Development,” Department of Economic and Social Affairs Working Paper No. 56, 2007. www.un.org/esa/desa/papers/2007/wp56_2007.pdf
- J. Chigwada, “Adverse Impact of Climate Change and Development Challenges: Integrating Adaptation in Policy and Development in Malawi,” IIED, London, 2004.
- S. Eriksen and L. O. Naes, “Pro-Poor Climate Adaptation: Norwegian Development Corporation and Climate Change Adaptation. An Assessment of Issues, Strategies and Potential Entry Points,” CICERO, Oslo, 2003.
- F. A. Bernham, “Development and Application of a GISBased Regional Hydrological Variability and Environmental Assessment System (RHVEAS) for Southern Africa Region,” Ph.D. Thesis, University of Dar Es Salaam, Dar Es Salaam, 1999.
- F. A. Bernham, B. T. Zaake and R. K. Kachroo, “A Study of Variability of Annual River Flow of the Southern African Region,” Hydrological Science Journal, Vol. 46, No. 4, 2001, pp. 513-524. http://dx.doi.org/10.1080/02626660109492847
- M. Hulme and N. Sheard, “Climate Change Scenarios for Zimbabwe,” Climate Research Unit, University of East Anglia, Norwich, 1999.
- G. Bergkamp, B. Orlando and I. Burton, “Change. Adaptation of Water Management to Climate Change,” IUCN, Gland and Cambridge, 2003. http://dx.doi.org/10.2305/IUCN.CH.2003.WANI.1.en
- B. Moyo, “Impact and Adaptation of Climate Variability on Water Supply Reservoirs Yields for the City Of Bulawayo-Mzingwane Catchment,” M.Sc. Thesis, University of Zimbabwe, Mount Pleasant Harare, 2005.
- Z. W. Kundzewicz and A. Robson, “Change Detection in River Flow Records—Review of Methodology,” Hydrological Sciences Journal, Vol. 49, No. 2, 2004, pp. 7-19. http://dx.doi.org/10.1623/hysj.49.1.7.53993
- T. J. Osborn, M. Hulme, P. D. Jones and T. A. Basnet, “Observed Trends in the Daily Intensity of United Kingdom Precipitation,” International Journal of Climatology, Vol. 20, No. 4, 2000, pp. 347-364. http://dx.doi.org/10.1002/(SICI)1097-0088(20000330)20:4<347::AID-JOC475>3.0.CO;2-C
- W. N. Ward, “Diagnosis and Short-Lead Time Prediction of Summer Rainfall in Tropical North Africa at Interannual and Multidecadal Timescales,” Journal on Climate, Vol. 11, No. 12, 1998, pp. 3167-3191. http://dx.doi.org/10.1175/1520-0442(1998)011<3167:DASLTP>2.0.CO;2
- S. E. Nicholson and I. M. Palao, “A Re-Evaluation of Rainfall Variability in the Sahel, Part I. Characteristics of Rainfall Fluctuations,” International Journal of Climatology, Vol. 13, No. 4, 1993, pp. 371-389. http://dx.doi.org/10.1002/joc.3370130403
- J. Albergel, “Genese Et Predertermination Des Crues Au Burkina Faso, Du M2 Au Km2, Etude Des Parametres Hydrologiques Et De Leur Evolution,” Etudes et Thèses, Edition de L’ORSTOM, 1988.
- P. Valimba, “Rainfall Variability in Southern Africa, Its Influences on Stream-Flow Variations and Its Relationships with Climatic Variations,” Ph.D. Thesis, Rhodes University, Grahamstown, 2004.
- D. Stone, A. J. Weaver and F. W. Zwiers, “Trends in Canadian Precipitation Intensity,” Atmosphere-Ocean, Vol. 38, No. 2, 2000, pp. 321-347. http://dx.doi.org/10.1080/07055900.2000.9649651
- J. S. Risby and D. Entekhabi, “Observed Sacremento Basin Stream Flow Response to Precipitation and Temperature Changes and Its Relevance to Climate Impact Studies,” Journal of Hydrology, Vol. 184, No. 3-4, 1996, pp. 209-223. http://dx.doi.org/10.1016/0022-1694(95)02984-2
- K. R. Pankaj and M. Asis, “Regional Hydrological Impacts of Climate Change—Impact Assessment and Decision Making,” Proceedings of Symposium S6 Held during the 7th Iahs Scientific Assembly, Foz Do Iguacu, April 2005.
- G. J. McCabe and D. M. Wolock, “Climate Change and the Detection of Trends in Annual Runoff,” Climate Research, Vol. 8, No. 2, 1997, pp. 129-134. http://dx.doi.org/10.3354/cr008129
- K. Losjö, L. Andersson and P. Samuelsson, “Report on Climate Change Impact on Water Resources in the Pungwe Dainage Basin,” Final Report, Swedish Meteorological and Hydrological Institute, No: 2006-45. http://www.bgs.ac.uk/sadcreports/mozambique2006anderssonclimatechangepungwebasin.pdf
- I. Krasovskaia, “Quantification of the Stability of River Flow Regimes,” Hydrological Sciences Journal, Vol. 40, No. 5, 1995, pp. 587-598. http://dx.doi.org/10.1080/02626669509491446
- H. Kunstmann and G. Jung, “Investigations of Feed-Back Mechanisms between Soil Moisture, Land Use and Precipitation in West Africa,” In: S. Franks, G. Blöschl, M. Kumagai, K. Musiake and D. Rosbjerg, Eds., Water Resources Systems-Water Availability and Global Change, IAHS Press, Wallingford, 2003, pp. 149-159.
- K. D. Frederick and D. C. Major, “Climate Change and Water Resources,” Climatic Change Vol. 37, No. 1, 1997, pp. 7-23. http://dx.doi.org/10.1023/A:1005336924908
- P. H. Gleick and E. L. Chalecki, “The Impacts of Climatic Changes for Water Resources of the Colorado And Sacramento-San Joaquin River Basins,” Journal of the American Water Resources Association, Vol. 35, No. 6, 1999, pp. 1429-1441. http://dx.doi.org/10.1111/j.1752-1688.1999.tb04227.x
- D. M. Wolock and G. J. McCabe, “Estimates of Runoff Using Water-Balance and Atmospheric General Circulation Models,” Journal of the American Water Resources Association, Vol. 35, No. 6, 1999, pp. 1341-1350. http://dx.doi.org/10.1111/j.1752-1688.1999.tb04219.x
- H. J. Caspary, “Increased Risk of River Flooding in Southwest Germany Caused by Changes of the Atmospheric Circulation across Europe,” In A. Bronstert, Ch. Bismuth and L. Menzel, Eds., Proceedings of the European Conference on Advances in Flood Research, PIK Report No. 65, 2000, pp. 212-223.
- F. Nobilis and P. Lorenz, “Flood Trends in Austria,” In: G. H. Leavesley, H. F. Lins, F. Nobilis, R. S. Parker, V. R. Schneider and F. H. M. van de Ven, Eds., Destructive Water: Water-Caused Natural Disasters, Their Abatement and Control, IAHS Publishing, Wallingford, 1997.
- W. Chingombe, J. E. Gutierrez, E. Pedzisai and E. Siziba, “A Study of Hydrological Trends and Variability of Upper Mazowe Catchment, Zimbabwe,” 2013. http//www.jsd-africa.com/Jsda/Spring2005/article.htm
- R. Lidén, J. Harlin, M. Karlsson and M. Rahmberg, “Hydrological Modeling of Fine Sediments in the Odzi River, Zimbabwe,” Water SA, Vol. 27, No. 3, 2001, pp. 303-314. http://dx.doi.org/10.4314/wsa.v27i3.4973
- C. Magnus and R. Magnus, “Assessment of Suspended Sediment Variability in the Odzi River, Zimbabwe,” Working Group for Tropical Ecology at Uppsala University, Uppsala city, 1999.
- J. G. Thompson and W. D. Purves, “A Guide to the Soils of Zimbabwe,” Zimbabwe Agricultural Journal, 1978, p. 64.
- WMO Report No. 1239, “Detection of Change in World— Wide Hydrological Time Series of Maximum Annual Flow,” WMO, Geneva, 2004.
- M. Radzeijewski and Z. Kundzewicz, “Development, Use and Application of the Hydrospect Data Analysis System for the Detection of Change in Hydrological Time Series for Use in WPC-Water and National Hydrological Services-WCASP-65,” WMO/TD-No 1240, Poznan, 2004.
- K. Nyoni, “An Assessment of Climate Change and Possible Impact on Available Water Resources on the Odzi Sub-Catchment in Zimbabwe,” M.Sc. Thesis, University of Zimbabwe, Harare, 2007.