American Journal of Climate Change
Vol.3 No.2(2014), Article ID:47071,15 pages
DOI:10.4236/ajcc.2014.32012
First Quantitative Estimates of Carbon Retention by Citrus Groves under Cuba’s Conditions
Mayda Betancourt1*, Nelvin Reyes1, Dalia Vázquez2, Miguel D. Dufoo2, María E. García1, Arnaldo Álvarez3
1Tropical Fruit Crops Research Institute, Havana, Cuba
2Autonomous University of Querétaro, College Center, Querétaro, Mexico
3Agroforestry Research Institute, Havana, Cuba
Email: *cambioclimatico@iift.cu
Copyright © 2014 by authors and Scientific Research Publishing Inc.
This work is licensed under the Creative Commons Attribution International License (CC BY).
http://creativecommons.org/licenses/by/4.0/


Received 19 June 2013; revised 12 July 2013; accepted 5 August 2013
Abstract
Citrus is one of the major fruit crops in Cuba. Its perennial nature, the planted area and the time of productive exploitation turn it into a potential sink of atmospheric carbon. The present study was focused on the obtainment of two models that allow the quantitative estimation of carbon retention by citrus groves. The research was done in two commercial groves: orange [Citrus sinensis (L) Osbeck] cv. “Valencia Late” and grapefruit (Citrus paradisi Macf.) cv. “Marsh Seedless” both on sour orange (Citrus aurantium L.) and planted on a typical red ferralitic soil of Artemisa province. Groves are located at 22˚55' North and 82˚40' West. Cuba’s climate is tropical, seasonally humid, with sea influence and semicontinentality features. Three issues were dealt with: 1) Determination of the total mean quantity of retained carbon by the aerial part of the trees using a destructive sampling method (Pattern Method) to estimate: the total volume of the tree, wood densities and green and dry biomass; 2) Determination of the total mean quantity of retained carbon by the aerial part of the trees using two Allometric Methods; and 3) Determination of the most effective Allometric Method to estimate the carbon retention by the aerial part of the trees. From the results, it is concluded that the evaluated methods were effective to reach a first quantitative approximation to carbon retention by citrus groves and under equal conditions, the Allometric Method 2 was more accurate to estimate the Total Carbon Content in “Valencia Late” orange, while for “Marsh Seedless” grapefruit the Allometric Method 1 provided the best estimate.
Keywords:Carbon Retention, Citrus, Allometric Methods, Climate Change

1. Introduction
Citrus groves have the second place in production importance worldwide [1] . In Cuba, they occupy an extension of more than 22.000 ha, traditionally being the second culture in economical relevance (preceded by sugar cane). Since the beginning of the Cuban National Citrus Development Program in 1967, several research and technological innovations have been made in order to know the behavior of different physiological processes influencing yields under the edaphoclimatic conditions of the country, taking into account the peculiarities of climate associated to different citrus ecosystems [2] .
On the other hand, since the early 90s, the country has been involved in actions related to global climate change, including the adoption of international commitments within the context of United Nations Frame Convention on Climate Change (UNFCCC); the evaluation of impacts and adaptation measures in order to reduce the negative effects and make good use of the positive ones; the establishment of the national balance for emissions of greenhouse gases (GHG) with the lowest possible uncertainty level and the identification of mitigation alternatives to improve it and the submission of National Communications to the Conference of the Parties.
In this regard, the methodologies recommended by the UNFCCC between 1990 and 2002 to determine the corresponding emissions and removal of greenhouse gases, have been used. Such methodologies include the Revised Guides of the Intergovernmental Board for Climate Change (IPCC) of 1996; the Guides of the IPCC on Good Practices and Management of Uncertainties; some elements of the IPCC Guides on Good Practices in Use, Change in the Use of Land and Forestry and, the IPCC Guides from 2006 [3] .
Since the year 2000, when the Forestry Research Institute took on the responsibility of supplying the national greenhouse gases balance report with the information on the use, Change of Land Use and Forestry, it was intended to include the largest possible variety of data using the calculation system established for that module by the IPCC [4] , adding up everything relative to Non-Forest Trees, that initially had three categories: Citrus Groves; Other Fruit Crops and Royal Palm.
For citrus and other fruit crops, the system asks for three basic values to perform estimates: grove area, annual average increase of dry mass per hectare and carbon fraction in wood. The grove area was requested to the Fruits Corporate Group and as there were no national estimates for the other two values, default data supplied by the IPCC methodology were considered for such cases (6.80 ktms∙ha−1a−1 and 0.45 ktms∙ha−1a−1, respectively).
However, the uncertainty levels originated by the use of default data, estimated for environmental conditions —sometimes very different from Cuba’s—the usual absence of reports containing these indicators in the national balances of other tropical countries and the existence of national actions to obtain their own estimates for these two values, caused that finally, the contribution of removing carbon emitted by existing fruit groves was not included in the Cuban national balances for the 1990-2004 period [3] .
For similar reasons, evaluations aimed at identifying mitigation alternatives to be assessed by agricultural enterprises from the Ministry of Agriculture (MINAG) and with private forms of production based on the establishment and/or management of fruit groves, have not been implemented so far.
These issues have caused, on one hand, an underestimation of the net national balance of greenhouse gases emissions by not deducting from the country’s emissions the removal carried out by fruit crops, and on the other hand, they have caused a limitation to assess the expected results from fruit groves at agricultural enterprises by not considering the carbon retention among those environmental services generating them.
In forest tree species, it is common to estimate the tree volume by different methods among which Smalian’s [5] is very popular. The multiplication of the volume by the wood basic density permits to calculate the dry biomass of the trunk and this one, multiplied by the carbon coefficient of the species, makes easier the estimation of the carbon retained by the stem. This value is later on complemented with the use of the biomass expansion factor to estimate the total carbon retained by the aerial biomass of the tree [6] .
In other cases, the dimensional analysis or allometry is used. It consists in studying the change in the size of some parts of an organism as the result of the growth of relating components or variables difficult to be measured (biomass and foliar area), with easier variables to be measured: height, diameter and basal area [7] . These methods’ equations are widely used to quantify biomass and carbon content in coniferous species [8] . In some fruit species such as mango (Mangifera indica L.) and cacao (Theobroma cacao L.) the allometric equations have been generated by destructive sampling of the plant material to asses biomass content and carbon dioxide retention [9] .
However, commercial citrus groves do not match what is said before, because firstly the volume is not regular since it does not matter for fruit production, so a not recognized standard method exists; secondly, trees belong to two species: the rootstock on which the scion that makes up the aerial part of the tree is grafted; and thirdly, the shape of the tree responds to productive and commercial interests like small-size trees, with a main trunk and a height of 50 cm - 80 cm (the rootstock and the scion), where main thick branches are inserted (first branching level) that support a large and low canopy [10] .
The above-mentioned elements were the basis leading to this research aimed at obtaining models that allow the first quantitative estimation of carbon retention of citrus groves under Cuba’s conditions.
2. Materials and Methods
The trial was done in commercial citrus groves of Artemisa province, Cuba, located at 22˚55' North and 82˚40' West. Cuba’s climate is tropical, seasonally humid, with sea influence and semicontinentality features [11] [12] . It has a rainy summer season, suitable to grow citrus from the agrobioclimatic point of view [13] .
Ten sweet orange “Valencia Late” [Citrus sinensis (L) Osbeck] adult trees, 35 years old, spaced at 5 m × 8 m (40 m2 of vital area per tree) were randomly selected and also 10 “Marsh Seedless” grapefruit trees (Citrus paradisi Macf.), 30 years old, spaced at 5 m × 10 m (50 m2 of vital area per tree). Both species were grafted on sour orange (Citrus aurantium L.) and planted on a typical red ferralitic soil [14] in unirrigated conditions with a nitrogen NO3 carrier (34% purity, 250 - 280 Kg∙ha−1), a phosphorus P2O5 carrier (60 Kg∙ha−1), a potassium K2O carrier (160 Kg∙ha−1) and a magnesium MgO carrier (35 Kg∙ha−1).
Quantitative Determinations of Carbon Retention by Groves of “Valencia Late” Orange and “Marsh Seedless” Grapefruit
In order to determine the carbon retention by the aerial parts of orange and grapefruit trees, the following issues were considered:
Determination of the total mean quantity of carbon retained by the aerial part of the tree using a destructive sampling method (Pattern Method).
Determination of the total mean quantity of carbon retained by the aerial part of the tree using two Allometric Methods.
Determination of the most effective Allometric Method to estimate the carbon retention in the aerial part of orange and grapefruit trees.
a) Determination of the total mean quantity of carbon retained by the aerial part of the tree using a destructive sampling method (Pattern Method)
Determinations were done through a destructive sampling method. The total tree volume, wood densities, green and dry biomass were calculated, a necessary information to formulate evaluated methods.
1) Volume estimation
Each tree was cut and sectioned in four pieces that were separated and identified:
The trunk, cut down at the base-end at a height of 10 cm - 15 cm above the soil and the higher limit, below the insertion point of main branches.
Main branches, understood from the insertion point of the trunk to the point with a diameter of 3 cm; in case of branching, the thickest branch was followed.
Secondary branches, those with a diameter of up to 3 cm.
Foliage included all woody material with a diameter below 3 cm in the thickest end plus all foliar material.
In trunk and main branches both ends circumference (precision of ± 0.001 m) and the length (precision of ± 0.01 m) were measured. Trunk volume and main branches was estimated using the expression of the truncated cone:

where: V—volumen (m3)
r1—one end radius (m)
r2—another end radius (m)
h—length between both ends (m)
π—constant (3.141592654)
The total volume of main branches was calculated as the sum of the volume of each of them.
2) Wood density estimation
Green wood samples were taken at the trunk base and main branches of 3 cm × 3 cm (length by width), which were transferred to the lab where the green density was estimated (the ratio between green mass and green volume in kg∙m−3). After this determination, samples were heat-dried at 110˚C till obtaining three consecutive values equal to dry mass. From this value, the basic density of each component was estimated (the ratio between anhidric mass and green volume in kg∙m−3).
3) Biomass estimation (green and dry)
Green biomass was determined by weighing each section separately from the aerial part of the tree (precision of ±0.1 kg). Dry biomass from the trunk and main branches of each tree was estimated as the result of green volume by the basic density (kg).
In order to estimate the dry biomass of secondary branches, the ratio of the water contained in main branches was first estimated from the ratio between the difference of the green mass and the dry mass, with respect to green mass. The resulting value was assumed to be the same for secondary branches. The dry biomass from secondary branches was calculated through the expression:

where: MSrs—dry mass of secondary branches (kg)
MVrs—green mass of secondary branches (kg)
PA—water rate In order to determine the dry biomass of the foliage, a leaf sample from each tree was taken (including wood and leaves), they were weighed at the lab while green; then they were heat-dried at 110˚C till reaching equal consecutive values. The ratio between both masses was calculated.
Root biomass was excluded from field measurements. The value reported by [15] was taken for orange, where the total weight of the aerial part and the root is a 70/30 ratio of the total biomass of the tree. This ratio was used for the two evaluated species.
The carbon content of each section of the aerial part of the tree was estimated as the result of the dry biomass by the corresponding carbon coefficient and the total carbon retention. For the trunk, branches (main and secondary) and the root, the coefficient used was 0.4413, while for the foliage the value used was 0.4080 [16] .
The accumulated values by canopy section and the total for the group of trees from each species were calculated taking as 100% the total accumulated. The corresponding ratio of retained carbon by every section of each studied species was also estimated.
The result of each section was evaluated as to the mean (X), standard deviation (DEx), the confidence interval (P ≤ 0.05), the variation coefficient (VC) and sample size (random sampling without replacement; (P ≤ 0.05). The mean of each section for both species was compared by the Student Test (P ≤ 0.05).
From the results, 23 variables were identified as shown in Table 1, whose ratios were established by the simple correlation analysis; all correlations with r ≥ 0.80 were identified as “relations of interest”.
These relations of interest were separated and submitted to an analysis that took into consideration the magnitude of the correlation (r value) with the total carbon content, on the one hand, and the possibility of measuring the independent variable in the aerial part of the tree without cutting it, on the other hand. Once the best ratios were selected, a simple lineal regression analysis was applied to theoretically estimate the total carbon content of the aerial part of the tree.
b) Determinations of the total mean quantity of carbon retained by the aerial part of the tree by two Allometric Methods
By using the evaluated allometric methods, work was done to reach estimates of the mean carbon quantity retained by the aerial part of the tree without affecting trees and reducing expenses of field work as much as possible.
1) Allometric Method 1. It looks forward to reduce field work by measuring the circumference at the trunk

Table 1 . Identified variables for the evaluation of the Allometric Methods 1 and 2.
base and on the ends of each main branch representative of the canopy as a whole, selected by visual observation and the count of all branches to estimate the total carbon content for an average tree once the estimated total volume was transformed to dry mass.
The circumference of higher average and the mean length of main branches were determined for each tree. By graphically representing the circumference vs. length, the branch located at the shortest distance from average values was identified and it was chosen as the representative main branch. With the values of the quantity of main branches (CR), the circumferences of the main branch chosen (r1 and r2), the length (h), the mean basic density of the branches (BDSB) and data obtained in a), it was possible to reach the Allometric Method 1 with the following values:
ü Volume estimation of the representative main branch: .
.
ü Volume estimation of all main branches of the tree: VTRP = CR * VRP
ü Estimation of the dry biomass of all main branches of the tree: DMSB = VTRP * DBRP (average values by specie: DBRPOrange = 670.8 kg∙m−3;
ü DBRPGrapefruit = 664.0 kg∙m−3)
ü Estimation of the total carbon content (TCC; kg) of the aerial part of the tree, for which a simple lineal regression between dry biomass of main branches (independent variable) and the total carbon content (dependent variable), was used as well as data from field determinations as the pattern model.
2) Allometric Method 2. It looks forward to reduce field work by measuring the circumference at the trunk base and on the ends of each main branch as well as the length, so from the volume of main branches and using the relationship among controlled variables, it estimates the total carbon content of an average tree.
c) Determinations of the most effective Allometric Method to calculate carbon retention by the aerial part of orange and grapefruit trees
The results of the total average carbon (kg), the standard deviation (kg), confidence intervals, the mean (kg) and the variation coefficient (%) of each method were included in a table. In addition, the relative difference between the mean of the Pattern Method and the Allometric Methods 1 and 2. The range of expected values for the mean carbon retention per tree in each model was graphically represented.
The null hypothesis:
Ho: PMP = PM1 = PM2
Where PMP, PM1 and PM2 are the averages (P) of each method. It was confirmed through an analysis of variance of double classification, (P ≤ 0.05), using the model:

where: Yijk—value of the retained carbon
µ—general mean
τi—effect of the method
βj—effect of the aerial part of the tree eijk—experimental error In order to graphically represent the results of both allometric methods as compared to the pattern model, three simple linear regression analyses were done, using all of them the independent variable of the total dry biomass (aerial + roots) of the tree, while as dependent variable the first analysis used the carbon retention of the Pattern Method; the second one used the carbon retention of the Allometric Method 1 and the third one, the carbon retention of the Allometric Method 2.
3. Results
Quantitative Determinations of Carbon Retained by Groves of “Valencia Late” Orange and “Marsh Seedless” Grapefruit
a) Determination of the total mean quantity of carbon retained by the aerial part of the tree using a destructive sampling method (Pattern Method)
The results of both species are shown in Table 2 where “Marsh Seedless” grapefruit retains an average quantity of carbon (C) from 10.6 tC∙ha−1 - 16.6 tC∙ha−1, while “Valencia Late” orange does it from 12.9 tC∙ha−1 - 19.7 tC∙ha−1, with a slight difference between both species that varies from 2.3 tC∙ha−1 to 3.1 tC∙ha−1.
In both species the highest quantity of carbon is concentrated in the branches which contain from 46% to 53% of total carbon, and the lowest quantity is retained in the trunk, from 6.2% to 6.4% of the total carbon in the tree. The quantity retained by the foliage is also similar for both species, 23.9%, while the content in secondary branches shows the highest difference ranging from 16.9% - 23.4%, according to the specie.
In “Valencia Late” orange, out of every kilogram of carbon present in secondary branches, 3.14 kg is accumulated in main branches, while in “Marsh Seedless” grapefruit this ratio is only 1.98 kg, which might be related to physiology, anatomy, management and other features distinguishing both species.
The variability inherent to variables of the aerial part is in the range of low to medium in both species (orange: 23% - 46%, grapefruit: 22% - 43%), which permits to suppose that for these evaluations is convenient to use a sample size higher than the one allowed for destructive sampling, in order to reach more accurate results. It was confirmed by the theoretical sample sizes estimated for each section of the aerial part of the tree shown in Table 2 (in general, it should be between 35 and 45 trees).
Relative to the comparison of carbon retention values estimated for each section and for the total, both values of secondary branches, the aerial part and the total, were statistically different between species and the grapefruit trees exceeded orange trees.
b) Determinations of the total mean quantity of carbon retained by the aerial part of the tree by two Allometric Methods
Table 2. Mean carbon retention by section and tree’s aerial portion “Valencia Late” orange and “Marsh Seedless” grapefruit according to the Pattern Method. Stadigraphs determination results, n = 10 trees per species.
Allometric Method 1 The results of estimating the Dry Biomass of Main Branches and the Total Carbon Content (TCCM1 = 25.7500 + 0.8620 DMSB; R2 = 0.9478) are shown in Table 3 for “Valencia Late” orange and in Table 4 for “Marsh Seedless” grapefruit (TCCM1 = 30.3700 + 0.7860 DMSB; R2 = 0.8019).
The regression for the first species (TCCMP = ƒ [TCCM1]) is given by: ƒ (TCCM1) = ƒ(x) y TCCMP = y, having the function y = 0.7330x + 21.22. For grapefruit, the regression (TCCMP = ƒ [TCCM1]) is y = 0.3920x + 38.4800.
The Allometric Method 1 underestimated an 8% of the average value of total carbon retained by the aerial part of the tree (orange) while the rest of the stadigraphs indicate an increase of the magnitudes in relation to the values of the pattern method which means an adjustment of 73.8% (R2 = 0.738) between both methods.
For grapefruit, this method was practically the same to the mean value of retained carbon by the aerial part of the tree estimated by the Pattern Method. Stadigraphs show an increase in the magnitude in relation to values derived from the Pattern Model, with an adjustment of only 32.7% (R2 = 0.327) among estimates.
Allometric Method 2 For orange trees, a total of 24 pairs of variables reached or exceeded the minimum limit of interest (r ≥ 0.80); while in grapefruit trees 26 pairs of variables reached these conditions (Table 5 and Table 6). In orange trees, five ratios were used and six in grapefruit. All ratios included the variable Total Carbon Content (TCC), for being the one estimated.
The ratio of major interest was between Dry Mass of Main Branches (DMSB) and the Total Carbon Content (TCC) (variables 13 and 23). In orange trees this ratio is TCC = y; DMSB = x, function y= 0.7860x + 30.3700 which is a ƒ(x), while for grapefruit trees ƒ(x) it is y = 0.8620x + 25.7500.
As the DMSB variable cannot be measured under field conditions without destroying the aerial part of the tree, it was necessary to make an indirect estimate. The ratio between Main Branch Volume (SBV) and Dry Mass of Main Branches (DMSB) (variables 3 and 13) showed a high coefficient of determination, 92.09% in orange (Figure 1) and 82.15% in grapefruit, though in this species the adjustment was lower (Figure 2) in relation to orange’s.
Models were integrated by field measures of the circumferences and length of each main branch of the canopy, the calculation of the VRP variable y and the development of allometric ratios for each studied species:
“Valencia Late” orange:

Table 3. Results of tree top Main Branches Dry Mass (MSRP) calculations and the Total Carbon Content (CCT) assessed by the Pattern Method (CCTMP) and the Allometric Method 1 (CCTM1) for “Valencia Late” orange tree’s aerial portion. Stadigraphs determination results, n = 10 trees per species.
Table 4. Results of tree top Main Branches Dry Mass (MSRP) calculations and the Total Carbon Content (CCT) assessed by the Pattern Method (CCTMP) and the Allometric Method 1 (CCTM1) for “Marsh Seedless” grapefruit tree’s aerial portion. Stadigraphs determination results, n = 10 trees per species.
Table 5. Correlation coefficients of the variable pairs which surpassed the established limit (r ≥ 0.80) “Valencia Late” orange trees.
Table 6. Correlation coefficients of the variable pairs which surpassed the established limit (r ≥ 0.80) “Marsh Seedless” grapefruit trees.
r: Correlation coefficient; R2: Determination coefficient.
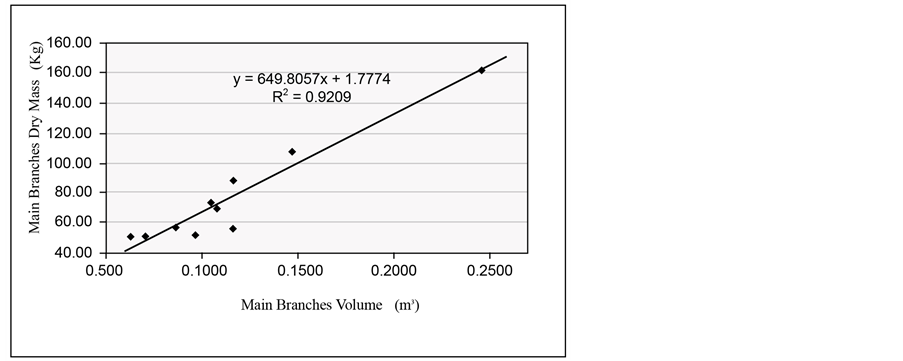
Figure 1. Relation between Main Branches Volume (VRP) and Main Branches Dry Mass (MSRP) in “Valencia Late” orange trees (variables 3 and 13), n = 10 trees.
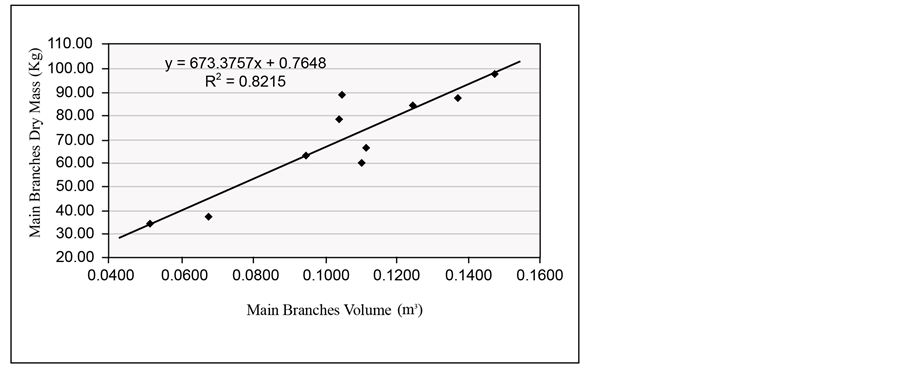
Figure 2. Relation between Main Branches Volume (VRP) and Main Branches Dry Mass (MSRP) “Marsh Seedless” grapefruit trees (variables 3 and 13), n = 10 trees.

“Marsh Seedless” grapefruit:


The results of the volume calculation and the dry biomass of the main branches are shown in Table 7 and Table 8, while the regression (TCC = ƒ [DMSB]) indicates a high control of the variable Total Carbon Content, favorable to estimate: orange y = 0.9896x + 0.9700 and grapefruit y = 0.9550x + 3.0340.
Table7 Results of tree top Main Branches Volume (VRP) and Main Branches Dry Mass (MSRP) calculations. The Total Carbon Content (CCT) was assessed by the Pattern Method (CCTM.P.) and the Allometric Method 2 (CCTM2) for “Valencia Late” orange tree’s aerial portion. Stadigraphs determination results, n = 10 trees per species.
Table8 Results of tree top Main Branches Volume (VRP) and Main Branches Dry Mass (MSRP) calculations. The Total Carbon Content (CCT) was assessed by the Pattern Method (CCTMP) and the Allometric Method 2 (CCTM2) for “Marsh Seedless” grapefruit tree’s aerial portion. Stadigraphs determination results, n = 10 trees per species.
In orange, with the Allometric Method 2 the average value is practically the same of the Pattern Method, while the rest of the variables reduce magnitudes which indicates an adjustment of R2 = 0.855 (85.5%) between both methods.
The performance of the grapefruit is different. With this method the average value 9.18% is underestimated in relation to the mean obtained with the estimation of the Pattern Method. The rest of the evaluated variables show a reduction of the magnitudes with an adjustment of R2 = 0.595 (59.5%) between estimated values per tree by both methods.
c) Determination of the most effective Allometric Method to calculate the carbon retention by the aerial part of the tree
a) “Valencia Late” orange
Table 9 shows the results of the three methods and Figure 3 the range of expected values for the sampling mean by method, taking confidence intervals into consideration.
The comparison of the means in the three methods by the analysis of variance, permitted to accept the equality between them. Figure 4 shows the tendency followed by the Allometric Methods as compared to the Pattern
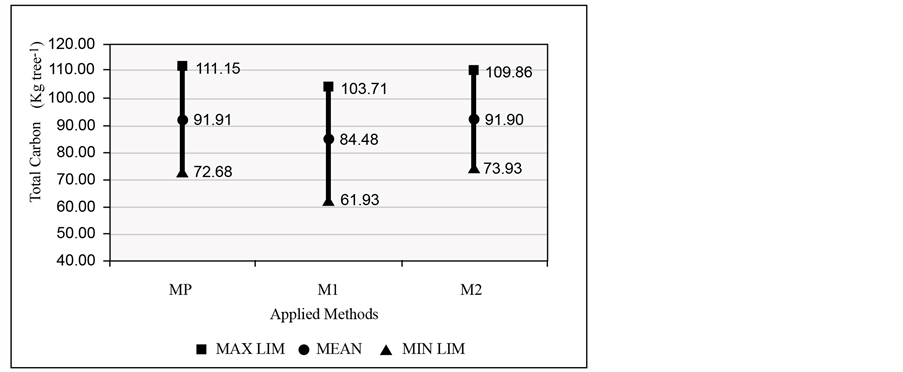
Figure 3. Range of expected values for the Total Carbon Content sample means by the three developed methods: Pattern (MP), Allometric 1 (M1) and Allometric 2 (M2) in “Valencia Late” orange trees. Student’s test results (P ≤ 0.05).
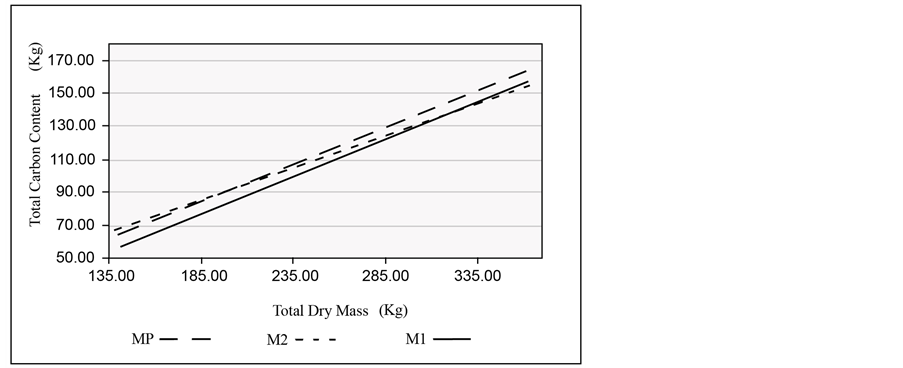
Figure 4. Relation between Total Carbon Content estimates by the three developed methods: Pattern (MP), Allometric 1 (M1) and Allometric 2 (M2) and the increase in Total Dry Mass of “Valencia Late” orange trees, n = 10 datas for each regression.
Table 9. Total Carbon Content estimation by the three developed methods: Pattern, Allometric 1 and Allometric 2 for “Valencia Late” orange trees. Stadigraphs determination results, n = 10 trees per species.
Method. As Total Dry Biomass of the aerial part of the tree increases, the estimation of the Total Carbon Content by the Allometric Method 2 has a lower deviation regarding estimations done by the Pattern Method as compared to the Allometric Method 1.
2) “Marsh Seedless” grapefruit
Table 10 shows the results of the three methods and Figure 5 shows the range of the expected values for the sampling mean by the methods, taking confidence intervals into consideration.
The comparison of the means in the three methods by the analysis of variance, permitted to accept the equality between them. Figure 6 shows the trend followed by the Allometric Methods as compared to the Pattern Method, the increase Total Dry Biomass of the aerial part of the tree has a lineal positive relation with the Total Carbon Content estimated by the Allometric Method 1, which recorded less than the Pattern Method. When it is estimated by the Allometric Method 2, deviations are higher.
4. Discussion
Quantitative Determinations of Carbon Retention by Groves of “Valencia Late” Orange and “Marsh Seedless” Grapefruit
According to the characteristics of the area where this research was done, “Valencia Late” orange trees retained an accumulated carbon at 35 years old of around 73 kg and 111 kg of carbon by the aerial part of the tree. Thus, a planting density of 250 trees ha−1 would be equivalent to 18.25 tC∙ha−1 - 27.75 tC∙ha−1, for a mean annual carbon increase of 0.52 tC ha−1a−1 to 0.79 tC ha−1a−1, while “Marsh Seedless” grapefruit trees retain an accumulated carbon at 30 years old of 81 kg to 106 kg of carbon. For a planting density of 200 trees ha−1 the equivalent would be 16.21 tC∙ha−1 - 21.37 tC∙ha−1, with a mean annual carbon increase of 0.69 tC∙ha−1a−1 and 0.91 tC ha−1a−1.
Mota et al. [16] , from the Plant Nutrition Department of the Higher Council of Scientific Research from Murcia, Spain, has made similar research to this one. They used 15 years old lemon trees with 280 trees ha−1, orange and mandarin 420 trees ha−1, located at the South East of Spain, near 37˚58' North and 1˚07' West. In this location, climate is typically Mediterranean, modified by the influence of the land marked by aridity, scarce rains, with annual averages in coastal areas of 300 mm, concentrated mainly in autumn, when heavy showers can bring about rains of up to 200 mm in a few hours. Annual temperature reaches an average of 18˚C in areas closer to the coast, so there is practically no winter [17] .
Iglesias et al. [18] , from the Citriculture and Plant Production Department of the Valencian Institute of Agricultural Research in Spain, have made similar research using 2 to 12 years old orange trees with 500 trees ha−1, located in the Southeast of Spain, close to 39˚28' North and 0˚21' West. In this site, climate is typically Mediterranean, with short and mild winters—as a result of the sea influence—and long hot summers; the annual mean temperature is 17˚C, with absolute maximum around 36˚C and minimum of −1˚C. Rainfall is scarce and heavy though they do not exceed 450 mm per year; the rainiest season in autumn [17] .
The comparison of the results of the three research, indicates that in the case of Mota et al. [16] , only tangerine trees reported a carbon annual mean increase in the results range of sweet orange and grapefruit in Cuba, while sweet orange and lemon trees showed much higher increase; however, in the case of Iglesias et al. [18] , the reported value for orange trees matches the results of this research.
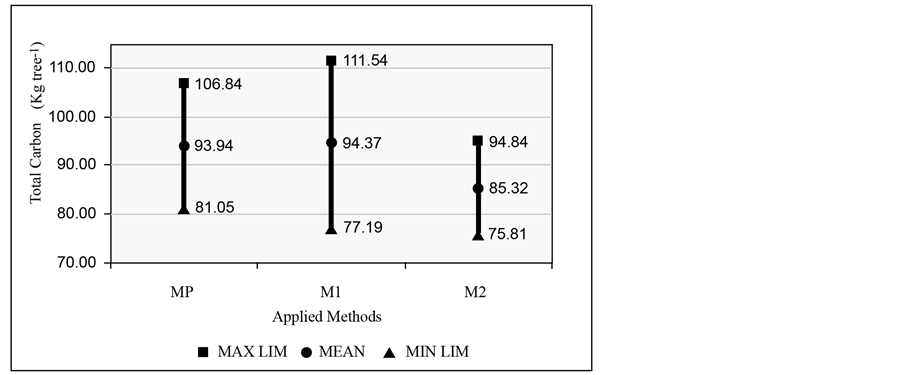
Figure 5. Range of expected values for the Total Carbon Content sample means by the three developed methods: Pattern (MP), Allometric 1 (M1) and Allometric 2 (M2) in “Marsh Seedless” grapefruit trees. Student’s test results (P ≤ 0.05).
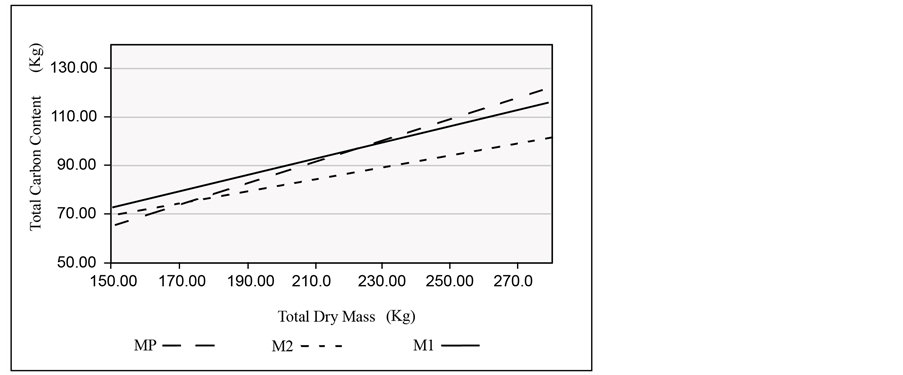
Figure 6. Relation between Total Carbon Content estimates by the three developed methods: Pattern (MP), Allometric 1 (M1) and Allometric 2 (M2) and the increase in Total Dry Mass of “Marsh Seedless” grapefruit trees, n = 10 datas for each regression.
The differences found among these trials should be caused, among other issues, by those related to soil characteristics and the use of different irrigation techniques for both conditions. According to Iglesias et al. [18] the use of drip irrigation in groves not only damage the capture of CO2, but also improves the net balance by keeping soil moisture and weeds from increasing the CO2 emissions to the atmosphere. Another difference can be related to the age of the evaluated groves.
This last indicator has an important influence on the value of the mean annual growth since it changes with the tree age and according to the three growth periods: the initial or establishment, the intermediate or growth and the final or maturity. This whole set generates the classic sigmoid curve, for the behavior of this variable in time. The results of Iglesias et al. [18] fully match with the intermediate period, where growth reach maximum values, while in the case of the results of this research; such growth matches the final period.
However, the marked difference of orange trees in two not-too-distant regions among themselves (180 aerial km) within the same country, with quite similar climates, using similar planting densities and with groves of similar age, it is not easy to explain with the available arguments which reinforces the convenience of repeating
Table 10. Total Carbon Content estimation by the three developed methods: Pattern, Allometric 1 and Allometric 2 for “Marsh Seedless” grapefruit trees. Stadigraphs determination results, n = 10 trees per species.
these evaluations, both in orange and grapefruit groves under other different environments within Cuba in order to validate the attained results with more certainty.
This is a very important aspect since among all components making up the grove; soil is the only one whose carbon content can indefinitely increase, thus turning soil into its main deposit.
Iglesias et al. [18] dealt with this issue in their research considering them as grove components that contributed carbon to the soil with the organs drop (flowers, fruits and leaves), as well as pruning wastes. A single two years old orange tree can contribute with 17.1 gCa−1, reaching up to 5 thousand 242.4 gCa−1 at 12 years old, so with a planting density of 200 - 250 trees ha−1 it would be a contribution from 3.42 kgC∙ha−1 a−1 - 4.28 kgC∙ha−1 a-1 at the second year and between 1.05 kgC∙ha−1 a−1 - 1.31 tC∙ha−1a−1 at the 12th year.
In this way, these authors determined that under the conditions their research was done, at the 12th year, an orange tree accumulated 38.66 kgC in its structures and additionally, that very year delivered 10.21 kgC for fruit formation and provided the soil with 5.24 kgC, for a general total of 54.10 kgC, equivalent to the removal of 198.36 kg of atmospheric CO2 per tree that year.
Regarding the development of allometric methods to estimate the carbon retained by fruit trees, including citrus, it was not possible to find references, probably because this topic is not of interest to the targets of traditional fruit growing.
5. Conclusions
The methods used (Pattern and Allometric Methods 1 and 2) were effective to obtain a first quantitative approximation of carbon retention in groves of “Valencia Late” orange and “Marsh Seedless” grapefruit under Cuba’s edaphoclimatic conditions.
Under equal conditions, the Allometric Method 2 is more accurate to estimate the Total Carbon Content in groves of “Valencia Late” orange, while in groves of “Marsh Seedless” grapefruit, the Allometric Method 1 provided the best estimate.
References
- Albrigo, L.G., Buker, R.S., Burns, J.K., Castle, W.S., Clayton, S.F., Ronald, W.M., Muraro, P., Rogers, M.E., Syvertsen, J.P., Timmer, L.W., Attaway, J., Bowman, K., Hancock, K.W., Ritenour, M.A., Spyke, P.D. and Vachon, R.C. (2005) The Impact of Four Hurricanes in 2004 on the Florida Citrus Industry: Experiences and Lessons Learned. Proceedings of the Florida State Horticultural Society, 118, 66-74.
- Betancourt, M. (2010) Incidencia de los Efectos de Cambio Climatico sobre la Formacion de los Rendimientos en Citricos y Mango. Diseno de Nuevas Tecnologias. Proyecto del Programa Ramal Preservacion de los Recursos Naturales. Ministerio de la Agricultura, Cuba.
- Lopez, C., Fernandez, P.V., Manso, R., Valdes, A., Leon, A., Guevara, A.V., Gonzalez, C., Martinez, E., Rodriguez, N., Davalos, J., Garcia, M.E., Biart, R., Lopez, I., Perez, D., Ricardo, H., Pire, S.F., Ameneiros, J.M., Mercadet, A. and Alvarez, A. (2007) Gases de Efecto Invernadero. Emisiones y Remociones. Cuba 1990-2002. ETGEI, La Habana.
- IPCC (Intergovernmental Panel on Climate Change) (2007) Informe de Sintesis. Contribucion de los Grupos de Trabajo I, II y III al Cuarto Informe de Evaluacion del Grupo Intergubernamental de Expertos sobre el Cambio Climatico. Pachauri, R. K. and A. Reisinge (Eds). Geneva, Switzerland, 104 p.
- Azuaje, J. (2010) Manual de Medicion y Cubicacion Forestal: Uso de la Formula de Smalian. Direccion General de Bosques, Ministerio del Poder Popular para el Ambiente, República de Venezuela, 19 p.
- BosquesPROcarbono (2011) Cuantificacion del carbono.http://www.uach.cl/procarbono/cuantificacion_del_carbono.html
- Diaz-Franco, R., Acosta-Mireles, M., Carrillo-Anzures, F., Buendia-Rodriguez, E., Flores-Ayala, E. and Etchevers-Barra, J.D. (2007) Determinacion de Ecuaciones Alometricas para Estimar Biomasa y Carbono en Pinus patula Schl. et Cham. Madera y Bosques, 13, 25-34.
- Mendez-Gonzalez, J., Luckie-Navarrete, S.L., Capo-Arteaga, M.A. and Najera-Luna, J.A. (2011) Ecuaciones Alometricas y Estimacion de Incrementos en Biomasa Aerea y Carbono en una Plantacion Mixta de Pinus devoniana Lindl. y P. pseudostrobus Lindl., en Guanajuato, Mexico. Agrociencia, 45, 479-491.
- Concha, J.Y., Alegre, J.C. and Pocomucha, V. (2007) Determinacion de las Reservas de Carbono en la Biomasa Aerea de Sistemas Agroforestales de Theobroma cacao L. en el Departamento de San Martin, Perú. Ecologia Aplicada, 6, 75-82.
- Agusti, M. (2010) Citricultura. Ediciones Mundi-Prensa, Madrid, Espana, 456 p.
- Lecha, L., Paz, L. and Lapinel, B. (1994) El clima de Cuba. In: Lecha, L., Paz, L. and Lapinel, B., Eds., El clima de Cuba, Academia, La Habana, Cuba, 186 p.
- Lima, H., Cornide, M.T., Alvarez, M. and Frometa, E. (1988) Clasificacion edafoclimatica de las localidades citricolas en Cuba. Agrotecnia de Cuba, 20, 63-74.
- Le Houerou, H.N., Popo, G. and See, L. (1993) Agro Bioclimatic Classification of Africa. Food and Agriculture Organization. FAO Agrometeorology Series, Rome, 228 p.
- Cuba (1999) Nueva Version de Clasificacion Genetica de los Suelos de Cuba. AGRINFOR—MINAG. La Habana, Cuba, 64 p.
- Morgan, K.T., Scholberg, J.M.S., Obreza, T.A. and Wheaton, T.A. (2006) Biomass and Nitrogen Relationships with Sweet Orange Tree Growth. Journal of the American Society for Horticultural Science, 131, 149-156.
- Mota, C., Alcaraz-Lopez, C., Iglesias, M., Martinez-Ballesta, M.C. and Carvajal, M. (2012) Investigacion sobre la Absorcion de CO2 por los Cultivos mas Representativos de la Region de Murcia. Dpto. de Nutricion Vegetal, Consejo. Sup. Invest. Cientificas., Murcia, Espana, 43 p.
- Microsoft-Encarta, Microsoft Corporation, EUA, 2007.
- Iglesias, J.I., Quinones, A., Martinez, B., Forner-Giner, M.A., Legaz, F. and Primo-Millo, E. (2010) La huella del carbono en plantaciones de citricos. Dpto. Citricultura y Produccion Vegetal, Instituto Valenciano de Investigaciones Agrarias, Espana, 23 p.
NOTES

*Corresponding author.