American Journal of Climate Change
Vol. 2 No. 3A (2013) , Article ID: 37300 , 11 pages DOI:10.4236/ajcc.2013.23A002
Track Patterns of Landfalling and Coastal Tropical Cyclones in the Atlantic Basin, Their Relationship with the North Atlantic Oscillation (NAO), and the Potential Effect of Global Warming
Department of Oceanography and Coastal Sciences, School of the Coast and Environment, Louisiana State University, Baton Rouge, USA
Email: tmcclo1@tigers.lsu.edu
Copyright © 2013 Terrence A. McCloskey et al. This is an open access article distributed under the Creative Commons Attribution License, which permits unrestricted use, distribution, and reproduction in any medium, provided the original work is properly cited.
Received June 13, 2013; revised July 16, 2013; accepted August 12, 2013
Keywords: Tropical Cyclone Tracks; North Atlantic Basin; NAO; Bermuda High; Recurvature; Hurricanes; Landfall Locations; Climate Change
ABSTRACT
Even though the degree of damage inflicted by North Atlantic tropical cyclones (TCs) is highly dependent upon track location and proximity to land, the spatial characteristics of TCs are generally understudied. We investigated the spatial relationships between landfall locations and track patterns of all Cape Verde-type landfalling and coastal TCs that have affected the continental coastline of the western Atlantic Basin by region for the period 1851-2008. The degree of recurvature for these TCs increases progressively from the Central America/Caribbean coast (CA) through the Gulf of Mexico (GOM), Florida peninsula (FLOR), and Atlantic (ATL) coasts. The date (month) of occurrence shows similar increases from the GOM through ATL. These patterns for landfall location, track pattern, and occurrence date generally follow the intra-seasonal movement and intensity variations of the Bermuda High (BH), as represented by increasing North Atlantic Oscillation (NAO) index values from CA through FLOR. Analysis suggests that the region of landfall is primarily controlled by two factors: the amplitude of track recurvature and the longitude at which recurvature begins to dominate track shape. Both of these important steering controls are predominantly influenced by the strength and position of the BH, with increasing strength and/or more northeasterly position of the BH progressively driving landfall from Central America through the Gulf of Mexico and the Atlantic seaboard out to the open sea. The paleorecord suggests that the latitudinal position of the BH exerts an important control over the location of hurricane landfall along the western North Atlantic on millennial time scales. This suggests that global warming may result in a northern shift in TC tracks and increased frequency of landfalls in northern locations.
1. Introduction
As more than 50% of all tropical cyclones (TCs) formed in the Atlantic Basin eventually make landfall along the continental coastline of the western Atlantic Basin, causing annual average damages in the billions of US dollars [1,2], any significant change in TC behavior can be expected to have important societal impacts. Although much effort has been focused on potential changes in TC frequency and intensity as a result of future climate changes [3-7], spatial considerations, especially in regard to track patterns and landfall location, have generated substantially less discussion. From a climatological as well as societal viewpoint, however, proximity to land and point of landfall are of great importance. For this reason, it is important to gain a better understanding of the relationship between track patterns and landfall location.
Track pattern has long been an understudied subject in TC research. Although maps displaying regional changes in TC location, point of origin, frequency or intensity under differing climatological conditions are fairly common [8-11], until recently the effects of track have rarely been discussed. However, several recent studies based on clustering techniques have begun elucidating the relationship between climatic conditions and track trajectories. Elsner [12] used a k-means clustering method to identify three main TC track shapes in the North Atlantic, finding that negative North Atlantic Oscillation (NAO) values are associated with both a specific track pattern (“straight moving”) and geographical location (more southern landfall). A similar study was conducted in the North Pacific, also documenting a correlation between track pattern/landfall location and El Niño/Southern Oscillation (ENSO) conditions [13]. A k-means clustering technique, extended to include mass moments, was applied to North Atlantic TCs [14], while a probabilistic clustering method based on regression mixture models has been applied to TCs in the western North Pacific [15], eastern North Pacific [16], North Atlantic [17], and extratropical cyclones in the North Atlantic [18]. Latitudinal and longitudinal boundaries have been used to group TCs, resulting in track shape groups, for both the North Atlantic [19] and southwestern Indian Ocean [20]. In all these studies, specific track trajectories, though not the main focus of the investigation, are, to varying extents, associated with specific track clusters and/or climatic conditions.
These studies have generally followed a similar methodology, using mathematical methods to group cyclone tracks into spatially coherent clusters, which are then analyzed in regards to a number of climatological features, such as NAO, Atlantic Meridional Mode (AMM), ENSO, Madden-Julian oscillation (MJO), seasonality, and intensity. Here we used a reverse approach. Instead of focusing on the tracks of all TCs, we started with the coastal locations of all landfalling TCs or coastal TCs (those that came within 50 km of a continental coastline) that crossed the Atlantic Ocean from the east (i.e., the Cape Verde TCs) (66% of total TC) with maximum wind speed ≥ 35 knots and affected various regions of the continental coastline from 1851 to 2008. We grouped these TCs by landfall (near landfall) region to examine the relationship between their track patterns and an associated climate condition, the NAO, to elucidate their steering mechanisms. Our research was motivated by the hypotheses that landfalling or coastal TCs that affected different regions of the North American coastline (e.g., Atlantic seaboard versus Central America/Caribbean) tend to have distinctly different track patterns, and that these different track patterns reflect different steering mechanisms associated with different NAO conditions. It is well known that several other large climatological variables, especially ENSO [21], AMM [17], the Atlantic Multidecadal Oscillation (AMO) [22], the MJO [9], and the Atlantic Warm Pool [23] exert important influences over TC frequency and location. However, in this paper we focus on the NAO at the exclusion of the other climatic drivers in order to maximize the number of cases in each group. Subdividing each set by several different climate variables (i.e. Landfalling Major Hurricanes along the Central American coast under positive NAO, warm AMO, cold ENSO conditions) would have reduced the number of TCs in many sets below useful levels. For that same reason we included all TCs since 1851, although doing so eliminates the consideration of such important meteorological features as mid-latitude fronts and west African thunderstorms, since NCEP/NCAR Reanalysis data only extends to 1948. Our methodology is based on the rationale that the variability in the various climatic and meteorological conditions is minimized by using larger data sets. Although the NAO is only one of many features controlling the steering of NA TCs, it is likely the most significant. Focusing on the NAO permits us to evaluate its effect on TC tracks and the subsequent effect of climate-driven movement of the North Atlantic circulation system.
2. Methods
North Atlantic TCs do not form a single homogenous group. The two most distinct subgroups, the Cape Verde and the Western Caribbean TCs, differ in point of origin, track shape and key climatic/atmospheric controls (Figure 1). The Cape Verde TCs form from easterly waves originating off the west coast of Africa, and are heavily influenced by conditions in the main development region (MDR) (10˚N - 20˚N) of the Atlantic [24]. Cape Verde TCs typically display a “C” shape track, as after drifting west across the tropical Atlantic, they move first to the north and then eastward, driven by the mid-latitude westerlies (Figure 1(b)). As indicated by their name, Western Caribbean TCs form in either the western Caribbean or the Gulf of Mexico, are not influenced by conditions in the MDR and generally display a northward moving track (Figure 1(a)). Because of these basic differences, it is necessary to analyze these groups separately in order to correctly identify the associated atmospheric conditions involved with specific areas of landfall. For this paper we consider only the Cape Verde TC set; therefore all TCs originating within the Caribbean Sea west of 68˚W (the eastern tip of Hispaniola), or the Gulf of Mexico were removed (inset, Figure 1(a)). Also eliminated were all storms that started as subtropical cyclones.
All TC tracks that achieved a maximum wind speed of ≥35 knots for the period 1851-2008 were downloaded from the National Hurricane Center “best track” database (http://www.nhc.noaa.gov/pastall.shtml). Data are presented as separate segments, each detailing the TC’s geographic coordinates and such physical features as maximum wind speed and atmospheric pressure (when available) taken at six-hour intervals for the life of the TC. Each TC has a unique identifying number which can be used to combine the individual segments into a single
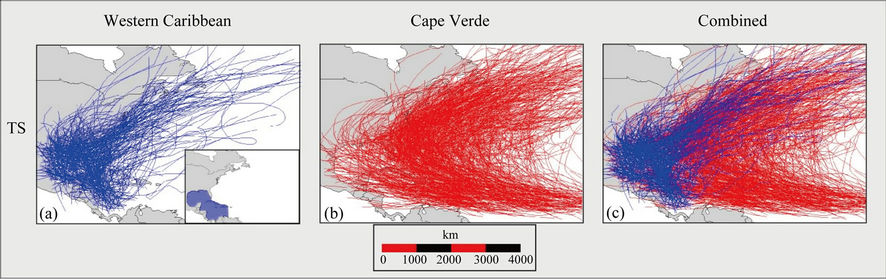
Figure 1. Differentiation of Western Caribbean and Cape Verde-type tropical cyclones. Shown are all the Western Caribbean (a) and Cape Verde (b) type tropical cyclones of tropical storm strength and above occurring in the North Atlantic for the period 1851-2008. In (c) the Western Caribbean tracks are superimposed on top of the Cape Verde tracks. All TCs whose point of origin occur within the blue shaded area in the inset in (a) were eliminated from the study.
track. All TCs that either intersected (i.e., landfalling TCs) or passed within 50 km of the continental coastline (i.e., coastal TCs) were grouped regionally by location and subdivided by intensity at landfall. A 50 km buffer was used to ensure the inclusion of coast-paralleling TCs that are capable of producing damaging wind and wave effects, even if landfall does not occur. For the same reason we include TCs in all coastal regions where they cross the 50 km buffer, regardless of location of original landfall; i.e., a TC which first makes landfall along the Gulf coast and then crosses a section of the Atlantic coast from the west is included in both TC sets at their respective intensity levels. Four regional landfall groups and a non-landfalling group (NLF) were recognized, including: 1) CA (Caribbean coasts of Central America from Nicaragua through Belize); 2) GOM (entire Mexican coast and Gulf coast from Texas through the Florida panhandle as far as Apalachee Bay [84˚W]); 3) FLOR (the rest of Florida); 4) ATL (Georgia through Newfoundland); 5) NLF (all TCs that did not make landfall or pass within 50 km of continental coastline) (Figure 2).
All TCs are subdivided by maximum intensity at landfall or within the 50 km coastal buffer for landfalling and coastal storm, or over the life of the storm for nonlandfalling storms. Intensity groups are TS (all tropical cyclones of tropical storm strength and above, maximum sustained wind speed ≥ 35 knots), HURR (all hurricanes, category 1 - 5, wind speed ≥ 65 knots), and MAJ (major hurricanes, category ≥ 3, or > 96 knots).
As track shape varies greatly between TCs, a simple “recurvature index” (RI) was created in order to quantify the degree of recurvature, or departure from the horizontal for each track. Merging all six hour segments into a single TC track on ArcView 3.3 provides minimum and maximum values for both latitude and longitude; the RI value is simply the maximum minus minimum latitude (numerator) divided by the maximum minus minimum longitude (denominator). Small values imply a horizontal track path; large values are associated with strongly recurved TCs (Figure 3).
As the RI is a novel attempt to quantify the recurvature of TCs some caveats are worth noting, since spatial factors can influence values. The RI value will be larger for a TC originating in the west than for a TC with an otherwise identical track that originates farther east (unless the termination points lie east of the origin point of the eastern storm). Similarly, a TC that moves due north throughout its life will have a high RI, but no recurvature. However, applying this index solely to the Cape Verde TCs greatly reduces both problems. Longitudinal differences in point of origin are minimal for the Cape Verde TCs, which, unlike the Western Caribbean TCs, are almost entirely lacking in storms with vertical axes (Figures 1, 2, 4). A single RI value was calculated for each TC set by averaging the RI values for all TCs in the set. A North Atlantic Oscillation Index (NAOI) value was assigned to each six-hour TC segment based on the monthly values taken from the University of East Anglia data set (http://www.cru.uea.ac.uk/cru/data/nao), and an average value was calculated for each TC. Two NAOI values were calculated for each TC set: 1) Unweighted (calculated by averaging TC values), and 2) Weighted (calculated by averaging six-hour segment values; longlasting TCs had correspondingly greater influence on set average).
All six-hour TC segments were also tagged with the numerical value of the month(s) in which they occurred (January = 1 through December = 12). Monthly averages were calculated for each TC, which were then averaged to produce an unweighted MONTH value for each TC set. The weighted MONTH value was calculated by averageing the values of all six-hour segments.
3. Results
Track sets display distinctly different patterns by landfall groupings, with consistent regional patterns preserved

Figure 2. Tracks of TCs since 1851 by region of landfall. Regional coast sections are highlighted in row (a). Regional track sets are subset by maximum intensity at landfall: tropical storms, row (b); hurricanes, row (c); and major hurricanes row (d). Row (e) displays the average track for the tropical storm set (row b) for each region.
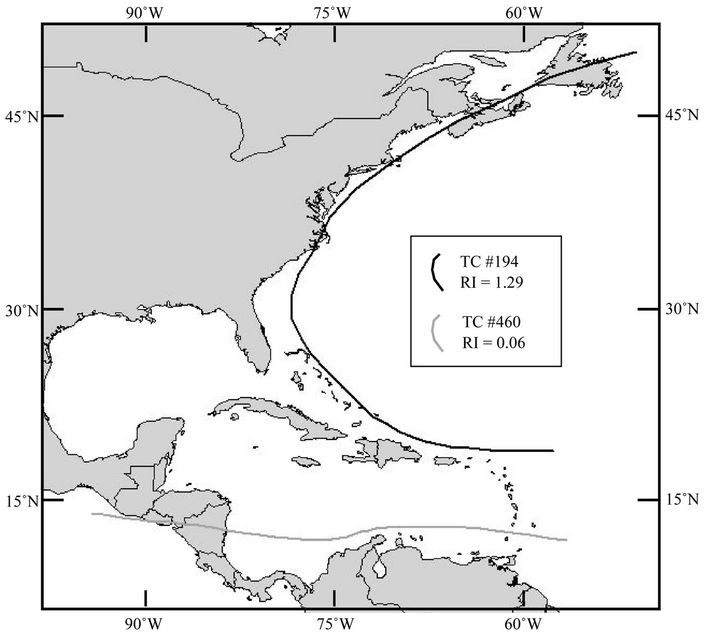
Figure 3. Recurvature index (RI). Tracks of two selected TCs are shown. The northern, TC #194, has a RI value of 1.29 and exhibits an intensely recurved track shape; the southern, TC #460, has a low RI value (0.06) and a horizontal track shape.
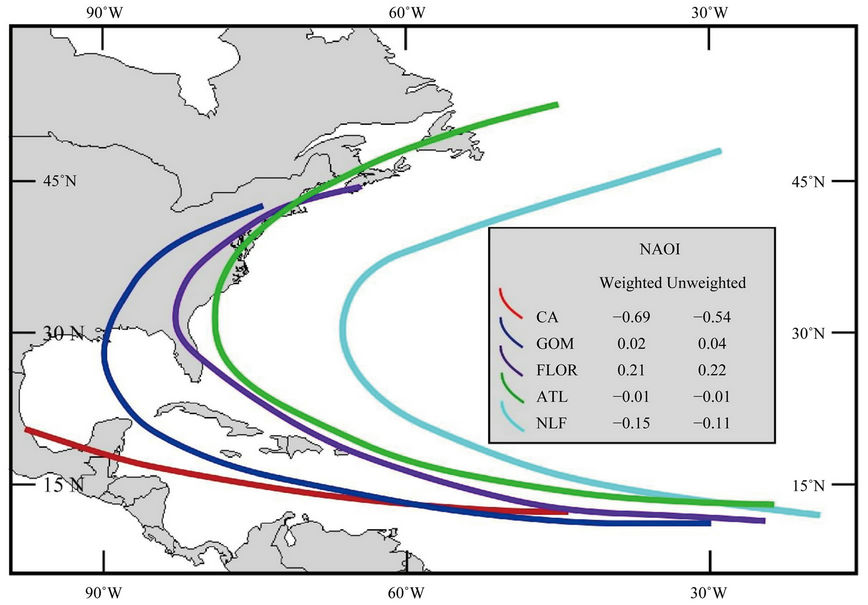
Figure 4. Average tracks of all TCs making landfall at tropical storm strength and above (row e from Figure 2). Track color marks region of landfall. TCs making landfall in CA display flat tracks, while degree of recurvature increases progressively through the other regions, with focus of recurvature moving in a northeasterly direction.
through all three intensity levels (Figure 2). TCs in the CA set originate in the west-central tropical Atlantic, and generally display horizontal tracks before making landfall in Central America. Tracks in the GOM set originate farther to the east, and after following slightly more northern paths as far west as the southern Caribbean, they exhibit a change in track trajectory, which becomes more pronounced in the central Gulf of Mexico, resulting in landfall along the Gulf coast. Visually, this pattern of more northerly track path, increased recurvature and eastern movement of general track location and of recurvature apex can be traced through FLOR and ATL. Location of origin also moves east from GOM through ATL, but to a much smaller degree (Figures 2 and 4). The NLF track set is the largest and has the most eastern points of origin, termination and recurvature. The degree of recurvature, quantified by the RI, increases incrementally to the northeast, increasing for TSs from 0.15 (CA) to 0.51 (GOM), to 0.79 (FLOR) through 1.41 (ATL), before decreasing slightly for NLF (1.11) (Table 1). It should be noted that the maximum latitude of TCs making landfall with the continental landmass is probably reduced for some storms due to their dissipation over land, thereby lowering their RI values, particularly for the GOM and FLOR sets. Although it is not possible to estimate the size of this reduction it is unlikely that it is large enough to change the order of the regional RI values, given the large numerical gap between the CA and ATL values (Table 1). The NAOI values increase from CA through GOM and FLOR, then decrease progressively through ATL and NLF. Both patterns are consistent across all three intensity levels, and for both the Weighted and Unweighted NAOI indices (Figure 4, Table 1).
The MONTH indices show a different pattern. Both the weighted and unweighted values are lowest (i.e., earliest occurrence) in GOM with values increasing through FLOR, ATL, and NLF, except for anomalously high FLOR values for major hurricanes. CA has the highest MONTH values except for the hurricane intensity level where NLF values are slightly higher (Table 1).
4. Discussion
Apart from the CA TCs, which tend to originate farther west, point of origin and early track patterns are very similar for all track sets (Figures 2 and 4). Figure 5 displays the tracks of all TCs of tropical storm strength or above for 1851-2008 that have passed within 50 km of six grid points set at 5˚ intervals from 45˚W - 70˚W along the 15˚N latitude line (Figure 5(g)). Similar patterns are displayed at all grid points; a set of relatively homo-
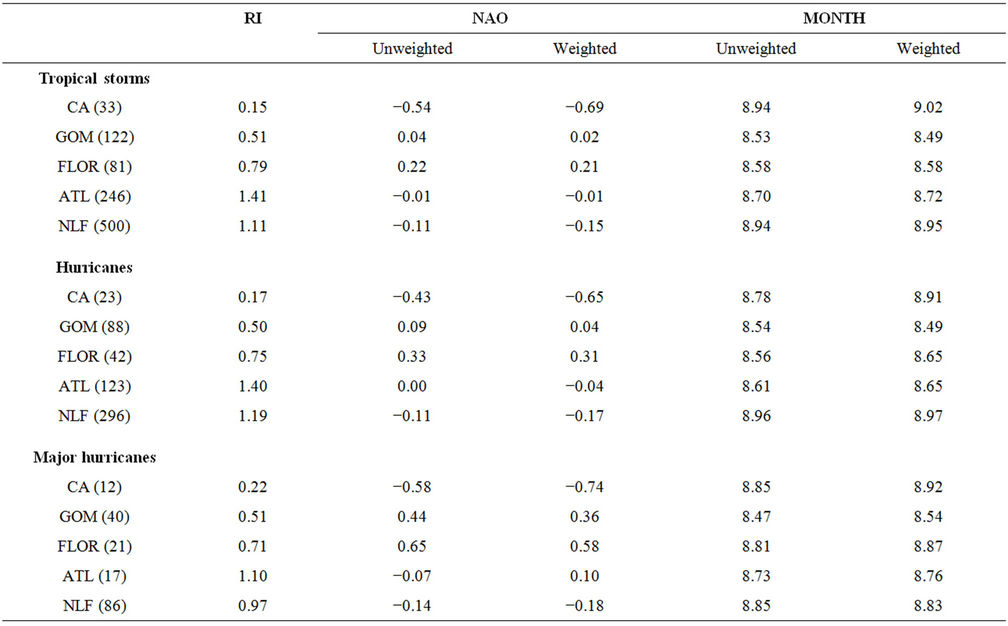
Table 1. Regional recurvature, NAO and monthly indices for continental landfalling tropical cyclones, grouped by intensity at landfall, grouped by intensity at landfall. The number of tropical cyclones in each set is shown in parentheses.
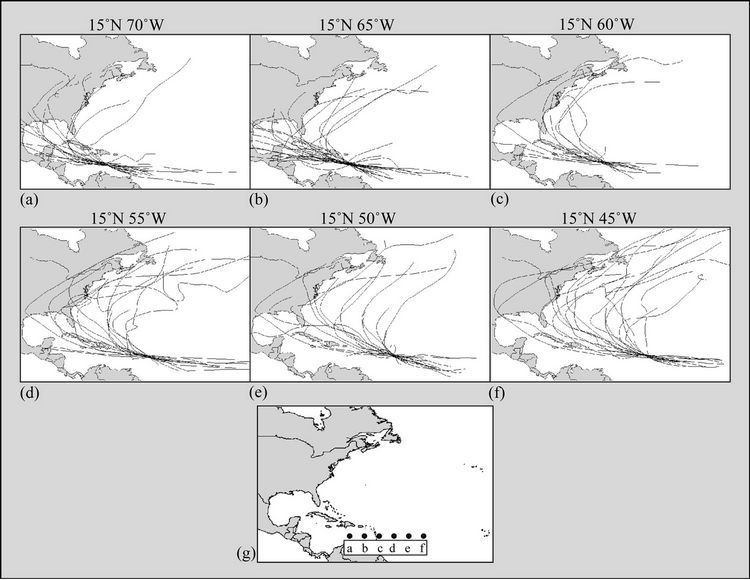
Figure 5. Tracks of all TCs since 1851 passing within 50 km of six grid points at tropical storm strength and above. The geographical location of these grid points, which occur at 5˚ intervals along the 15˚N parallel from 70˚W - 45˚W are displayed as dots in (g). Lowercase letters below the dots correspond to the box number in the top figures.
genous tracks approaching from the eastern Atlantic, followed by a large fanning of tracks to the west. From 70˚W - 55˚W every grid point set contains TC tracks that fall into all landfall group from CA through NLF (Figures 5(a)-(d)); for 50˚W and 45˚W (Figures 5(e) and (f)) tracks cover landfall regions GOM through NLF, demonstrating that point of origin and early track location are very poor predictors of landfall location, other than for CA storms, which form farther to the southwest. It seems clear that track shape plays an important role in determining if and where a TC makes landfall. At all grid points, flatter tracks result in more southerly landfall, with increasing recurvature driving landfall northward, eventually eliminating landfall entirely. Locational factors are also important as earlier (more easterly) recurvature has the same effect, indicating that, in general, landfall location is highly dependent upon the degree of recurvature and the longitude at which recurvature begins to dominate. This suggests that steering mechanisms constitute the principal control over landfall location. The atmospheric feature most commonly associated with this steering is the Bermuda High (BH) [8,12].
The NA circulation is dominated by a set of distinct atmospheric structures, lying in roughly parallel sequential latitudinal belts. The Intertropical Convergence Zone (ITCZ), characterized by high temperature, high precipitation and rising air, is situated at the lowest latitudes. Poleward of the ITCZ is the subtropical high pressure ridge. The point of highest pressure within this belt is referred to as either the Bermuda (BH) or the Azores High (AH). Although BH and AH display some differences in the winter, they are basically interchangeable during the summer months [25]. In this paper we use the term BH as we are generally concerned with conditions during the hurricane season. Farther north is a low pressure zone, the central node of which is the Icelandic Low (IL). The BH and IC are often referred to as the “action centers” of the NA [26-28]. The Polar High is found at the highest latitudes.
On an annual basis, this system moves as a unit, with the components drifting north and south in rough parallel, following the apparent movement of the sun. During the boreal winter this moves the BH equatorward, resulting in the December to May dry season in the Caribbean and Central America, as the accompanying zone of subsiding air leads to frequent atmospheric inversions, increased trade wind strength and generally dry conditions in the region [29,30]. In June the region’s wet season begins as the BH moves north out of the area and the ITCZ approaches from the south, and conditions become dominated by uplift, condensation, and precipitation [25,26, 29-32]. There is also a zonal aspect to the movement, with the BH migrating eastward from July through September, before a return to the southwest beginning in October [26,28,32]. Generally, a higher central pressure for the BH correlates to a northeastern, and a lower central pressure to a southwestern position [26,28].
The circulation system is driven by the pressure and wind gradients between these four features. The clockwise rotating BH generates the northeasterly trade winds off the south flank and the mid-latitude westerlies off the north, with the strength of these zonal winds controlled to a great extent by the pressure gradient between the BH and the adjacent low pressure system [26-28]. In the mid-latitudes this gradient is quantified by the NAOI, which is the normalized pressure difference at sea level below the BH and the IL [32-34]. The NAO tend to oscillate between strong and weak states, reflecting the “seesaw” nature of the relationship between the BH and IL [8], with a stronger NAO correlating to a northeastern location for the BH and a more northeasterly-southwesterly tilt in wind direction [26,28,31]. Because NAO intensity is such a key feature of the NA circulation system we use NAOI values rather than the central pressure of the BH in order to capture both general circulation strength and BH intensity. Large NAOI values correspond to a stronger BH and an intensified circulation. Due to the correlation between a strengthened BH and a northeast position, NAOI values can also be used as a rough proxy for BH location.
Because TCs cannot plow through the middle of the BH, they curve around the outside, with position and shape of track recurvature reflecting the approximate position and strength of the BH. NAOI and RI values should therefore have a positive relationship, with a steeper meridional pressure gradient driving increased recurvature around the BH. Spatially, the position of the BH should exert a major control over location of recurvature, and, consequently, landfall. Northern location of the BH (high NAOI values) will tend to result in more northerly track location, which will increase recurvature due to both the heightened pressure gradient and the increased effect of the mid-latitude westerlies. Conversely, a southwestern location (low NAOI values) will move tracks to the south, resulting in flatter tracks and reduced recurvature as the TCs remain equatorward of the westerlies. Temporally, due to the seasonal migration of the BH, time of occurrence is important. Therefore, landfall in northern areas should correlate with higher RI and NAOI values, a stronger BH, and/or a northern position (July-September), while southern landfalls should correspond to low RI and NAOI values, a weaker BH and/or a southwestern location (October-November).
Our data supports this theoretical analysis. RI values increase progressively by regions from CA through ATL, indicating that the northern migration of landfall correlates with increasing recurvature (Table 1), with the increasing NAOI values from CA through FLOR suggesting that this movement is driven by progressively stronger BH (Table 1, Figure 4). For the ATL and NLF TC sets the reduction, first in intensity and then in recurvature, may well be due to positional effects. The monthly occurrence indices indicate that average landfall moves to the north/east over the season for GOM through NLF, following the position of the BH, with the latest average landfall occurring in CA, after the BH has moved back to the southwest. It should be noted that this is only in regard to Cape Verde-type TCs; the average landfall dates for West Caribbean TCs are different.
A general landfall pattern can therefore be described for Cape Verde-type TCs. During the cyclone season, landfall gradually creeps eastward across the GOM through FLOR to ATL, associated with increasing recurvature and/or strength of the BH which is itself moving northward and eastward. As the BH moves farther east, due to the north-south orientation of the continental coastline, positional rather than recurvature/intensity factors dominate landfall location, with first NAOI and then RI values falling as the TC tracks move offshore. Late in the season, the sudden southwestern movement of the BH results in an upsurge in landfall along CA, characterized by extremely flat tracks associated with very weak BH.
Of particular interest are the possible effects of the movement of the BH over millennial timescales. The latitudinal position of the NA circulation system is largely controlled by the pole-equator temperature gradient. Cold periods steepen this gradient, driving both the ITCZ and the BH southward, while the gradient relaxes during warm periods, resulting in a poleward movement of the features [35-42]. Given the steering controls exerted by the BH, this climate-driven latitudinal migration of the circulation system possibly plays a significant role in the location of NA TC landfall over long timescales. The observed level of hurricane activity has not remained static across the North Atlantic over the late Holocene, but has been punctuated by multi-centennial to millennial scale periods of hyperactivity [43-56]. Along the northern GOM the landfall frequency of major hurricanes increased as much as fivefold during hyperactive periods [44, 49]; similar and/or higher rate changes have been recorded for other areas [48,53-55]. Researchers have argued that this landfall pattern is driven by long-term changes in the average position/strength of the ITCZ and/or BH [44,49,53-55,57]. It seems highly likely that the TC belt, located between the ITCZ and the BH migrates along with those features. Assuming that steering controls have remained relatively constant, this latitudinal movement could result in increased landfall in the north during warm periods and in the south during cool periods. A recent study correlating the frequency of landfall of major hurricanes with the average latitudinal position of the ITCZ supports this view, finding that landfall frequency increased dramatically in the southern Caribbean during the Little Ice Age (LIA) [55]. The amplitude of the temperature change (~2˚C) associated with the LIA is equal to or less than the temperature increase projected to occur over the next few centuries as a result of anthropogenic carbon emissions [58-60]. This suggests that the current warming will lead to at least an equivalent level of change, marked by significant northern movement of the average annual location of the BH, and a subsequent northern movement of NA TC tracks, resulting in an increase (decrease) in TC landfall along the Atlantic (Gulf) coast of North America.
5. Conclusions
This study examined the spatial relationship between the NAO and NA TCs by classifying tracks by landfall location. Tracks of all Cape Verde-type TCs from 1851- 2008 that achieved wind speeds > 35 knots were examined, and then subdivided by intensity (within the 50 km coastal buffer for landfalling and coastal storms or over the life of the storm for nonlandfalling storms). These landfall groupings form coherent regional sets, with the regionally-specific spatial patterns remaining consistent throughout the three intensity levels.
The interregional changes proceed in a consistent pattern. TCs making landfall along the Central American coast display extremely flat path shapes, with recurvature increasing progressively through the southern and northern Gulf of Mexico, Florida, and up the Atlantic seaboard, after which the degree of recurvature relaxes slightly for non-landfalling TCs.
Apart from TCs making landfall along the coast of Central America amplitude of recurvature and the longitude of its initiation are more important than point of origin and early track location in controlling the location of landfall. Both of these controls appear to be connected with features of the BH. Longitude of initiation of recurvature can be correlated with the position of the BH, while the amplitude of track recurvature can be correlated with the strength of the BH, as represented by NAOI values. These features are related, due to a general correspondence between position and intensity of the BH, with a strong (weak) BH corresponding to a northeast (southwest) position.
As BH position and strength appear to be an important control over landfall location, long term changes in the latitudinal position of the BH might explain the observed millennial-scale variability in North Atlantic hurricane activity. Global warming will likely result in a northerly shift in TC tracks and an increase in Atlantic coast landfalls.
6. Acknowledgements
This research was supported by grants from the US National Science Foundation (CNH-1212112, BCS-096- 4043, BCS-0602554) and the Inter-American Institute for Global Change Research (IAI-CRN2050). We would also like to thank the three anonymous reviewers whose input greatly improved the article.
REFERENCES
- R. A. Pielke Jr., J. Rubiera, C. Landsea, M. L. Fernandez and R. Klie, “Hurricane Vulnerability in Latin America and the Caribbean: Normalized Damage and Loss Potenals,” Natural Hazards Review, Vol. 4, No. 3, pp. 101-114. doi:10.1061/(ASCE)1527-6988(2003)4:3(101)
- R. A. Pielke Jr., J. Gratz, C. W. Landsea, D. Collins, M. A. Saunders and R. Musulin, “Normalized Hurricane Damages in the United States: 1900-2005,” Natural Hazards Review, Vol. 9, No. 1, 2008, pp. 29-42. doi:10.1061/(ASCE)1527-6988(2008)9:1(29)
- K. Emanuel, “Increasing Destructiveness of Tropical Cyclones Over the Past 30 Years,” Nature, Vol. 436, 2005, pp. 686-688. doi:10.1038/nature03906
- K. Trenberth, “Uncertainty in Hurricanes and Global Warming,” Science, Vol. 308, No. 5729, 2005, pp. 1753- 1754. doi:10.1126/science.1112551
- P. J. Webster, G. J. Holland, J. A. Curry and H. R. Chang, “Changes in Tropical Cyclone Number, Duration, and Intensity in a Warming Environment,” Science, Vol. 309, No. 5742, 2005, pp. 1844-1846. doi:10.1126/science.1116448
- M. A. Bender, T. R. Knutson, R. E. Tuleya, J. J. Sirutis, G. A. Vecchi, S. T. Garner and I. M. Held, “Modeled Impact of Anthropogenic Warming on the Frequency of Intense Atlantic Hurricanes,” Science, Vol. 327, No. 5964, 2010, pp. 454-458. doi:10.1126/science.1180568
- T. R. Knutson, J. L. McBride, J. Chan, K. Emanuel, G. Holland, C. Landsea, I. Held, J. P. Kossin, A. K. Srivastava and M. Sugi, “Tropical Cyclones and Climate Change,” Nature Geoscience, Vol. 3, 2010, pp. 157-163. doi:10.1038/ngeo779
- J. B. Elsner, K. B. Liu and B. Kocher, “Spatial Variations in Major US Hurricane Activity: Statistics and a Physical Mechanism,” Journal of Climate, Vol. 13, No. 13, 2000, pp. 2293-2305. doi:10.1175/1520-0442(2000)013<2293:SVIMUS>2.0.CO;2
- E. D. Maloney and D. L. Hartmann, “Modulation of Hurricane Activity in the Gulf of Mexico by the MaddenJulian Oscillation,” Science, Vol. 287, No. 5460, 2000, pp. 2002-2004. doi:10.1126/science.287.5460.2002
- J. Larson, Y. P. Zhou and R. W. Higgins, “Characteristics of Landfalling Tropical Cyclones in the United States and Mexico: Climatology and Interannual Variability,” Journal of Climate, Vol. 18, No. 8, 2005, pp. 1247-1262. doi:10.1175/JCLI3317.1
- H. M. Kim, P. J. Webster and J. A. Curry, “Impact of Shifting Patterns of Pacific Ocean Warming on North Atlantic Tropical Cyclones,” Science, Vol. 325, No. 5936, 2009, pp. 77-80. doi:10.1126/science.1174062
- J. B. Elsner, “Tracking Hurricanes,” Bulletin of the American Meteorological Society, Vol. 84, No. 3, 2003, pp. 353-356. doi:10.1175/BAMS-84-3-353
- J. B. Elsner and K. B. Liu, “Examining the ENSO-Typhoon Hypothesis,” Climate Research, Vol. 25, No. 1, 2003, pp. 43-54. doi:10.3354/cr025043
- J. Nakamura, U. Lall, Y. Kushnir and S. J. Camargo, “Classifying North Atlantic Tropical Cyclone Tracks by Mass Moments,” Journal of Climate, Vol. 22, No. 20, 2009, pp. 5481-5494. doi:10.1175/2009JCLI2828.1
- S. J. Camargo, A. W. Robertson, S. J. Gaffney, P. Smyth and M. Ghil, “Cluster Analysis of Typhoon Tracks. Part I: General Properties,” Journal of Climate, Vol. 20, No. 14, 2007, pp. 3635-3653. doi:10.1175/JCLI4188.1
- S. J. Camargo, A. W. Robertson, A. G. Barnston and M. Ghil, “Clustering of Eastern North Pacific Tropical Cyclone Tracks: ENSO and MJO Effects,” Geochemistry, Geophysics, Geosystems, Vol. 9, No. 6, 2008, Article ID: Q06V05.
- J. P. Kossin, S. J. Camargo and M. Sitkowski, “Climate Modulation of North Atlantic Hurricane Tracks,” Journal of Climate, Vol. 23, No. 11, 2010, pp. 3057-3076. doi:10.1175/2010JCLI3497.1
- S. J. Gaffney, A. W. Robertson, P. Smyth, S. J. Camargo and M. Ghil, “Probabilistic Clustering of Extratropical Cyclones Using Regression Mixture Models,” Climate Dynamics, Vol. 29, No. 4, 2007, pp. 423-440. doi:10.1007/s00382-007-0235-z
- A. J. Colbert and B. J. Soden, “Climatological Variations in North Atlantic Tropical Cyclone Tracks,” Journal of Climate, Vol. 25, No. 2, 2012, pp. 657-673. doi:10.1175/JCLI-D-11-00034.1
- K. D. Ash and C. J. Matyas, “The Influences of ENSO and the Subtropical Indian Ocean Dipole on Tropical Cyclone Trajectories in the South Indian Ocean,” International Journal of Climatology, Vol. 32, No. 1, 2012, pp. 41-56. doi:10.1002/joc.2249
- M. C. Bove, J. B. Elsner, C. W. Landsea, X. Niu and J. J. O’Brien, “Effects of El Niño on US Landfalling Hurricanes, Revisited,” Bulletin of the American Meteorological Society, Vol. 79, No. 1, 1998, pp. 2477-2482. doi:10.1175/1520-0477(1998)079<2477:EOENOO>2.0.CO;2
- D. B. Enfield, A. M. Mestas-Nunez and P. J. Trimble, “The Atlantic Multidecadal Oscillation and Its Relationship to Rainfall and River Flows in the Continental US,” Geophysical Research Letters, Vol. 28, No. 10, 2001, pp. 2077-2080. doi:10.1029/2000GL012745
- C. Wang and S. K. Lee, “Atlantic Warm Pool, Caribbean Low-Level Jet, and Their Potential Impact on Atlantic Hurricanes,” Geophysical Research Letters, Vol. 34, No. 2, 2007, Article ID: L02703. doi:10.1029/2006GL028579
- S. B. Goldenberg, C. W. Landsea, A. M. Mestas-Nuñez, and W. M. Gray, “The Recent Increase in Atlantic Hurricane Activity: Causes and Implications,” Science, Vol. 293, No. 5529, 2001, pp. 474-479. doi:10.1126/science.1060040
- R. E. Davis, B. P. Hayden, D. A. Gay, W. L. Phillips and G. V. Jones, “The North Atlantic Subtropical Anticyclone,” Journal of Climate, Vol. 10, No. 4, 1997, pp. 728- 744. doi:10.1175/1520-0442(1997)010<0728:TNASA>2.0.CO;2
- H. S. Sahsamanoglou, “A Contribution to the Study of Action Centers in the North-Atlantic,” International Journal of Climatology, Vol. 10, No. 3, 1990, pp. 247- 261. doi:10.1002/joc.3370100303
- A. Kapala, H. Mächel and H. Flohn, “Behaviour of the Centres of Action above the Atlantic since 1881. Part II: Associations with Regional Climate Anomalies,” International Journal of Climatology, Vol. 18, No. 1, 1998, pp. 23-36. doi:10.1002/(SICI)1097-0088(199801)18:1<23::AID-JOC226>3.0.CO;2-7
- H. Mächel, A. Kapala and H. Flohn, “Behaviour of the Centres of Action above the Atlantic since 1881. Part I: Characteristics of Seasonal and Interannual Variability,” International Journal of Climatology, Vol. 18, No. 1, 1998, pp. 1-22. doi:10.1002/(SICI)1097-0088(199801)18:1<1::AID-JOC225>3.0.CO;2-A
- S. Hastenrath, “On General Circulation and Energy Budget in the Area of the Central American Seas,” Journal of Atmospheric Science, Vol. 23, No. 6, 1966, pp. 694-711. doi:10.1175/1520-0469(1966)023<0694:OGCAEB>2.0.CO;2
- G. T. Trewartha, “The Earth’s Problem Climates, Second Edition,” The University of Wisconsin Press, Madison, 1981.
- J. B. Nyberg, A. Kuijpers, B. A. Malmgren and H. Kunzendorf, “Late Holocene Changes in Precipitation and Hydrology Recorded in Marine Sediments from the Northeastern Caribbean Sea,” Quaternary Research, Vol. 56, No. 1, 2001, pp. 87-102. doi:10.1006/qres.2001.2249
- D. H. Portis, J. E. Walsh, M. El Hamly and P. J. Lamb, “Seasonality of the North Atlantic Oscillation,” Journal of Climate, Vol. 14, No. 9, 2001, pp. 2069-2078. doi:10.1175/1520-0442(2001)014<2069:SOTNAO>2.0.CO;2
- J. W. Hurrell, “Decadal Trends in the North-Atlantic Oscillation—Regional Temperatures and Precipitation,” Science, Vol. 269, No. 5224, 1995, pp. 676-679. doi:10.1126/science.269.5224.676
- P. D. Jones, T. Jonsson and D. Wheeler, “Extension to the North Atlantic Oscillation Using Early Instrumental Pressure Observations From Gibraltar and South-West Iceland,” International Journal of Climatology, Vol. 17, No. 13, 1997, pp. 1433-1450. doi:10.1002/(SICI)1097-0088(19971115)17:13<1433::AID-JOC203>3.0.CO;2-P
- H. H. Lamb, “Climate, Present, Past and Future.Volume 2, Climatic History and the Future,” Methuen and Co. Ltd., London, 1977.
- H. Flohn, “Ice-free Arctic and Glaciated Antarctic,” In: H. Flohn and R. Fantechi, Eds., The Climate of Europe: Past, Present and Future, D. Reidel Publishing Company, Dordrecht, 1984, pp. 248-268.
- G. H. Haug, K. A. Hughen, D. M. Sigman, L. C. Peterson and U. Rohl, “Southward Migration of the Intertropical Convergence Zone through the Holocene,” Science, Vol. 293, No. 5533 2001, pp. 1304-1308. doi:10.1126/science.1059725
- J. C. H. Chiang, M. Biasutti and D. S. Battisti, “Sensitivity of the Atlantic Intertropical Convergence Zone to Last Glacial Maximum Boundary Conditions,” Paleoceanography, Vol. 18, 2003.
- A. Koutavas and J. Lynch-Stieglitz, “Variability of the Marine ITCZ over the Eastern Pacific during the Past 30,000 Years: Regional Perspective and Global Context,” In: H. F. Diaz and R. S. Bradley, Eds., The Hadley Circulation: Present, Past, and Future, Springer-Verlag, Berlin, 2004, pp. 347-369. doi:10.1007/978-1-4020-2944-8_12
- J. C. H. Chiang and C. M. Bitz, “Influence of High Latitude Ice Cover on the Marine Intertropical Convergence Zone,” Climate Dynamics, Vol. 25, No. 5, 2005, pp. 477- 496. doi:10.1007/s00382-005-0040-5
- A. J. Broccoli, K. A. Dahl and R. J. Stouffer, “Response of the ITCZ to Northern Hemisphere Cooling,” Geophysical Research Letters, Vol. 33, No. 1, 2006, Article ID: L01702. doi:10.1029/2005GL024546
- R. Seager, N. Graham, C. Herweijer, A. L. Gordon, Y. Kushnir and E. Cook, “Blueprints for Medieval Hydroclime,” Quaternary Science Reviews, Vol. 26, No. 19-21, 2007, pp. 2322-2336. doi:10.1016/j.quascirev.2007.04.020
- K. B. Liu and M. L. Fearn, “Lake-Sediment Record of Late Holocene Hurricane Activities from Coastal Alabama,” Geology, Vol. 21, No. 9, 1993, pp. 793-796. doi:10.1130/0091-7613(1993)021<0793:LSROLH>2.3.CO;2
- K. B. Liu and M. L. Fearn, “Reconstruction of Prehistoric Landfall Frequencies of Catastrophic Hurricanes in Northwestern Florida from Lake Sediment Records,” Quaternary Research, Vol. 54, No. 2, 2000, pp. 238-245. doi:10.1006/qres.2000.2166
- J. P. Donnelly, S. S. Bryant, J. Butler, F. L. Dowling, N. Hausmann, P. Newby, B. Shuman, J. Stern, K. Westover and T. Webb III, “A 700 year Sedimentary Record of Intense Hurricane Landfalls in Southern New England,” Geological Society of America Bulletin, Vol. 113, No. 6, 2001, pp. 714-727. doi:10.1130/0016-7606(2001)113<0714:YSROIH>2.0.CO;2
- J. P. Donnelly, S. Roll, M. Wengren, J. Butler, R. Lederer and T. Webb III, “Sedimentary Evidence of Intense Hurricane Strikes from New Jersey,” Geology, Vol. 29, No. 7, 2001, pp. 615-618. doi:10.1130/0091-7613(2001)029<0615:SEOIHS>2.0.CO;2
- J. P. Donnelly, J. Butler, S. Roll, M. Wengren and T. Webb III, “A Backbarrier Overwash Record of Intense Storms from Brigantine, New Jersey,” Marine Geology, Vol. 210, No. 1-4, 2004, pp. 107-121. doi:10.1016/j.margeo.2004.05.005
- D. B. Scott, E. S. Collins, P.T. Gayes and E. Wright, “Records of Prehistoric Hurricanes on the South Carolina Coast Based on Micropaleontological and Sedimentological Evidence, With Comparison to Other Atlantic Coast Records,” Geological Society of America Bulletin, Vol. 115, No. 9, 2003, pp. 1027-1039. doi:10.1130/B25011.1
- K. B. Liu, “Paleotempestology: Principles, Methods, and Examples from Gulf Coast Lake Sediments,” In: R. J. Murnane and K. B. Liu, Eds., Hurricanes and Typhoons: Past, Present and Future, Columbia University Press, New York, 2004, pp. 13-57.
- J. P. Donnelly and T. Webb III, “Back-barrier Sedimentary Records of Intense Hurricane Landfall in the Northeastern United States,” In: R. J. Murnane and K. B. Liu, Eds., Hurricanes and Typhoons: Past, Present and Future, Columbia University Press, New York, 2004, pp. 58-95.
- J. P. Donnelly and J. Woodruff, “Intense Hurricane Activity over the Past 5000 Years Controlled by El Niño and the West African Monsoon,” Nature, Vol. 447, 2007, pp. 465-468. doi:10.1038/nature05834
- M. E. Mann, J. D. Woodruff, J. P. Donnelly and Z. H. Zhang, “Atlantic Hurricanes and Climate over the Past 1500 Years,” Nature, Vol. 460, 2009, pp. 880-883. doi:10.1038/nature08219
- T. A. McCloskey and G. Keller, “5000 Year Sedimentary Record of Hurricane Strikes on the Central Coast of Belize,” Quaternary International, Vol. 195, No. 1-2, 2009, pp. 53-68. doi:10.1016/j.quaint.2008.03.003
- B. Malaizé, P. Bertran, P. Carbonel, D. Bonnissent, K. Charlier, D. Galop, D. Imbert, N. Serrand, C. Stouvenot and C. Pujol, “Hurricanes and Climate in the Caribbean During the Past 3700 Years BP,” The Holocene, Vol. 21, No. 6, 2011, pp. 911-924. doi:10.1177/0959683611400198
- T. A. McCloskey and K. B. Liu, “A Sedimentary-Based History of Hurricane Strikes on the Southern Caribbean Coast of Nicaragua,” Quaternary Research, Vol. 78, No. 3, 2012, pp. 454-464. doi:10.1016/j.yqres.2012.07.003
- T. A. McCloskey and K. B. Liu, “A 7000-Year Record of Paleohurricane Activity from a Coastal Wetland in Belize,” The Holocene, Vol. 23, No. 2, 2013, pp. 276-289. doi:10.1177/0959683612460782
- T. A. McCloskey and J. T. Knowles, “Migration of the Tropical Cyclone Zone throughout the Holocene,” In: J. B. Elsner and T. H. Jagger, Eds., Hurricanes and Climate Change, Springer, New York, 2009, pp. 169-188. doi:10.1007/978-0-387-09410-6_10
- J. N. Richey, R. Z. Poore, B. P. Flower and T. M. Quinn, “1400 yr Multiproxy Record of Climate Variability from the Northern Gulf of Mexico,” Geology, Vol. 35, No. 5, 2007, pp. 423-426. doi:10.1130/G23507A.1
- J. N. Richey, R. Z. Poore, B. P. Flower, T. M. Quinn and D. J. Hollander, “Regionally Coherent Little Ice Age Cooling in the Atlantic Warm Pool,” Geophysical Research Letters, Vol. 36, No. 21, 2009, Article ID: L21703. doi:10.1029/2009GL040445
- [61] G. A. Meehl, T. F. Stocker, W. D. Collins, P. Friedlingstein, A. T. Gaye, J. M. Gregory, A. Kitoh, R. Knutti, J. M. Murphy, A. Noda, S. C. B. Raper, I. G. Watterson, A. J. Weaver and Z. C. Zhao, “Global Climate Projections,” In: S. Solomon, D. Qin, M. Manning, Z. Chen, M. Marquis, K. B. Averyt, M. Tignor and H. L. Miller, Eds., Climate Change 2007: The Physical Science Basis. Contribution of Working Group I to the Fourth Assessment Report of the Intergovernmental Panel on Climate Change, Cambridge University Press, Cambridge, 2007.