American Journal of Climate Change
Vol.1 No.3(2012), Article ID:22481,4 pages DOI:10.4236/ajcc.2012.13011
Climate Fields over South America and Variability of SACZ and PSA in HadGEM2-ES
1Center for Weather Forecasting and Climate Studies (CPTEC), National Institute for Space Research (INPE), Cachoeira Paulista, Brazil
2Center for Earth System Science (CCST), National Institute for Space Research (INPE), São José dos Campos, Brazil
Email: iracema.cavalcanti@cptec.inpe.br, marilia.shimizu@inpe.br
Received June 28, 2012; revised July 30, 2012; accepted August 2, 2012
Keywords: South America Precipitation; HadGEM2-ES; Model Simulation; Model Projections; SACZ; PSA
ABSTRACT
Historical simulations (present climate) and projections under RCP8.5 scenario (future climate) by HadGEM2-ES of temperature and precipitation are analyzed during the four seasons in South America. Projections of precipitation are discussed in terms of atmospheric circulation. The South Atlantic Convergence Zone (SACZ) and the Pacific South America (PSA) patterns are analyzed in simulations of present climate and in future climate projections. The model shows small systematic errors over South America, larger close to the northern South American coast in DJF and MAM. The seasonal variability of precipitation, temperature and wind fields is very well reproduced, mainly the summer/winter differences. The SACZ and the Intertropical Convergence Zone (ITCZ) are well simulated. The good model performance to reproduce the precipitation, temperature and wind fields, in the present climate, gives confidence in the projection results subject to the future scenarios. Changes from the present time to the future indicate increased precipitation over southern and southeastern Brazil and areas nearby and the tropical western South American coast. Reduced precipitation is projected over eastern Amazonia, northern South America and southern Chile. The changes are related to changes in the low level wind flow over the tropical North Atlantic, which reduces the advection of moisture to the continent and also to the increased low level flow over central South America southwards, which increases the humidity in the southern regions. The upper level flow changes are also consistent with the precipitation changes. There is a weakening of the Bolivian High and a strengthening of the subtropical jet over the continent. The SACZ dipole pattern is well simulated and in the future projections the southern center anomalies are more intense than in the present time. The PSA1 and PSA2 patterns are well represented in the present climate, but in the future projection only one dominant mode is identified as the typical teleconnection over the Pacific and South America.
1. Introduction
The impacts of climate variability over South America have been analyzed using precipitation data derived from satellite and observations at the surface, atmospheric variables from reanalysis, Sea Surface Temperature (SST) from reconstructed datasets and results from numerical models simulations. Atmospheric models, ocean-atmosphere coupled models and climate models that include biosphere, cryosphere, chemistry, aerosol, dynamic vegetation, carbon and nitrogen cycle and other components have been developed along the years to reach a status of earth system models. The coordinated phase 5 experiments of the Coupled Model Intercomparison Project (CMIP5) aimed to provide results of climate simulations and projections from the new generation of earth system models [1,2]. The results of CMIP5 will contribute to the IPCC-AR5 to complement previous CMIP3 findings.
South America, a continent that extends from the tropics to the extratropics, is affected by climate variability in several timescales, from the intraseasonal to interannual and multidecadal. This continent has two large hydrographic basins-Amazonia and La Plata basins, which are crucial to navigation, fishing and hydroelectric power. Droughts and floods in several regions of the continent affect several sectors, such as the economy, agriculture, water resources and social life [3]. Therefore, it is important to discuss the issue of changes in precipitation over South America under climate change scenarios.
Precipitation reduction in the extreme northern South America, large part of Northeastern Brazil and in the Patagonia region and Chile in the future projections under global warming was reported in IPCC-AR4 [4]. Increased precipitation was projected to southeastern South America, Colombia, Ecuador and Peru. Large uncertainties were found for Amazonia. The ability of CMIP3 models to reproduce the seasonal precipitation over South America was discussed in [5]. The models could represent the maximum tropical precipitation in the summer season and some of them could show features of the South Atlantic Convergence Zone (SACZ). The northwest-southeast band of mean summer precipitation from Amazonia towards the South Atlantic, which is related to the SACZ occurrences, was also reproduced by some CMIP3 models analyzed in [6,7].
The SACZ is a typical system of austral summer season and it is part of the South American Monsoon System. Its variability is represented by a precipitation or Outgoing Long wave Radiation (OLR) dipole, in which one of the centers is related to the intensification or weakening of the SACZ and the other center is located to the south [8-12]. Therefore its variability has impacts on southeastern and southern Brazil and La Plata basin.
The Pacific South America (PSA) pattern is similar to the Pacific North America (PNA) pattern in the Northern Hemisphere, linking the tropics to the extratropics through a Rossby wave train from tropical convection [13,14]. This pattern has influences over South America in several timescales, such as intraseasonal and interannual. In the summer, the cyclonic circulation at high levels, over southeastern South America, which contributes to the convection in the SACZ, is part of the PSA wave train pattern [9,10]. In the winter, this pattern can generate favorable conditions for the displacement and development of synoptic systems, such as frontal systems over South America [15]. Wave trains PSA-type in the winter can also be recognized in [16] associated with cold surges over South America. Thus, the accurate reproduction of PSA pattern by the models is important for South American climate in future projections.
Most of the CMIP3 models analyzed by [17] did not reproduce the PSA pattern. However, [18] showed that this pattern is linked to the dipole precipitation with centers of action in the SACZ and in the Southeastern South America (SESA) region in CMIP3 model results. The projections of two periods of the 21st century indicated an increase of precipitation in the SESA center associated with the intensification and westward displacement of the wave train pattern over the Pacific.
The aim of this paper is to show the ability of HadGEM2-ES model of CMIP5 integrations to reproduce the main precipitation features over South America and to indicate the changes in precipitation and temperature under the RCP8.5 scenario. The variability of the SACZ is analyzed in the present and future climate projections are used to investigate changes in its pattern and intensity. The simulation of the PSA pattern and its behavior in future projections is also investigated.
2. Observed Data and Model Description
Precipitation data are obtained from the Global Precipitation Climatology Project (GPCP) [19] and atmospheric winds, geopotencial and temperature are provided by ERA-Interim reanalysis [20]. The period of analysis is 1979/1980 to 2004/2005. GPCP data contain ground floor measurements data as well as satellite information, available from 1979, and has 2.5 lat × lon resolution. ERA-Interim dataset have been produced by the European Centre for Medium-Range Weather Forecasts (ECMWF) with resolution of 1.5 lat × lon.
The model from CMIP5 is the HadGEM2-ES, an Earth System Model, based on the previous HadGEM1 [21,22]. It includes improvements to reduce the systematic errors, such as Northern Hemisphere continental temperature biases and tropical sea surface temperature biases and poor variability [23,24]. HadGEM2-ES has been evaluated and used for CMIP5 centennial simulations [24,25]. In the earth system version there are several components of the climate systems, such as atmosphere, ocean, land, cryosphere, atmospheric chemistry, terrestrial and marine biosphere, carbon cycle [16]. The horizontal resolution is 1.875˚ lat × 1.25˚ lon with 38 vertical levels in the atmosphere. In the ocean there are 40 vertical levels and the horizontal resolution is 1˚ lat × 1˚ lon, from the poles to 30˚ latitude, increasing to 0.33˚ at the equator.
The historical simulation, defined as 1860 to 2005, used historical record of climate forcing factors such as greenhouse gases, aerosols and natural forcing such as solar and volcanic changes. The parameters values were in conformity with CMIP5 protocol. The model state at 2005 was then used as the initial condition for the future RCP8.5 simulations (Representative Concentration Pathway, consistent with a high emissions scenario) [2]. This scenario is based on the increase of the radiative forcing in the 21st century reaching a level of 8.5 W·m−2 before the end of the century. A full description of HadGEM2- ES model setup can be found in [25].
The period taken for present time is 1979/1980 to 2004/2005, and monthly data from four members of the historical integration were analyzed. In this analysis only the ensemble of the four members are shown. The period analyzed in the future projections is the last 26 years of the integrations: 2073/2074 to 2098/2099, under scenario RCP8.5.
3. Historical Simulation and Future Projections
3.1. Precipitation and Atmospheric Features
The model is able to represent the seasonal variability of precipitation over South America (Figure 1). Many features of the annual cycle of rainfall are well simulated, such as the large differences of precipitation in central and southeastern regions of Brazil between summer and winter that characterize the monsoon system regime over the continent, the northwest-southeast precipitation band associated with the SACZ occurrences, the Intertropical Convergence Zone (ITCZ) meridional displacements along the year, the shifting northwards of maximum precipitation over South America in MAM and southwards in SON and the persistent precipitation along the year over southeastern South America and southern Chile. The differences from the observed precipitation are between –1 and +2 mm/day on most of the continent, but the model underestimate the rainfall by 4 - 6 mm/day close to the northern coast of South America in the summer and autumn and by 2 mm/day in the extreme eastern Northeast Brazil in the winter.
Overestimated precipitation occurs in the Andes Cordillera region. In general, the models have large systematic errors in this region, related to the unresolved topography [26] but HadGEM2-ES shows relatively small
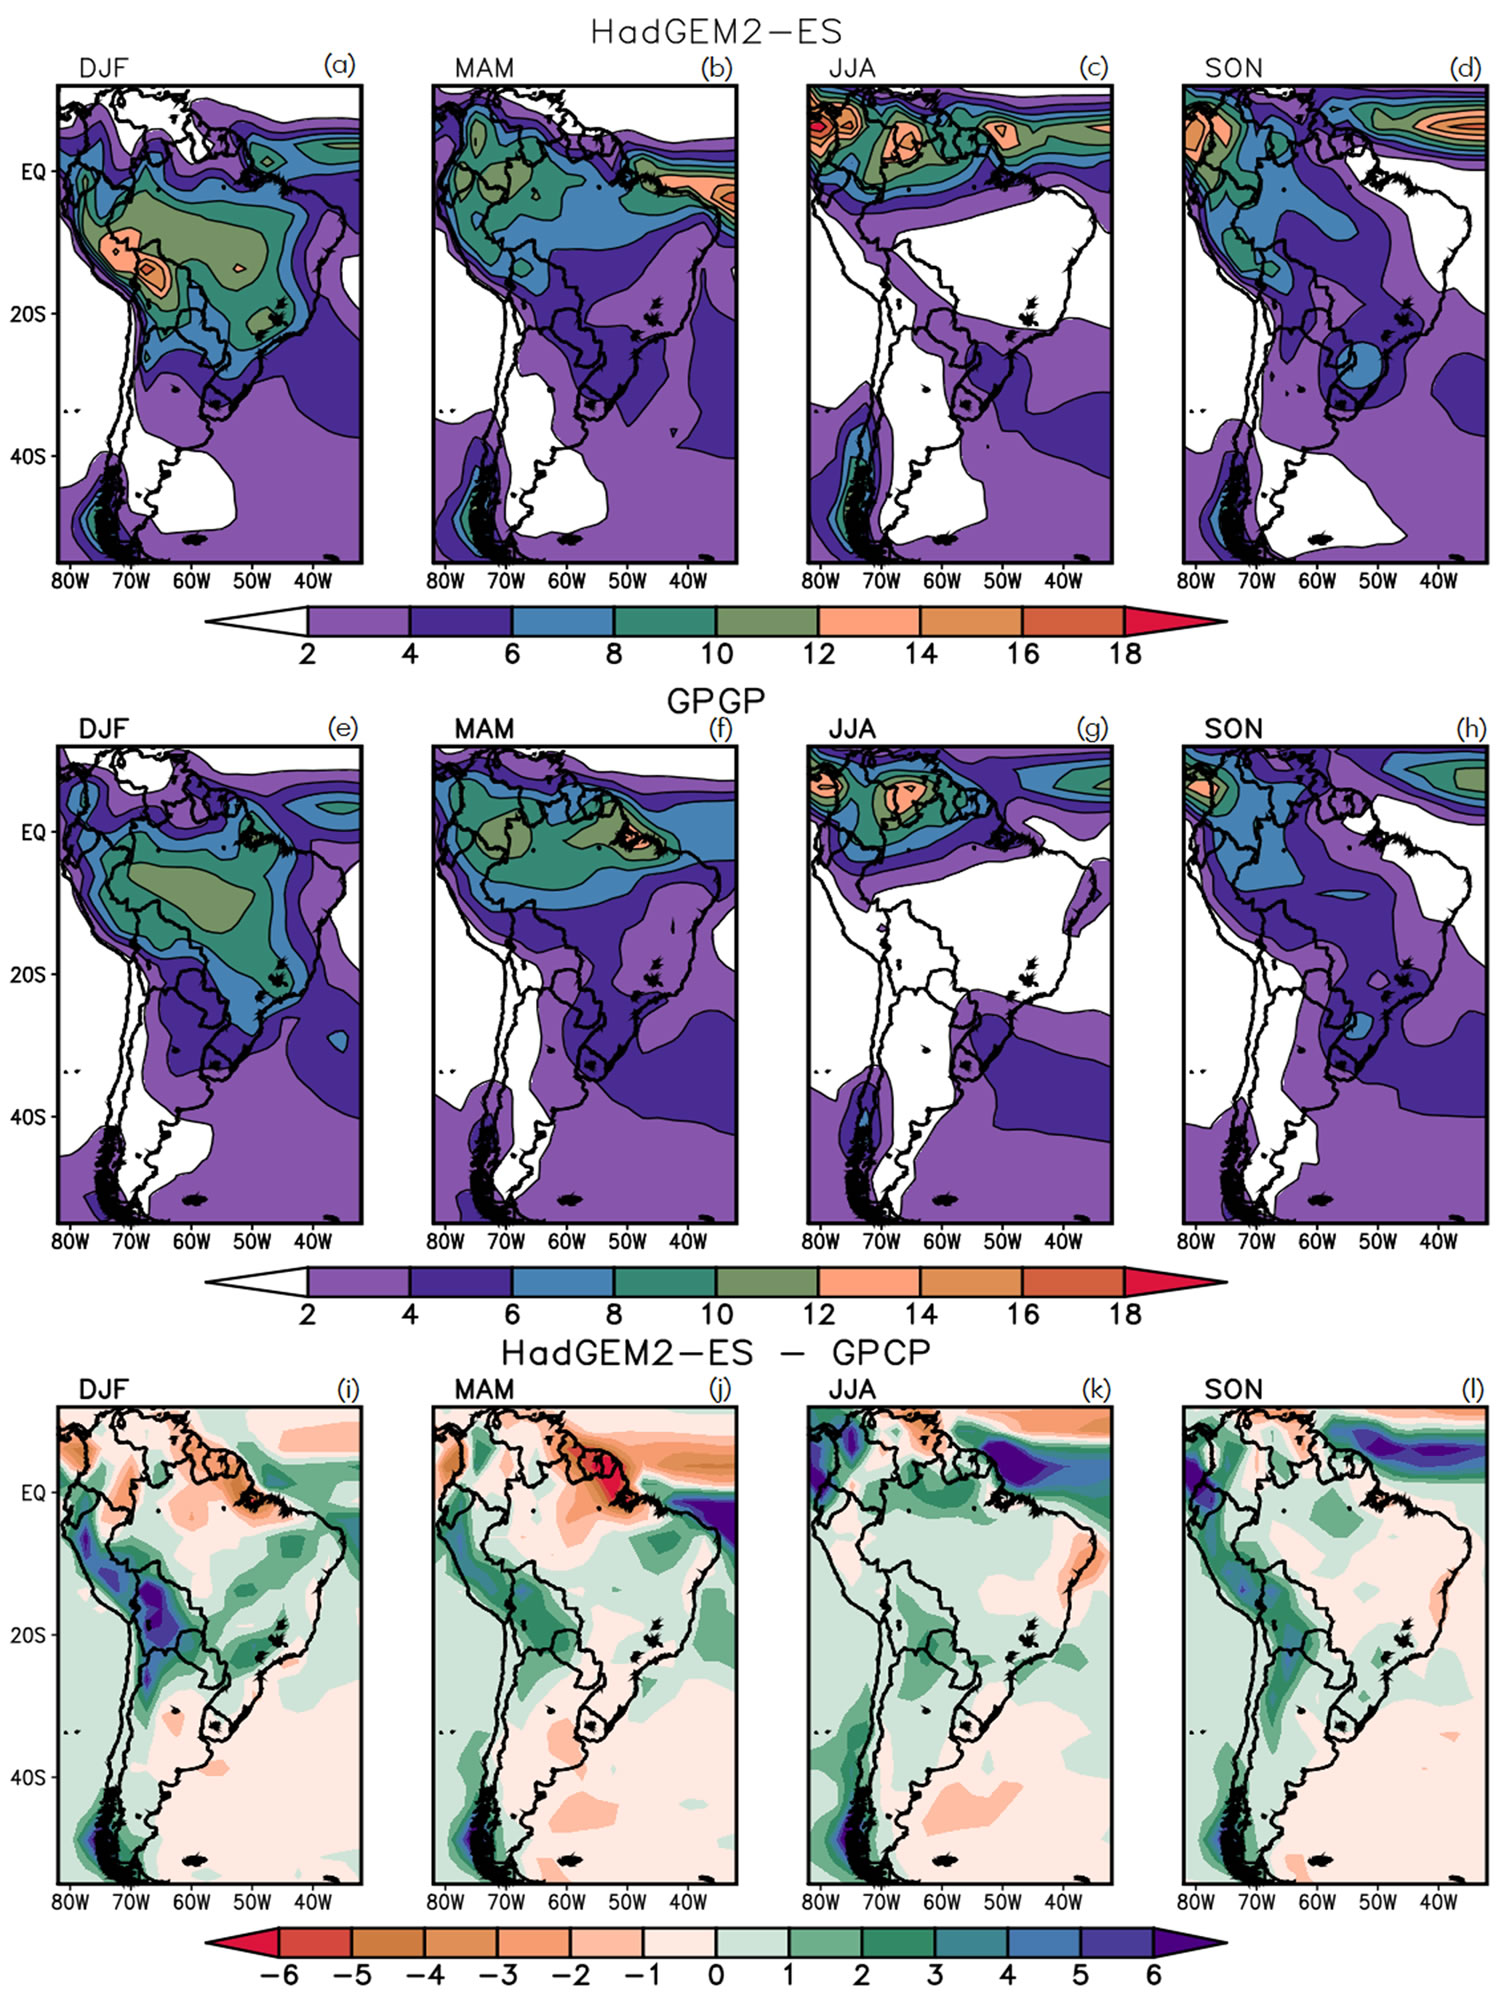
Figure 1. Precipitation (mm/day) in the four seasons (1st row: HadGEM2-ES; 2nd row: GPCP; 3rd row: difference modelobservation). The model data was interpolated to the GPCP grid.
differences of up to 6 mm/day in DJF. Although the model captures the seasonal meridional displacement of the precipitation in the ITCZ, there are errors in its position and intensity. The largest differences are found in the Pacific and Atlantic ITCZ and also in southern Chile, up to 6 mm/day.
The errors over the northern region near the coast are related to the errors in the position of ITCZ precipitation. An analysis of Outgoing Long Wave Radiation (OLR) (figures not shown) showed that the position of the ITCZ in terms of cloud convection is reasonable simulated.
Therefore the shortcomings in the ITCZ seem to be related to the precipitation over the ocean. Part of the systematic errors is removed when the results of the present are subtracted from results of the future, however they may have an impact on the ITCZ precipitation results of future climate.
Projections of precipitation in the four seasons are shown in Figure 2. The general features represented by the model in the present time continue to occur in the RCP8.5 scenario, but with different intensities. Increased precipitation is projected over southern Brazil in all four

Figure 2. Precipitation (mm/day) in the four seasons (1st row: HadGEM2-ES-present time; 2nd row: HadGEM2-ES-future time; 3rd row: difference future-present).
seasons, extending to Uruguay and southern La Plata basin in DJF and MAM, over tropical western South America coast in DJF, MAM and JJA and over southeastern Brazil and the ocean SACZ region in DJF.
A reduction of precipitation is projected over eastern Amazonia from SON to MAM and over northern South America in JJA and SON. Less precipitation over southern Chile is projected in the four seasons. This pattern of increased precipitation in the southern regions and tropical western South America and reduced precipitation in tropical regions of South America and southern Chile had been found in CMIP3 model ensemble of IPCC-AR4, giving more confidence on the certainty of these results. However, there are some differences between CMIP3 and CMIP5 in the most affected areas within these tropical and extratropical regions, such as the increased precipitation over Southeastern and less changes in Northeastern Brazil, in the latter integrations.
The model simulates well the atmospheric circulation features at low levels over South America (Figures 3(a)- (d)) such as the flow in DJF from the tropical North Atlantic southwestward into the continent and then south-
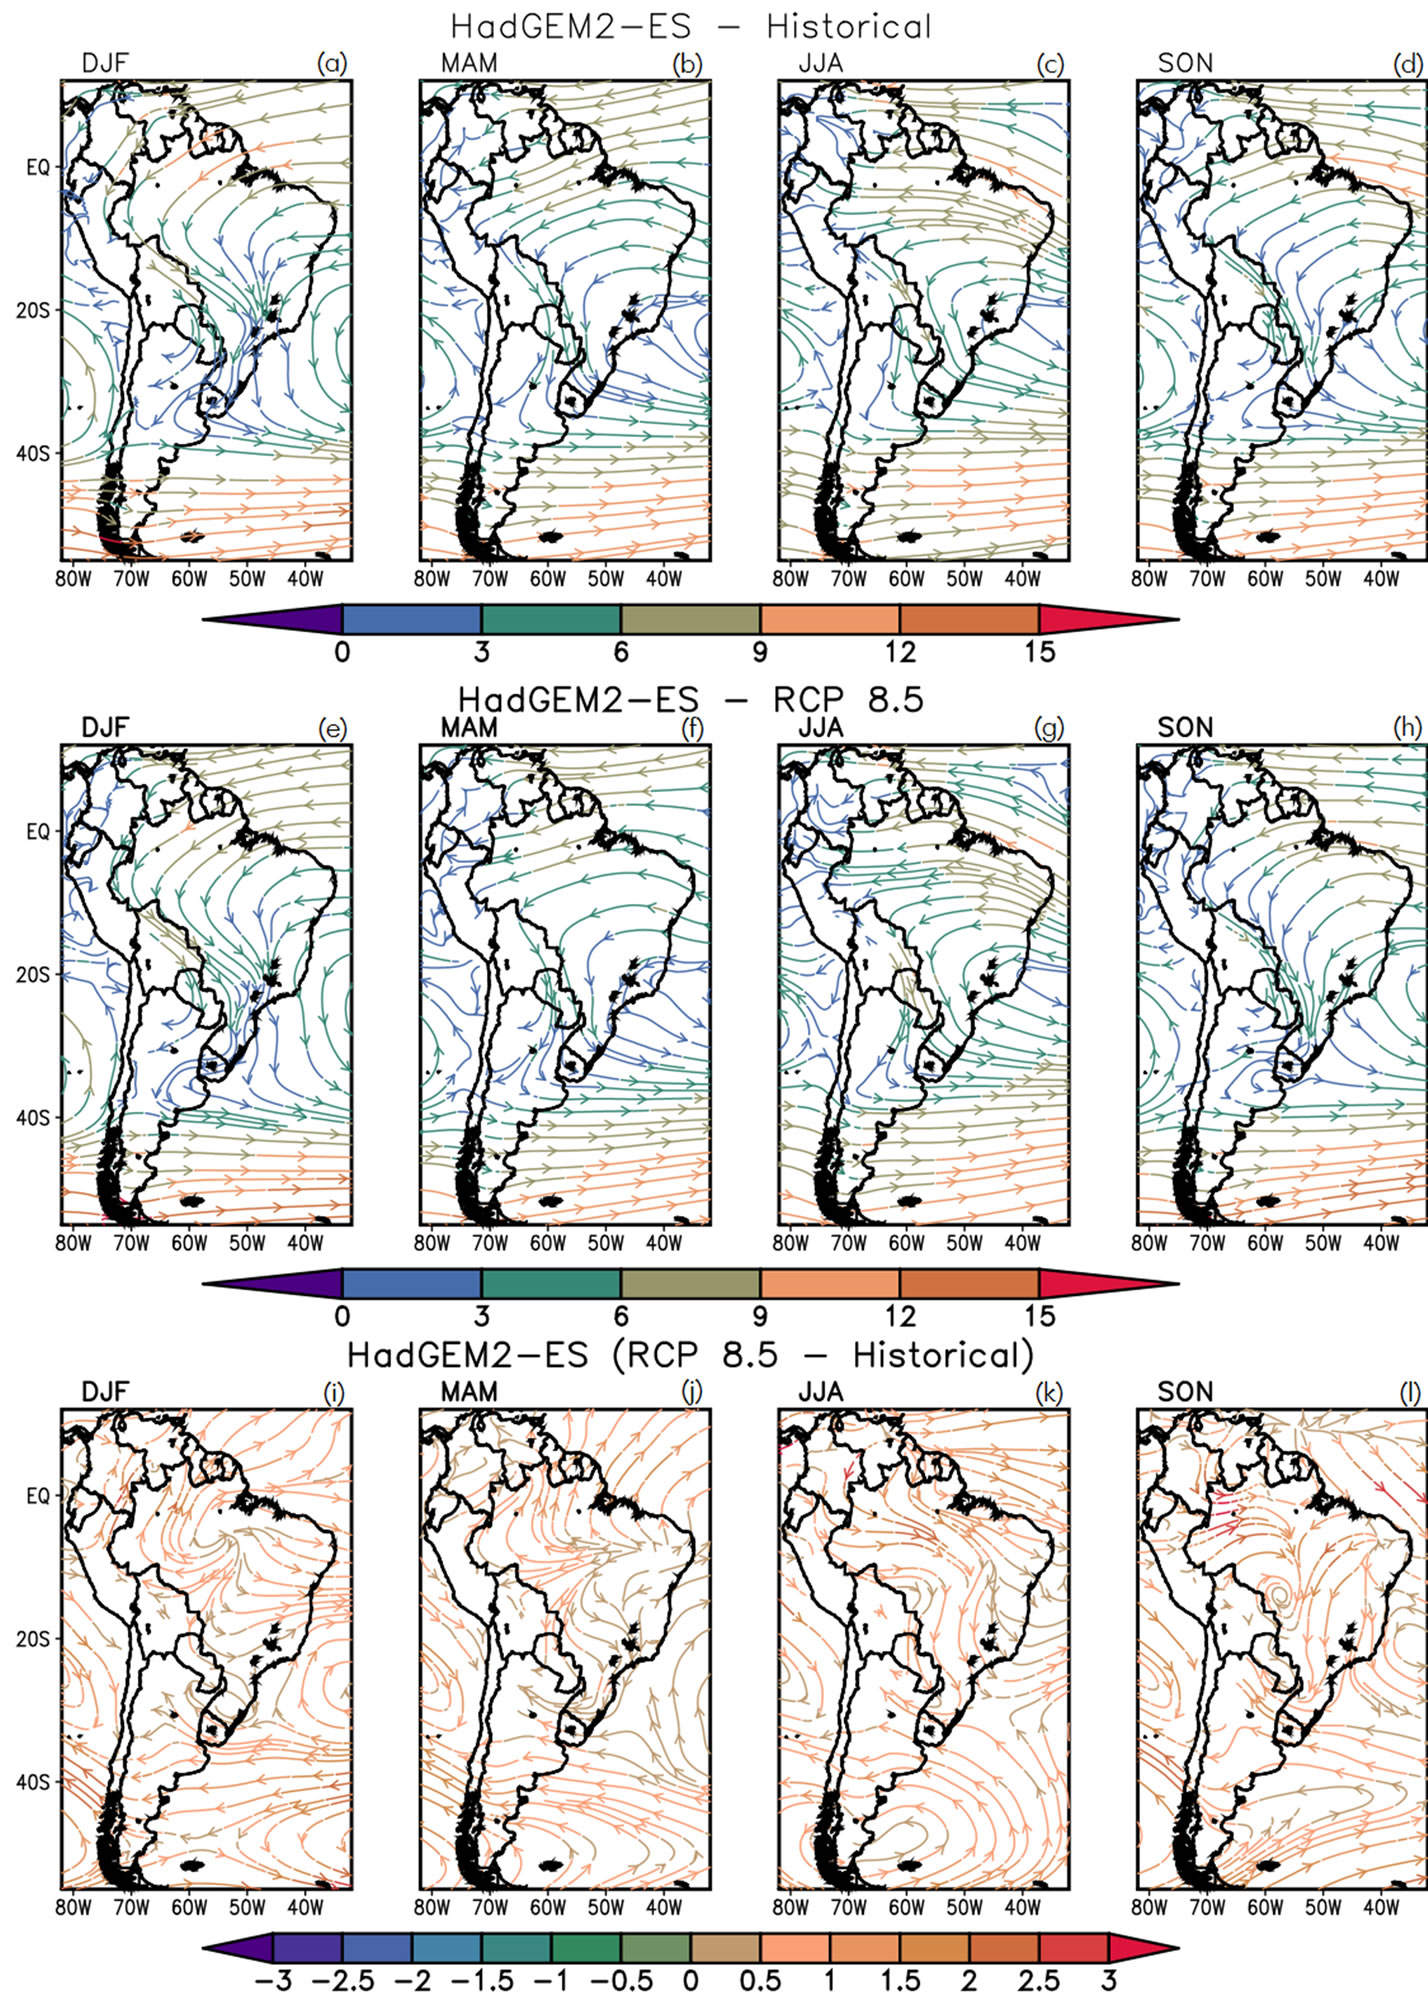
Figure 3. Wind field (m/s) at 850 hPa in the four seasons (1st row: HadGEM2-ES-present time; 2nd row: HadGEM2-ES-future time; 3rd row: difference future-present).
eastward when reaching the Andes cordillera [27]. Another feature represented by the model is the intensification of the Subtropical Atlantic High in JJA indicated by the intensified anticyclonic circulation over the continent.
The projections (Figures 3(e)-(h)) show an increase of the low level wind flow southward, over central South America, in all seasons, transporting humidity from tro pical to extratropical regions that explains the increased precipitation in the southern regions. In DJF, season of the mature lifecycle of the South American Monsoon System, the flow from tropical regions is also intensified toward southeastern Brazil, increasing the humidity and the precipitation in the RCP8.5 scenario. In this summer season, the cyclonic circulation in the difference field indicates the weakening of the Subtropical Atlantic High, one of the features of the monsoon onset [27] and could suggest an increase of the monsoon features.
The reduced precipitation in the tropical South America can be associated with the reduction of moisture flux from the ocean to the continent due to the weakening of the trade winds over the North Atlantic.
At high levels, the model reproduces the Bolivian High and the Atlantic trough in DJF, typical features of the summer season (Figure 4(a)). The intensification of westerlies over the continent in JJA is well simulated as well as the transition features in MAM and SON (Figures 4(b)-(d)). However the model underestimates the anticyclonic circulation of the Bolivian High and the cyclonic circulation of the Atlantic trough (figures of reanalysis fields not shown). The model overestimates the westerlies at subtropical latitudes in the four seasons.
In the future projections, there is a weakening of the Bolivian High circulation and an eastward displacement of the Atlantic trough in the summer (Figures 4(e)-(l)). The projections also indicate an increase of the westerlies in the subtropics in the four seasons. The weakening of the Bolivian High is consistent with the reduced precipitation in Amazonia in DJF, and the increase of the subtropical jet in all seasons is consistent with the precipitation increase in southern regions, due to the increase of dynamical instability.
3.2. Temperature near the Surface
Temperature fields simulated by the model at 1.5 m and the differences from reanalyses-ERA-Interim are shown in Figure 5. The model simulates well the differences of temperature at middle latitudes from the summer to winter, reproducing the minimum seasonal average temperature in the extreme south of South America and the colder means at subtropical regions in JJA. However, the model underestimates the values in large areas of the continent, notably in central regions in JJA. This error could be related to excess of clouds over the region in the model that prevents the short wave radiation to reach the surface. This is the dry season in central and southeastern Brazil, and solar radiation is large, heating the air at the surface.
Over the whole continent the temperatures are higher in the future projections than in the present climate (Figure 6). The changes are between 6˚C and 8˚C in the tropical regions and between 2˚C and 4˚C in the extratropical regions. The greatest heating over South America is projected for SON when large areas of central Brazil reach temperature variations higher than 8˚C.
The larger temperature increase over the continent relative to that over the ocean could have an impact on pressure differences and in the South American monsoonal circulation. In fact, during the South American Monsoon onset there is a reduction of pressure in the South Atlantic Subtropical High [27]. The weakening of this Subtropical High in the future projections was discussed in Section 3.1. The increased SST in the tropical Atlantic (figures not shown) can be related to the weakening of the trade winds and the reduction of moisture flux to the northern South America discussed in Section 3.1. Increased SST near the Northwestern South American coast can explain the increased precipitation in this region of the continent in future projections.
3.3. SACZ Variability
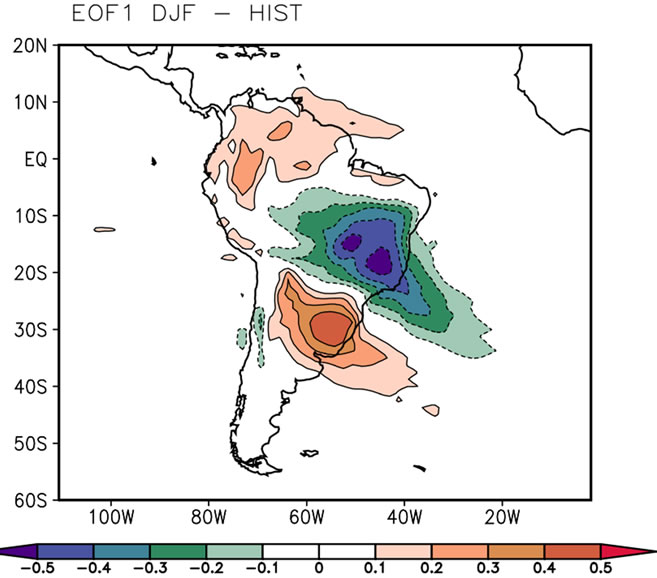
In the present study, the SACZ pattern is obtained from Empirical Orthogonal Function (EOF) analyses of precipitation daily anomalies from HadGEM2-ES during the period of DJF 1979/1980 to 2004/2005 and DJF 2073/ 2074 to 2098/2099 (Figures 7(a) and (b)). The first mode, depicting the SACZ pattern explains 17.6% and 19.7% of the total variance for the present and future projections, respectively. This pattern is related to the seesaw discussed in [8].
The model reproduces the precipitation dipole in the two periods, but the intensity of the SACZ center is greater in the present time, while in the future projections the southern center is more intense. This dipole features are linked to the variability in the SACZ and SESA.
When there is precipitation intensification in the SACZ, there is deficit in SESA, associated with wave trains PSAtype from the Pacific region [8-11]. The opposite situation (excess of rainfall over SESA and lack of precipitation in the SACZ region) is associated with the opposite phase of PSA. The Low Level Jet [28] that brings moisture from tropical to extratropical regions contributes also to the rainfall excess over SESA [8].
There is an increase in the amplitude of positive and negative phases from 1979 to 2004 (Figure 7(c)), but in the series of future projection (Figure 7(d)), there is
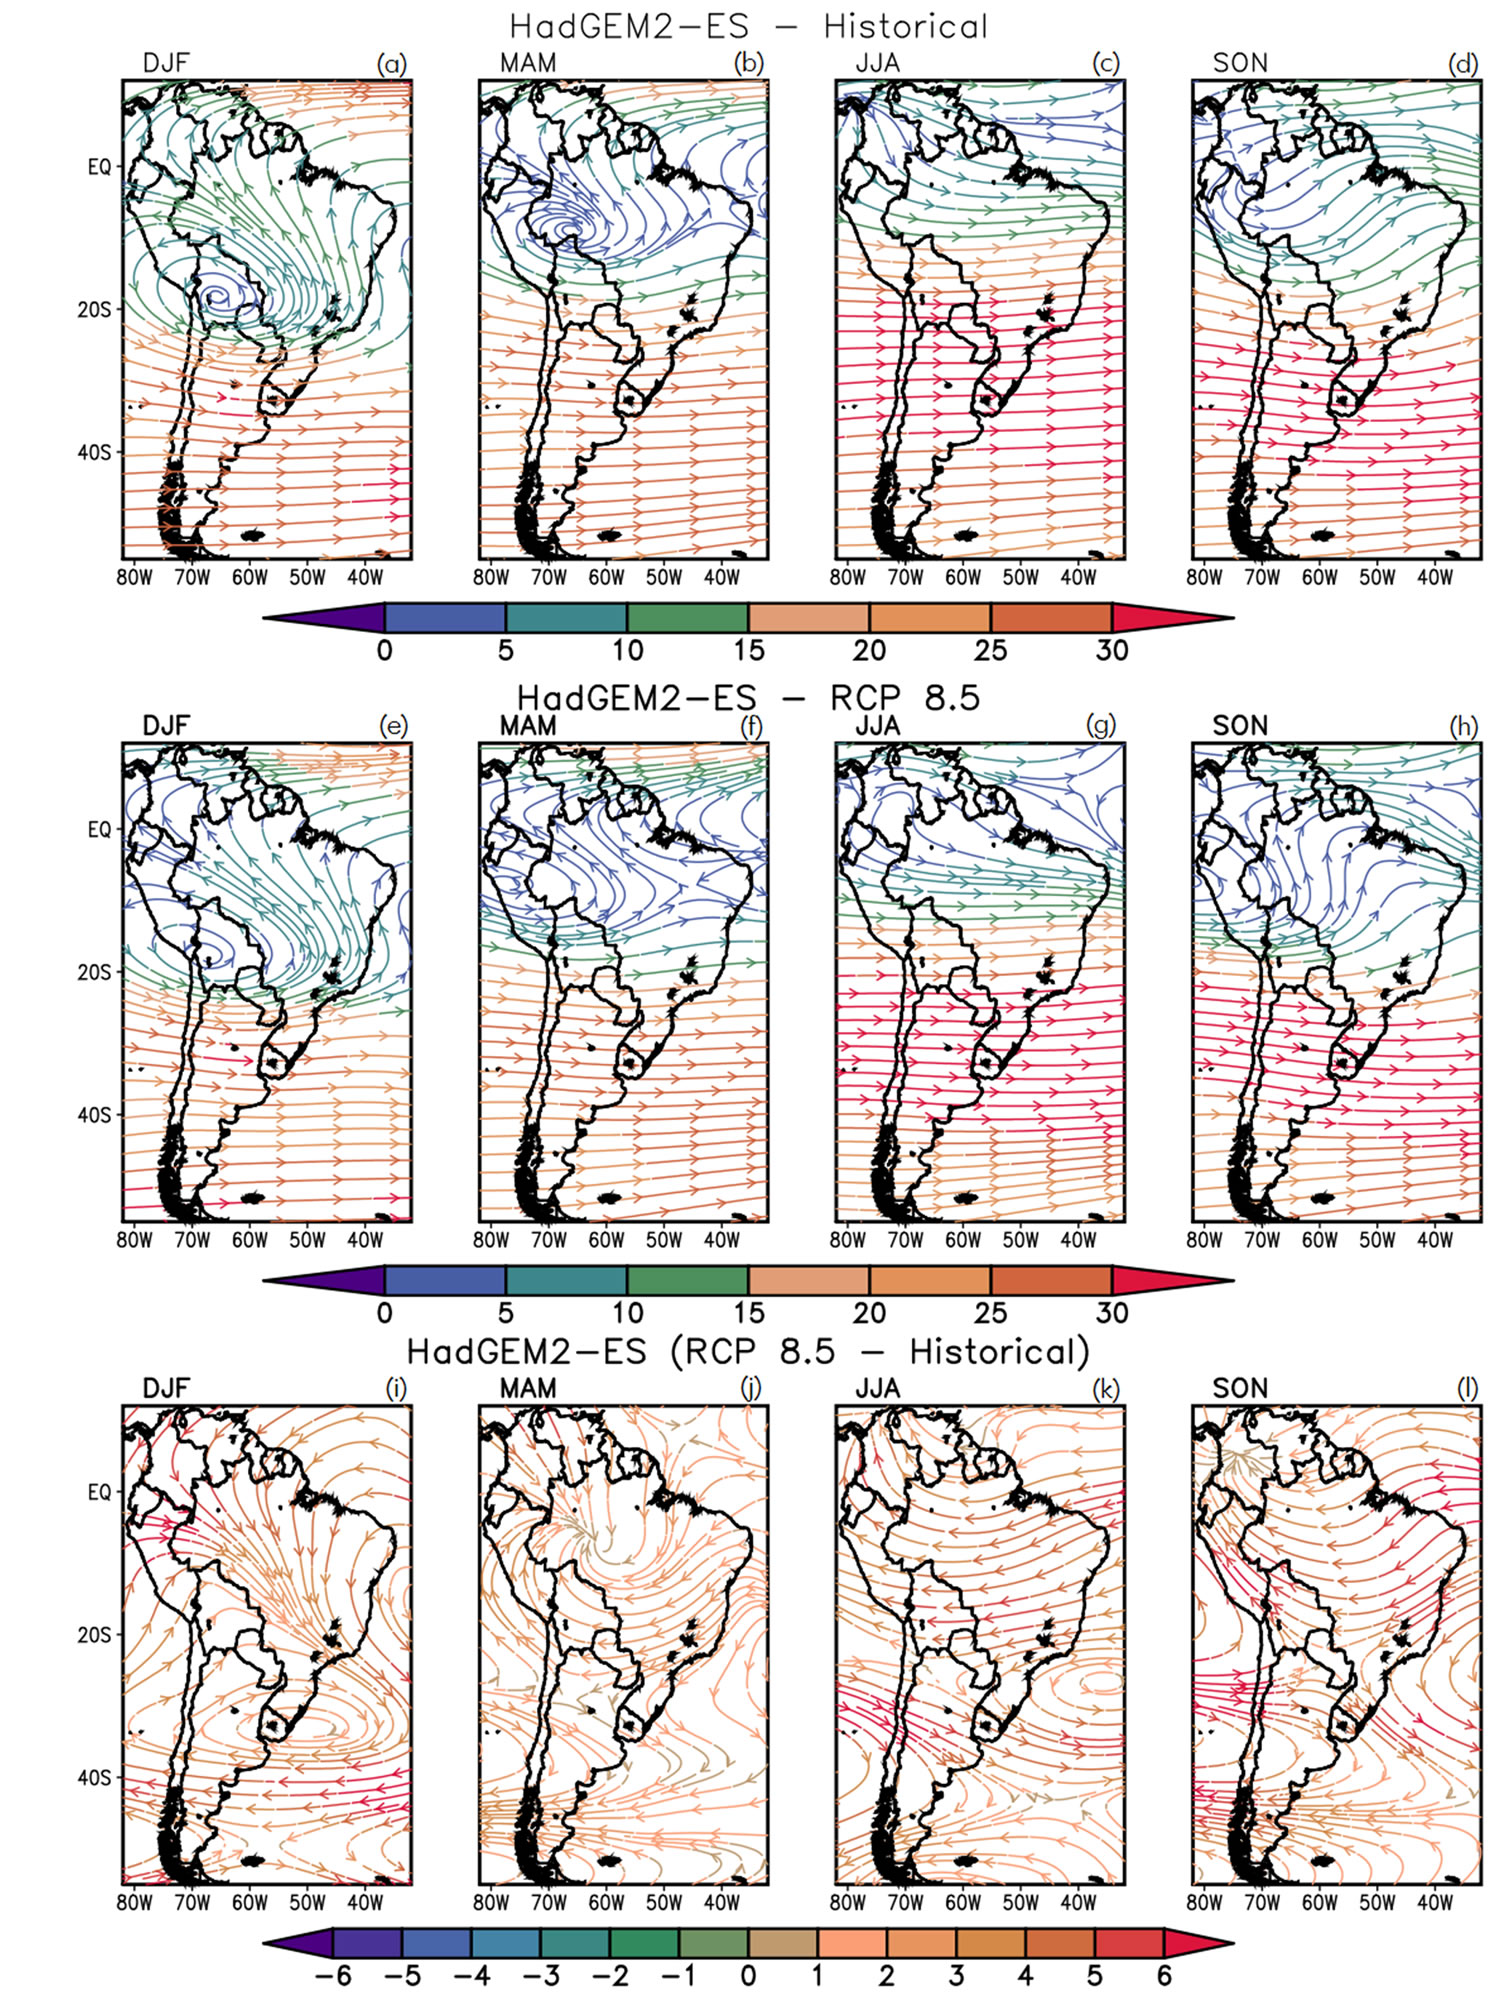
Figure 4. Wind field (m/s) at 200 hPa in the four seasons (1st row: HadGEM2-ES-present time; 2nd row: HadGEM2-ES-future time; 3rd row: difference future-present).
large variability with less positive extreme amplitudes in the last decade.
3.4. The PSA Mode
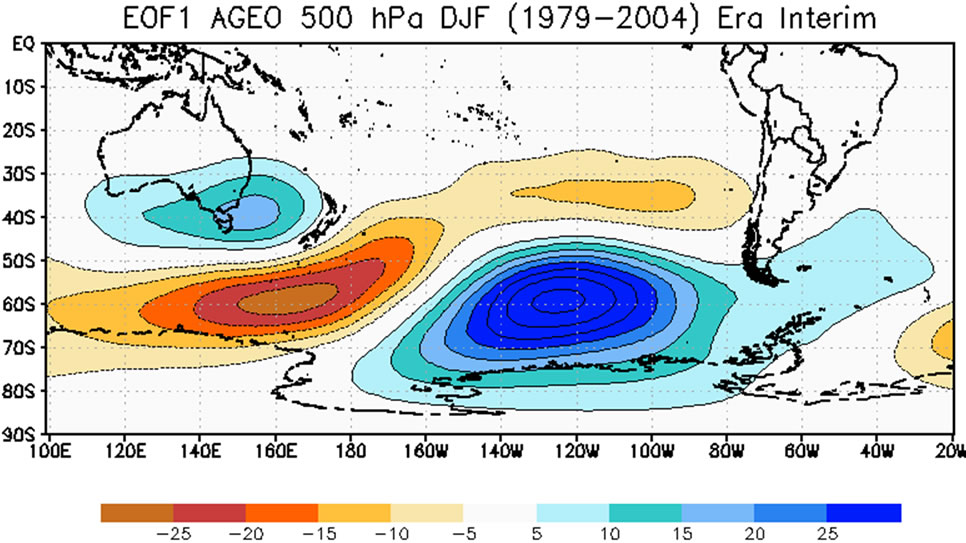
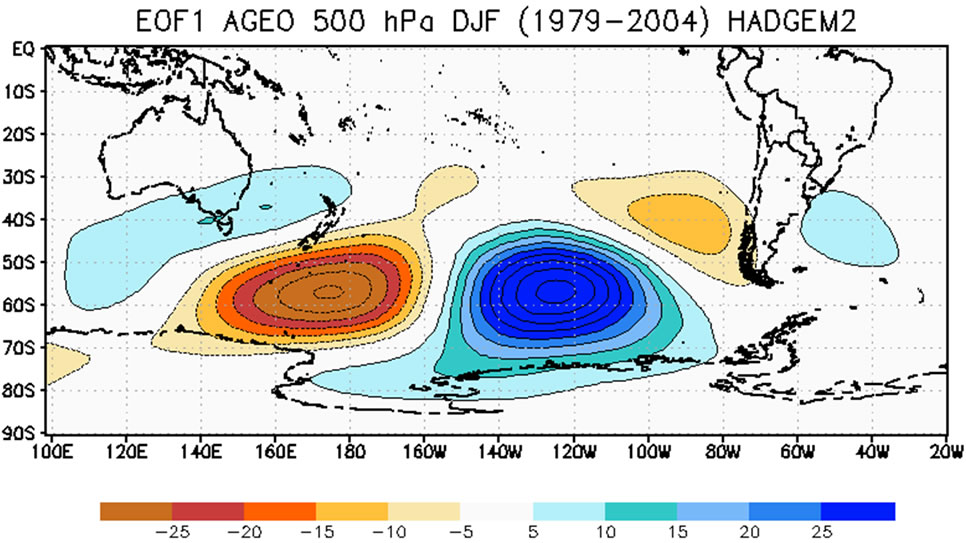
EOF analysis was applied to DJF geopotencial height at 500 hPa of ERA Interim data set and HadGEM2-ES in the present (1979/1980 to 2004/2005) and future (2073/ 2074 to 2098/2099). The zonal mean at each latitude was removed to get the eddy component. Thus, the first two EOFs represent PSA1 and PSA2, as in [13]. These two modes are linked to tropical convection in different longitudes that triggers wave trains to the extratropics.
The two modes simulated by ERA-Interim are presented in Figure 8. They explain 28.6% and 16.4% of the total variance and show the main features of the PSA-the wave train from tropics to extratropics over the Pacific Ocean and then to the tropics again over South America, more organized in PSA2. The displacement of the centers eastward, from PSA1 to PSA2, observed in [13] is also noticed here, indicating an evolution from one pattern to another.
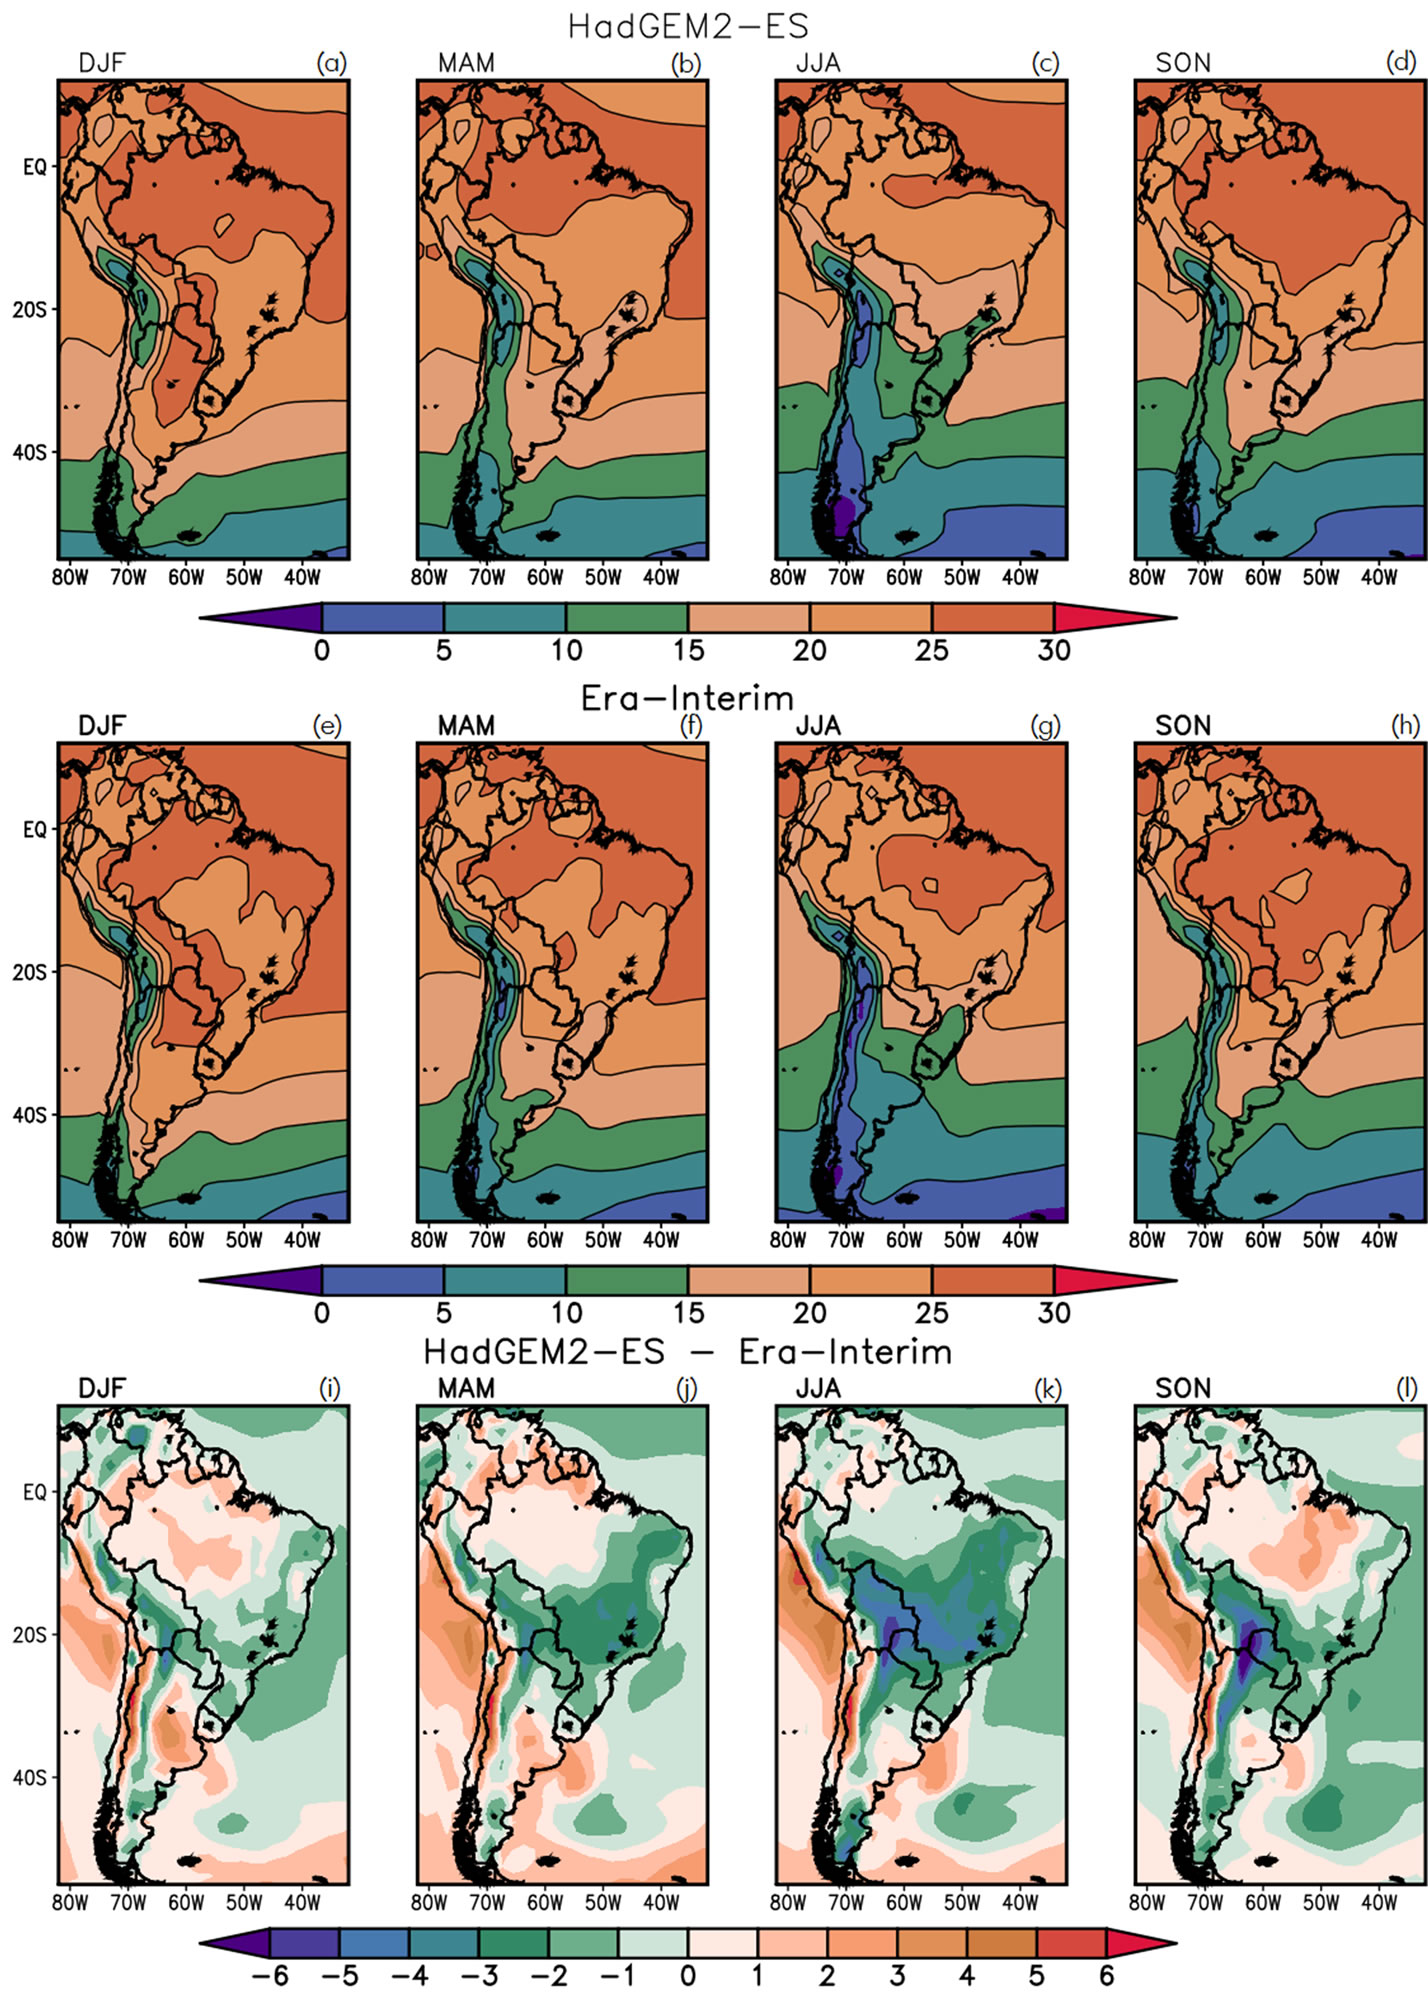
Figure 5. Temperature (˚C) at 1.5 m in the four seasons (1st row: HadGEM2-ES; 2nd row: ERA Interim; 3rd row: difference model-reanalyses).
The model simulates quite well the two patterns, and the position of the centers in PSA1 and PSA2, even the eastward displacements from PSA1 to PSA2 (Figure 9). The two modes explain 24.8% and 21.9% of the total variance, respectively. The projections indicate an eastward shifting of PSA1, compared to PSA1 and PSA2 of present climate, and a zonal wave train from the southeastern Pacific to Atlantic Ocean in the second mode, different from the PSA behavior (Figure 10). These modes explain 31.1% and 18.0% of the total variance, respectively. The time series of PC amplitudes show that there are persistence periods of each phase in several years in the reanalysis and in the model simulations and projections.
4. Conclusions
The integrations of CMIP5 HadGEM2-ES analyzed for South America during the present (1979-2004) indicated a good performance of the model in reproducing the main features of seasonal precipitation, temperature and atmospheric circulation variability over South America

Figure 6. Temperature (˚C) at 1.5m in the four seasons (1st row: HadGEM2-ES-present time; 2nd row: HadGEM2-ES-future time; 3rd row: difference future-present).
and the dominant modes of variability of precipitation (SACZ) and circulation (PSA). Although there are large systematic errors in temperature near the surface, mainly the underestimation in MAM and JJA, differences of temperature from the summer to winter in the extratropical South America are well reproduced. The model also captures the precipitation variability between these two seasons over central and southeastern Brazil. The wind fields at high levels display the Bolivian High and the Atlantic trough, which are summer features of South America. The changes in wind flow directions at low levels from summer to winter are reproduced by the model. The good reproducibility of these features gives confidence on the projected results for the future.
Changes in future projections (2073-2098) obtained from HadGEM2-ES show precipitation increase over southern Brazil in the four seasons and in other areas of La Plata basin in some seasons. Rainfall increase is also projected over tropical western South America in MAM and JJA. Less precipitation than in the present time is projected over eastern Amazonia, northern South America and southern Chile. The changes are consistent with
 (a)
(a)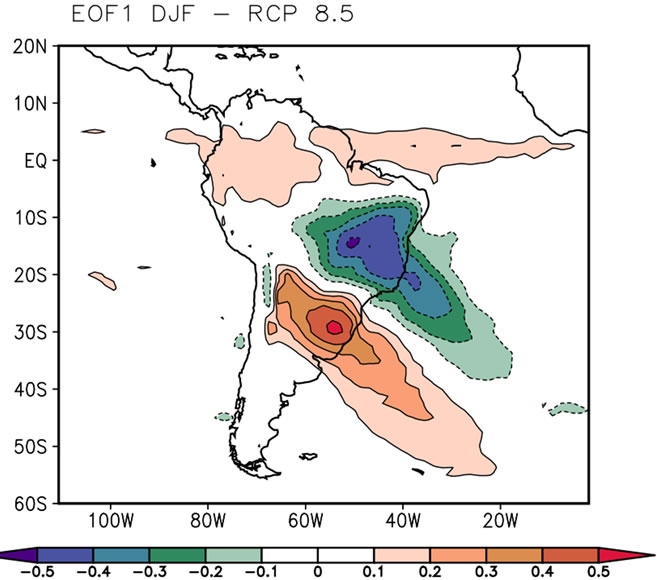 (b)
(b)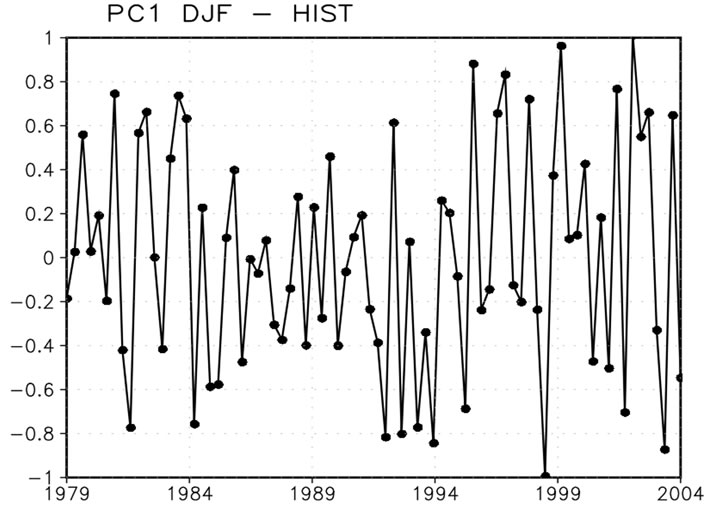 (c)
(c)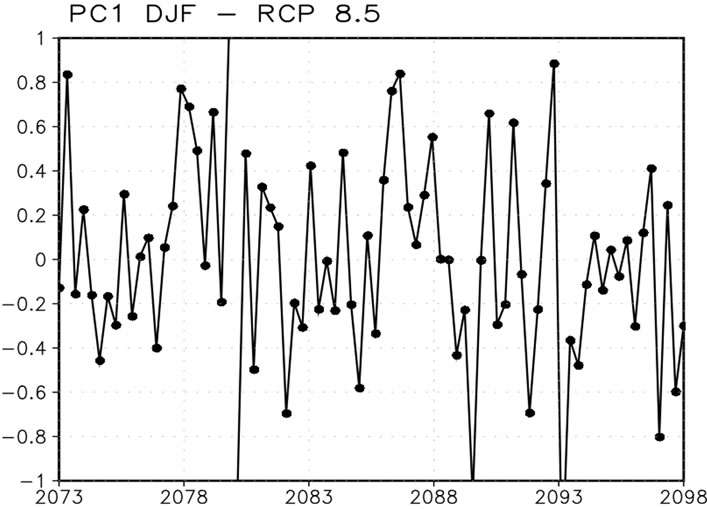 (d)
(d)
Figure 7. First EOF of daily anomaly precipitation in DJF (a) HadGEM2-ES present; (b) HadGEM2-ES future; (c) Amplitudes of PC1 averaged in D, J, F (present); (d) Amplitudes of PC1 averaged in D, J, F (future).
 (a)
(a)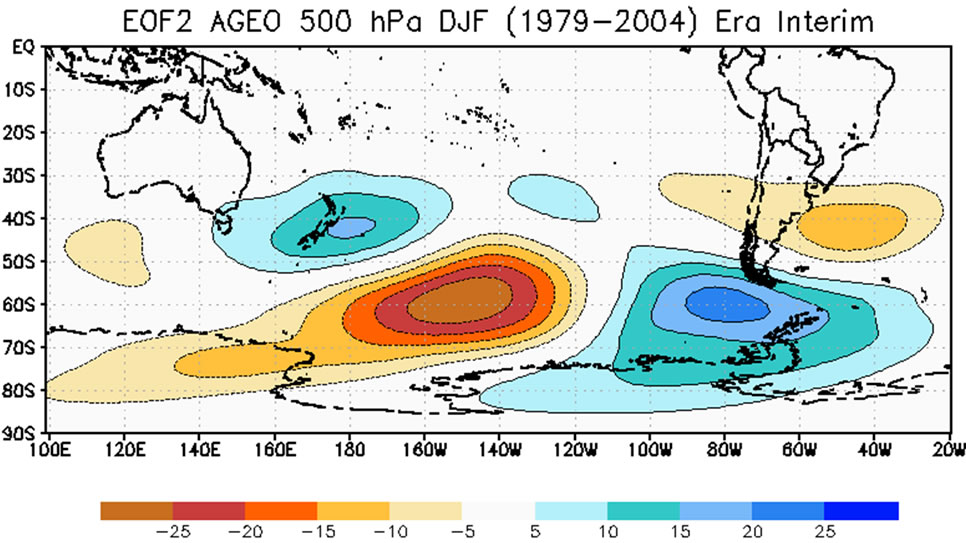 (b)
(b)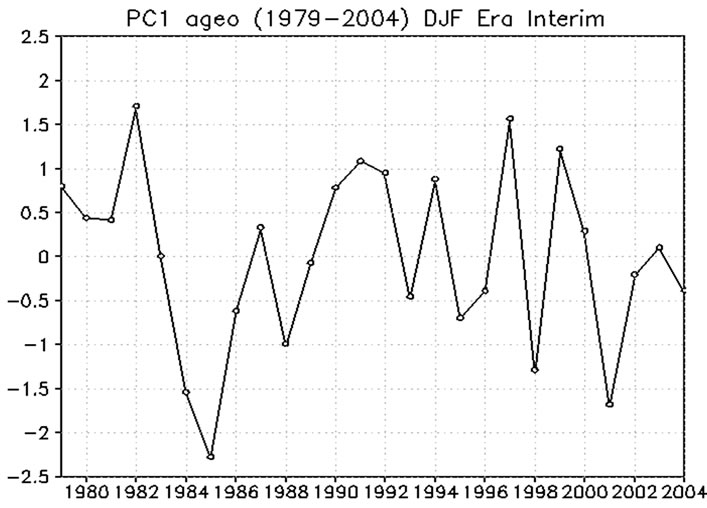 (c)
(c)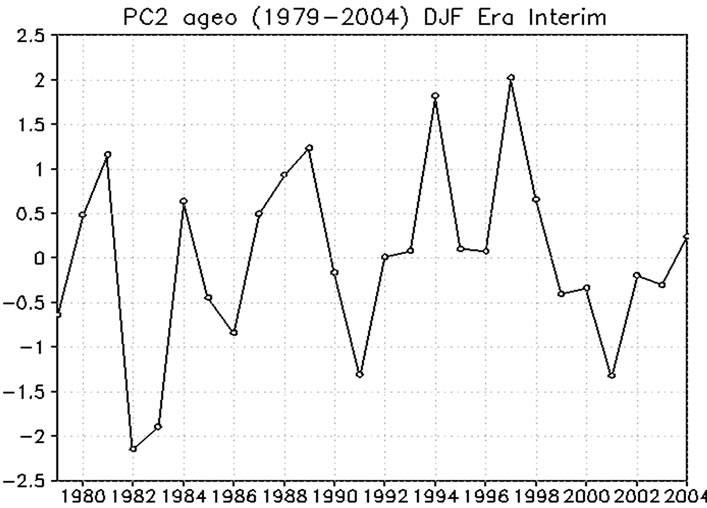 (d)
(d)
Figure 8. (a) PSA1 in DJF from zonal asymmetric geopotencial anomaly at 500 hPa (Era Interim); (b) PC1 amplitudes serie (1979-2004); (c) PSA2 in DJF from zonal asymmetric geopotencial anomaly at 500 hPa (Era Interim); (d) PC2 amplitudes serie (1979-2004).
 (a)
(a)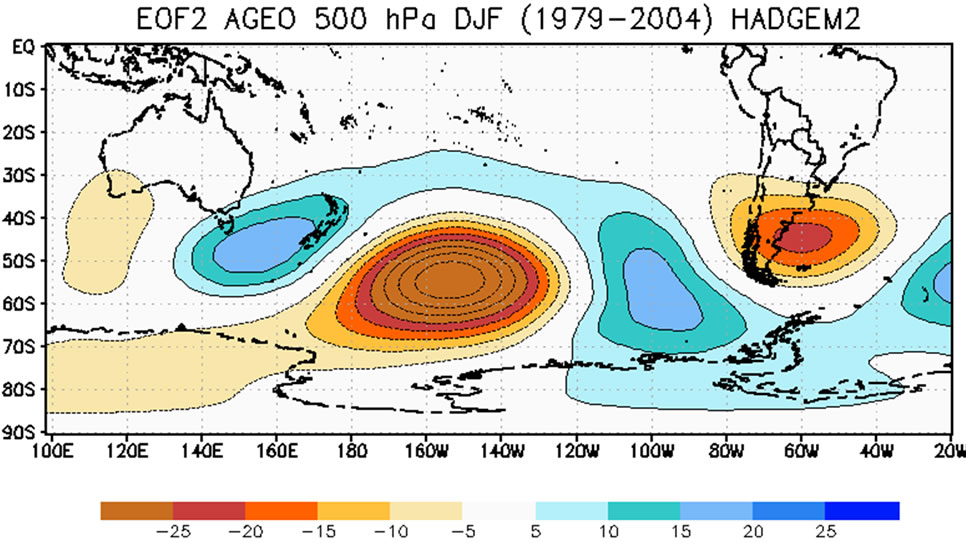 (b)
(b)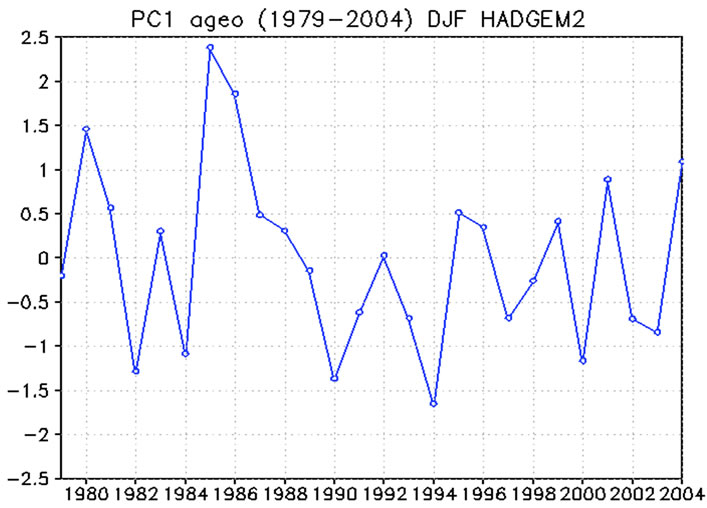 (c)
(c)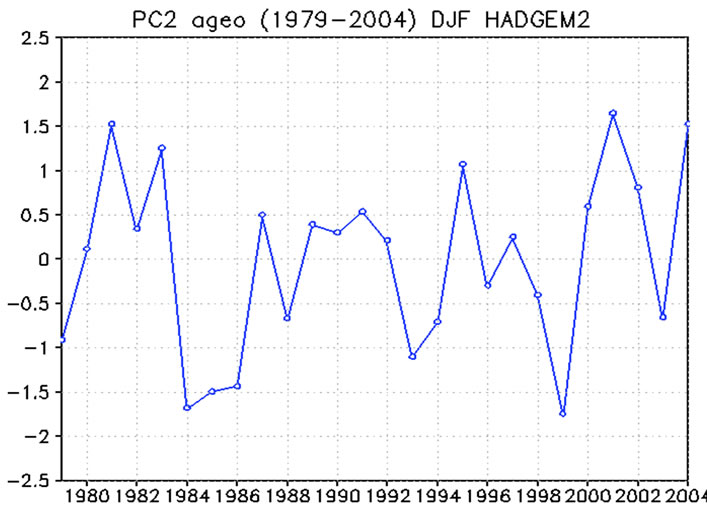 (d)
(d)
Figure 9. (a) PSA1 in DJF from zonal asymmetric geopotencial anomaly at 500 hPa (HadGEM2-historical); (b) PC1 amplitudes serie (1979-2004); (c) PSA2 in DJF from zonal asymmetric geopotencial anomaly at 500 hPa (HadGEM2-historical); (d) PC2 amplitudes serie (1979-2004).
 (a)
(a) (b)
(b)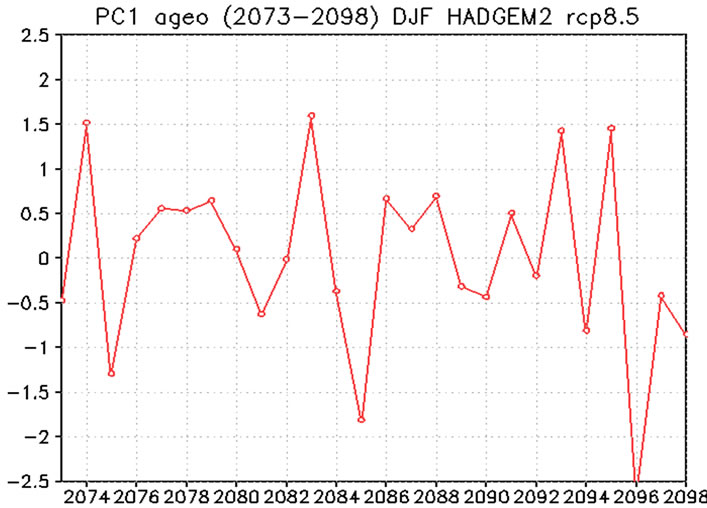 (c)
(c)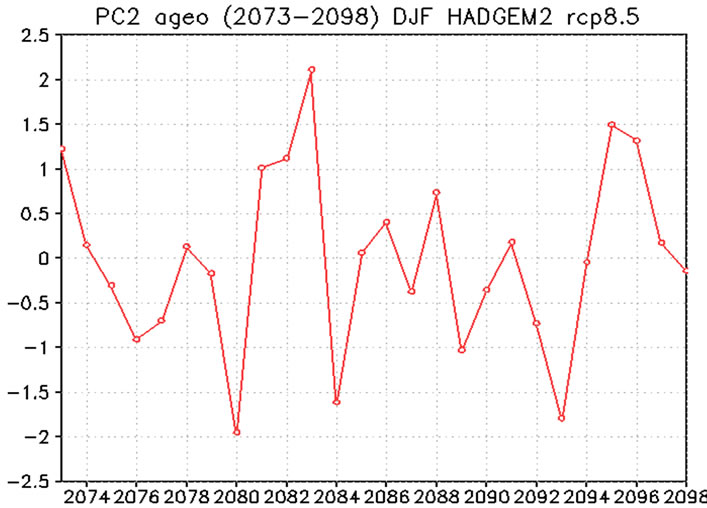 (d)
(d)
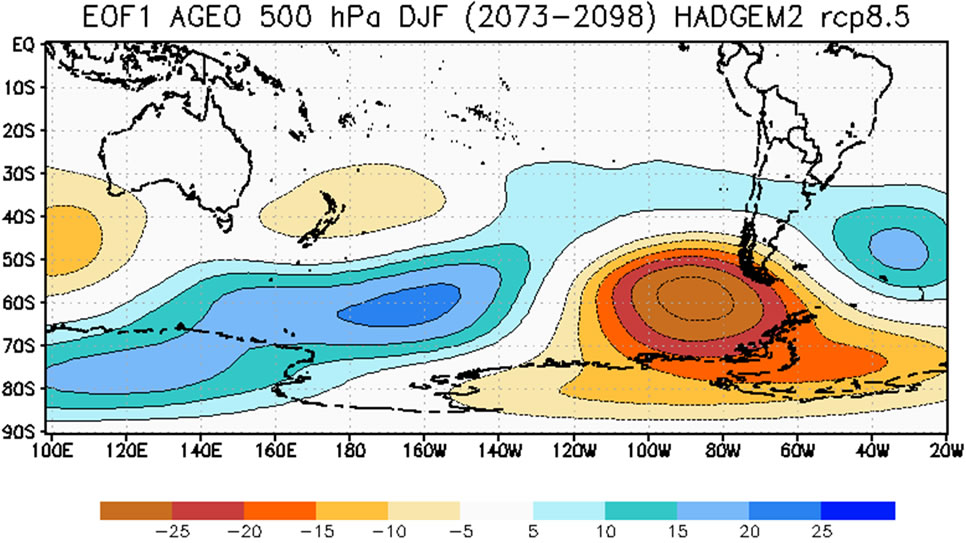
Figure 10. (a) PSA1 in DJF from zonal asymmetric geopotencial anomaly at 500 hPa (HadGEM2-RCP8.5); (b) PC1 amplitudes serie (2073-2098); (c) PSA2 in DJF from zonal asymmetric geopotencial anomaly at 500 hPa (HadGEM2-RCP8.5); (d) PC2 amplitudes serie (2073-2098).
changes in the atmospheric circulation at low and high levels, such as the reduction of low level flow from North Atlantic towards northern South America, increase of low level flow over central Brazil southwards, weakening of Bolivian High and increase of subtropical jet stream.
The future projections indicate a warming over the whole continent, larger over Amazonia region in the four seasons and in central South America during SON.
The dipole mode of precipitation variability associated with the SACZ is reproduced in both periods (present and future), but the intensity of anomalies is reduced in the northern center and increased in the southern center in the future projection. This is consistent with the increase of precipitation in the southern center obtained in [18], for the positive phase. The negative and positive anomalies increase from 1979 to 2004 and in the future projections there is large variability, with less extremes occurring in the positive phase in the last decade of 21st century. In the present climate the model reproduces the two PSA patterns, which represent the wave train evolution. However, in the future projection it displays only one pattern shifted eastward. The changes in the future patterns could change the variability of circulation anomalies over South America. As discussed in [13] the two modes represent the evolution of the wave trains associated with convection anomalies in the tropical Pacific. More analyses need to be done to investigate the links of these projected modes with the tropical convection in future climate.
5. Acknowledgements
We thanks CNPq and Claris-LPB for research support. The research leading to these results has received funding from the European Community’s Seventh Framework Programme (FP7/2007-2013) under Grant Agreement No. 212492: CLARIS LPB. A “Europe-South America Network for Climate Change Assessment and Impact Studies in La Plata Basin”. “We acknowledge the World Climate Research Programme’s Working Group on Coupled Modelling, which is responsible for CMIP, and we thank the climate modeling group of Hadley Centre for producing and making available their model output. For CMIP the US Department of Energy’s Program for Climate Model Diagnosis and Intercomparison provides coordinating support and led development of software infrastructure in partnership with the Global Organization for Earth System Science Portals.”
REFERENCES
- K. E. Taylor, R. J. Stouffer and G. A Meehl, “An Overview of CMIP5 and the Experiment Design,” Bulletin of the American Meteorological Society, Vol. 93, No. 4, 2011, pp. 485-498. Hdoi:10.1175/BAMS-D-11-00094.1
- K. E. Taylor, R. J. Stouffer and G. A. Meehl, “A Summary of the CMIP5 Experiment Design,” 2009. http://cmip-pcmdi.llnl.gov/cmip5/docs/Taylor_CMIP5_design.pdf
- I. F. A. Cavalcanti, “Large Scale and Synoptic Features Associated with Extreme Precipitation over South America: A Review and Case Studies for the First Decade of the 21st Century,” Atmospheric Research, Vol. 118, 2012, pp. 27-40. Hdoi:10.1016/j.atmosres.2012.06.012
- Solomon, et al., “Contribution of Working Group I to the Fourth Assessment Report of the Intergovernmental Panel on Climate Change,” Working Group I Report, The Physical Science Basis, Cambridge University Press, Cambridge and New York, 2007.
- C. Vera, G. Silvestri, B. Liebmann and P. Gonzalez, “Climate Change Scenarios for Seasonal Precipitation in South America from IPCC-AR4 Models,” Geophysical Research Letters, Vol. 33, 2006, 4 p. Hdoi:10.1029/2006GL025759
- A. Seth, M. Rojas and S. A. Rauscher, “CMIP3 Projected Changes in the Annual Cycle of the South American Monsoon,” Climatic Change, Vol. 98, No. 3-4, 2010, pp. 331-357. Hdoi:10.1007/s10584-009-9736-6
- R. J. Bombardi and L. M. V. Carvalho, “IPCC Global Coupled Model Simulations of the South America Monsoon System,” Climate Dynamics, Vol. 33, No. 7-8, 2009, pp. 893-916. Hdoi:10.1007/s00382-008-0488-1
- J. Nogues-Paegle and K. C. Mo, “Alternating Wet and Dry Conditions over South America during Summer,” Monthly Weather Review, Vol. 125, No. 2, 1997, pp. 279- 291. Hdoi:10.1175/1520-0493(1997)125<0279:AWADCO>2.0.CO;2
- F. C. Vasconcellos and I. F. A. Cavalcanti, “Extreme Precipitation over Southeastern Brazil in the Austral Summer and Relations with the Southern Hemisphere Annular Mode,” Atmospheric Science Letters, Vol. 11, No. 1, 2010, pp. 21-26.
- C. A. C. Cunningham and I. F. A. Cavalcanti, “Intraseasonal Modes of Variability Affecting the South Atlantic Convergence Zone,” International Journal of Climatology, Vol. 26, No. 9, 2006, pp. 1165-1180. Hdoi:10.1002/joc.1309
- L. M. V. Carvalho, C. Jones and B. Liebmann, “The South Atlantic Convergence Zone: Intensity, Form, Persistence, and Relationships with Intraseasonal to Interannual Activity and Extreme Rainfall,” Journal of Climate, Vol. 17, No. 1, 2004, pp. 88-108. HUhttp://dx.doi.org/U10.1175/1520-0442(2004)017<0088:TSACZI>2.0.CO;2
- B. Liebmann, G. N. Kiladis, J. A. Marengo, T. Ambrizzi and J. D. Glick, “Submonthly Convective Variability over South America and the South Atlantic Convergence Zone,” Journal of Climate, Vol. 12, No. 7, 1999, pp. 1877-1891. Hdoi:10.1175/1520-0442(1999)012<1877:SCVOSA>2.0.CO;2
- K. C. Mo and R. W. Higgins, “The Pacific-South American Modes and Tropical Convection during the Southern Hemisphere Winter,” Monthly Weather Review, Vol. 126, No. 6, 1998, pp. 1581-1596. Hdoi:10.1175/1520-0493(1998)126<1581:TPSAMA>2.0.CO;2
- J. M. Wallace and D. S. Gutzler, “Teleconnections in the Geopotential Height Field during the Northern Hemisphere Winter,” Monthly Weather Review, Vol. 109, No. 4, 1981, pp. 784-812. Hdoi:10.1175/1520-0493(1981)109<0784:TITGHF>2.0.CO;2
- I. F. A. Cavalcanti, “Teleconnection Patterns Orographically Induced in Model Results and from Observational Data in the Austral Winter of the Southern Hemisphere,” International Journal of Climatology, Vol. 20, No. 10, 2000, pp. 1191-1206. Hdoi:10.1002/1097-0088(200008)20:10<1191::AID-JOC523>3.0.CO;2-G
- J. A. Marengo, T. Ambrizzi, G. Kiladis and B. Liebmann, “Upper-Air Wave Trains over the Pacific Ocean and Wintertime Cold Surges in Tropical-Subtropical South America Leading the Freezes in Southern and Southeastern Brazil,” Theoretical and Applied Climatology, Vol. 73, No. 3-4, 2002, pp. 223-242. Hdoi:10.1007/s00704-001-0669-x
- C. Vera and G. Silvestri, “Precipitation Interannual Variability in South America from the WCRP-CMIP3 Multi-Model Dataset,” Climate Dynamics, Vol. 32, No. 7-8, 2009, pp. 1003-1014. Hdoi:10.1007/s00382-009-0534-7
- C. Junquas, C. Vera, L. Li and H. Le Treut, “Summer Precipitation Variability over Southeastern South America in a Global Warming Scenario,” Climate Dynamics, Vol. 38, No. 9-10, 2011, pp. 1867-1883. Hdoi:10.1007/s00382-011-1141-y
- R. F. Adler, et al., “The Version 2 Global Precipitation Climatology Project (GPCP) Monthly Precipitation Analysis (1979-Present),” Journal of Hydrometeorology, Vol. 4, No. 6, 2003, pp. 1147-1167. doi:10.1175/1525-7541(2003)004<1147:TVGPCP>2.0.CO;2
- D. P. Dee, et al., “The ERA-Interim Reanalysis: Configuration and Performance of the Data Assimilation system,” Quarterly Journal of Royal Meteorological Society, Vol. 137, No. 656, 2011, pp. 553-597. Hdoi:10.1002/qj.828
- T. C. Johns, et al., “The New Hadley Centre Climate Model (HadGEM1): Evaluation of Coupled Simulations,” Journal of Climate, Vol. 19, No. 7, 2006, pp. 1327-1353. Hdoi:10.1175/JCLI3712.1
- G. M. Martin, M. A. Ringer, V. D. Pope, A. Jones, C. Dearden and T. J. Hinton, “The Physical Properties of the Atmosphere in the New Hadley Centre Global Environmental Model (HADGEM1), Part I: Model Description and Global Climatology,” Journal of Climate, Vol. 19, No. 7, 2006, pp. 1274-1301. Hdoi:10.1175/JCLI3636.1
- W. G. Collins, et al., “Hadley Centre, Evaluation of the HadGEM2 Model,” Technical note 74 at Hadley Centre, 2008, 47 p.
- W. G. Collins, et al., “Development and Evaluation of an Earth-System Model—HadGEM2,” Geoscientific Model Development, Vol. 4, 2011, pp. 997-1062. Hdoi:10.5194/gmdd-4-997-2011
- C. D. Jones, et al., “The HadGEM2-ES Implementation of CMIP5 Centennial Simulations,” Geoscientific Model Development, Vol. 4, 2011, pp. 689-763. Hdoi:10.5194/gmdd-4-689-2011
- I. F. A. Cavalcanti, et al., “Global Climatological Features in a Simulation Using CPTEC/COLA AGCM,” Journal of Climate, Vol. 15, No. 21, pp. 2965-2988. Hdoi:10.1175/1520-0442(2002)015<2965:GCFIAS>2.0.CO;2
- A. Raia and I. F. A. Cavalcanti, “The Life Cycle of the South American Monsoon System,” Journal of Climate, Vol. 21, No. 23, 2008, pp. 6227-6246. Hdoi:10.1175/2008JCLI2249.1
- J. A. Marengo, W. Soares, C. Saulo and M. Nicolini, “Climatology of the LLJ East of the Andes as Derived from the NCEP Reanalyses,” Journal of Climate, Vol. 17, No. 12, 2004, pp. 2261-2280.